This research presents a comprehensive assessment of the latest YOLOv8 architecture’s suitability for object detection applications, specifically adapted for smoke and wildfire recognition, with particular attention to agricultural and environmental safeguarding. Every available YOLOv8 variant underwent initial fine-tuning on a field-specific dataset that covers diverse conditions essential for robust agricultural oversight. Performance indicators led to selecting the ‘large’ model (YOLOv8l) for deeper hyperparameter tuning. This model was subjected to meticulous hyperparameter refinement via the One Factor At a Time (OFAT) strategy, zeroing in on pivotal variables such as learning rate, batch size, weight decay, epochs, and optimizer. Knowledge gained from the OFAT phase was used to define search boundaries for the subsequent Random Search (RS). The ultimate model produced through RS displayed considerable advancement over the baseline fine-tuned version, boosting overall precision by 1.39%, recall by 1.48%, F1-score by 1.44%, [email protected] by 0.70%, and [email protected]:0.95 by 5.09%. The improved model’s performance was confirmed across a wide range of real-world photographs depicting different agricultural landscapes, affirming its robustness in smoke and fire recognition. These outcomes underscore the model’s trustworthiness and practical value in contexts vital to agricultural protection and environmental surveillance. This investigation, marking a notable leap forward in machine learning-based fire and smoke identification, lays a firm foundation for subsequent inquiries and innovations aimed at protecting agricultural areas and natural ecosystems.
The phenomenon of wildfires represents a layered and intricate crisis whose frequency and severity are on the rise worldwide [1]. Beyond posing a direct threat to communities and built infrastructure, these conflagrations have deep agricultural repercussions, triggering the destruction of harvests, the impoverishment of cultivable soil, and severe disruptions to food distribution channels.
The toll that wildfires exact on farming systems stretches well past the initial blaze. The stripping away of vegetative groundcover—which is indispensable for sustaining soil integrity and nutrient cycles—precipitates heightened erosion and a long-term decline in productive capacity [2, 3]. Smoke plumes further deteriorate atmospheric conditions, exerting direct injurious effects on plant development and animal well-being, thereby compounding the burdens shouldered by producers and agricultural enterprises [4].
In addition, wildfires upset indigenous habitats and species richness, both cornerstones of enduring agricultural practice. The eradication of organisms caused by burning can throw agroecosystems out of balance, undermining pollination services, biological pest suppression, and other irreplaceable natural processes on which crop cultivation depends [5].
Against this urgent backdrop, swift identification and continuous monitoring of wildfires are indispensable yet demanding endeavors that require resilient technological countermeasures [6]. Prompt fire recognition matters not only for preserving human life and curtailing structural losses but also for safeguarding agricultural assets and ensuring food availability.
Established fire detection practices have historically underpinned early alert frameworks. Yet these approaches harbor noteworthy shortcomings. Manual watchfulness is inherently bounded by the range of eyesight and susceptibility to oversight, rendering it unfit for uninterrupted, round-the-clock vigilance [7, 8]. Detector-based installations, despite facilitating automated monitoring, are prone to issuing false alerts triggered by innocuous phenomena such as airborne dust or fog and require close physical proximity to the blaze [9]. This constraint often results in belated warnings. Orbital imaging provides a broader observational reach but is hampered by coarse granularity, infrequent satellite revisit intervals, and interference from cloud cover, all of which introduce notification delays [10].
The foregoing constraints reveal a pressing need to integrate sophisticated technologies, particularly artificial intelligence (AI), into wildfire surveillance and management frameworks to overcome the inherent weaknesses of conventional methodologies and enhance the efficacy of detection systems [11].
Within the AI discipline, specifically the subfield of computer vision (CV), investigators have pursued numerous avenues to detect flames and smoke. Segmentation-oriented strategies prove especially advantageous in this context, enabling meticulous boundary mapping of fire and smoke within imagery and thereby enabling dependable tracking and damage quantification across impacted zones [12]. Representative architectures in this branch, notably Mask R-CNN and Faster R-CNN, have received recognition for their operational effectiveness [13].
Nevertheless, object detection has risen to prominence as the prevailing technique in this domain, owing to its proficiency in swiftly and accurately flagging fire and smoke events across heterogeneous backdrops. Among this class, celebrated backbone architectures like ResNet and VGG stand out as among the most familiar and extensively deployed [14]. Notwithstanding this, the You Only Look Once (YOLO) paradigm has materialized as a keystone technology for instantaneous object recognition.
YOLO has established itself as an indispensable instrument for real-time detection tasks [15]. Its distinctiveness derives from its single-pass inference strategy, which sets it in direct opposition to dual-stage (two-shot) recognition pipelines. Single-shot detection streamlines the entire procedure by generating object location hypotheses during a single holistic traversal of the source image [16]. Economies of computation achieved in this manner are particularly prized in time-critical contexts, such as wildfire spotting, which is a prime example.
By contrast, dual-stage detectors, exemplified by Mask R-CNN, engage in a more intricate sequence of operations. The initial stage produces a collection of candidate region proposals, after which a subsequent stage hones these tentative suggestions into definitive outputs [16]. Such an architecture imposes a heavier computational footprint due to the bifurcated processing phases it entails, diminishing its suitability for use cases where split-second responsiveness is imperative.
Historically, dual-stage techniques were perceived as possessing a superior accuracy profile owing to their elaborate proposal polishing routines [17]. Progress in CV, however, has substantially contracted this performance differential. Innovations have given rise to single-shot frameworks whose precision now rivals, and occasionally matches, that of their dual-stage analogues.
A foremost exemplar of this trajectory is evident in the YOLO iterations, each release documenting consistent fidelity improvements over its predecessor. These refinements have entrenched YOLO’s standing as an extraordinarily capable tool for deployments where both throughput and accuracy are paramount, making it an exemplary candidate for time-sensitive applications such as wildfire detection.
The evolutionary trajectory of YOLO has culminated in the emergence of YOLOv8, a notably contemporary and refined member of the architectural lineage. Furnished with five discrete, scaled variants, each calibrated for distinct trade-offs between throughput and predictive performance, YOLOv8 offers an unprecedented degree of configurability for object detection tasks.
Grounded in the considerations articulated above, the present inquiry probes the viability of YOLOv8 as a prospective implementation for instantaneous smoke and wildfire recognition. The focal point of our investigation lies in the indispensable agricultural application sphere, where expeditious hazard identification serves as a bulwark protecting crops and rural livelihoods from the catastrophic consequences of uncontrolled blazes.
The investigative procedure we adopt commences with the adaptation and tuning of YOLOv8’s quintet of pretrained scaled variants against a dataset purpose-built for smoke and fire recognition, leveraging evaluative benchmarks encompassing precision, recall, F1-score, and mAP to isolate the best-performing configuration, with special weight assigned to recall given its operational relevance in crisis-response situations. The highest-ranked variant subsequently undergoes systematic hyperparameter refinement, inaugurating with a One Factor at a Time experimental design to gauge the isolated influence of individual parameters, succeeded by a directed random search phase to precisely calibrate the configuration space, thereby honing the model’s real-time detection prowess.
The outcome of these efforts is a refined model that delivers measurable gains across all evaluation criteria. Corroborating visual inspections further validate these quantitative advances, illustrating the model’s heightened competence at dependably and faithfully identifying smoke and fire manifestations across a spectrum of challenging environmental settings.
Through this scholarship, we aspire to contribute to the vital and rapidly maturing discipline of wildfire detection. By marshaling frontier technological capabilities to address a matter of planetary urgency, this work underscores the indispensable role of sustained ingenuity and scholarly inquiry amid intensifying ecological pressures.
The Fire and Smoke dataset [18], which serves as the core of this investigation, is publicly accessible via the Roboflow repository. Assembled from a varied corpus of 9796 images, this collection delivers a wide-ranging survey of smoke and wildfire occurrences captured under assorted settings and viewpoints, as illustrated in Figure 1. The compilation is divided into three segments to support model training and performance assessment: 6856 images designated for training, 1963 reserved for validation, and 977 allocated for testing.
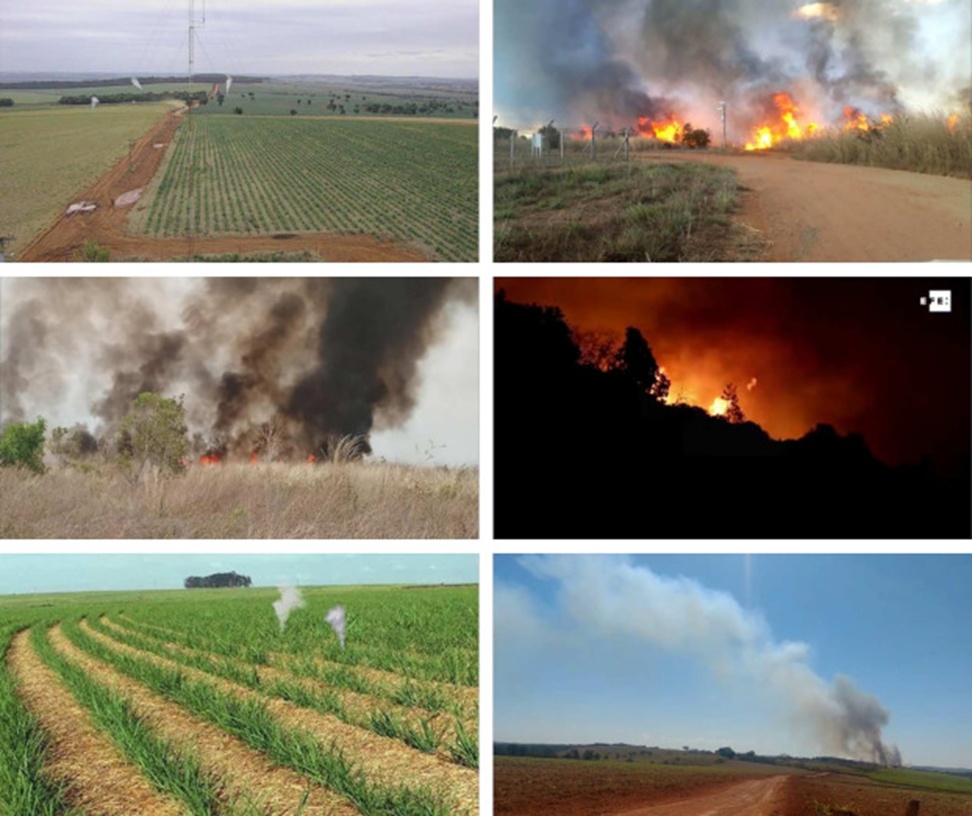
Figure 1. Sample images from the fire and smoke dataset.
The fire and smoke dataset [18], central to this research, is publicly available on the Roboflow platform. Comprised of a diverse collection of 9796 images, this dataset offers an extensive exploration of smoke and wildfire phenomena in various conditions and perspectives, as shown in Figure 1. The dataset is partitioned into three subsets to facilitate the training and evaluation of the models: 6856 images for training, 1963 for validation, and 977 for testing.
What makes the Fire and Smoke dataset stand out is its breadth in reproducing the tangled realities of actual field conditions. The pictorial collection spans a spectrum of illumination settings, delivering perspective into the visual signatures of smoke and flame under shifting light regimes. Such diversity puts pressure on the models’ capacity to isolate diagnostically relevant patterns, an aptitude that proves foundational for timely identification and rapid countermeasures.
Beyond lighting, the repository features captures from various vantage points and ranges, spanning tight, magnified frames to sweeping long-range overviews. This multiplicity helps train the models to identify wildfire and smoke events across diverse dimensions and sightlines, thereby extending their usefulness across a wide range of operational contexts. The integration of partially obscured scenes introduces yet another order of intricacy, replicating the obstructions encountered in actual surveillance settings, where intervening elements may impede the line of sight.
The inherent variability of the Fire And Smoke corpus—spanning illumination contrasts, environmental backdrops, viewing angles, and obstructions—furnishes a demanding yet faithful representation of on-the-ground complexity. A dataset of such sweeping and eclectic composition is invaluable for calibrating the quintet of YOLOv8 configurations devoted to the nuanced undertaking of smoke and wildfire recognition. It empowers the inquiry to go beyond performance measurement in artificial or laboratory-like settings, enabling an appraisal of how effectively the models might cope with the mercurial and unforeseeable circumstances that define authentic wildfire emergencies.
Of particular significance, the decision to adopt the Fire and Smoke dataset was guided by its coverage of images depicting wildfire and smoke episodes occurring not only in cultivated areas but also across a wide range of other environments, including wooded expanses, elevated highland zones, and built structures such as residences and motor vehicles. This encompassing spectrum is directly relevant to agrarian safeguarding, since wildfires habitually ignite within or spread from these heterogeneous points of origin. A conflagration arising in a bordering forest tract, a settled area, or from an automobile incident can swiftly intensify and spill over onto productive farmland, rendering prompt detection across such manifold contexts equally imperative.
By training detection architectures on this heterogeneous visual dataset, the study acknowledges the tightly coupled character of farming zones and their surrounding landscapes, foregrounding the need for a sentinel system that maintains vigilance over a broad range of plausible ignition sources and propagation corridors. This orientation guarantees that the YOLOv8 variants are not narrowly conditioned to detect blazes exclusively amid standing crops or stereotypical agrarian scenery. Rather, by encompassing a wide range of fire and smoke vignettes, the architectures' capacities are amplified, yielding a more resilient and comprehensive monitoring apparatus.
This expanded regime of preparation equips the models to flag potential fire hazards across diverse environments, a capacity essential for comprehensive agricultural protection. Such all-terrain competence is indispensable in a reality where the boundaries separating farmland from adjacent land uses are frequently blurred, and where fires in non-farming areas can rapidly harm agricultural operations.
YOLOv8, the freshest advancement within the “You Only Look Once” dynasty, was unveiled on January 10th, 2023, under the auspices of Ultralytics. This updated release signals a consequential advance in the computer vision landscape, particularly across subdomains such as object detection, image classification, and instance segmentation, as shown in Figure 2.
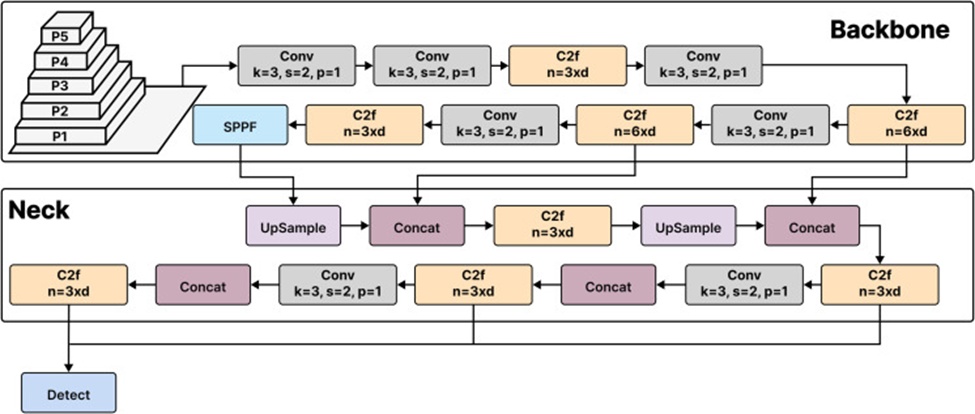
Figure 2. YOLOv8 architecture (Taken from: 8).
Erected atop the foundations laid by YOLOv5, YOLOv8 ushers in a series of decisive upgrades that mark it as a powerful leap in instantaneous object recognition. Its structural composition features refinements that enhance both throughput and versatility, elevating YOLOv8 as a leading candidate for forward-looking computer vision research [7].
A salient breakthrough embodied in YOLOv8 is its shift from a framework reliant on anchor boxes to an anchor-free detection methodology. This reorientation enables more direct inference of object midpoints, simplifying the Non-Maximum Suppression (NMS) pipeline and overcoming previously encountered obstacles related to generalization and anomalous treatment [7, 19].
The architectural progression continues, with overhauls to the convolutional blueprint. In a notable departure, YOLOv8 supplants the legacy 6 × 6 convolution with a leaner 3 × 3 operation, while introducing the C2f module in place of the earlier C3 [7, 8]. These revisions yield a trimmer, more adaptable model schematic, contributing substance to a design that is at once more performant and more resilient.
The embedding of the Spatial Pyramid Pooling Feature (SPPF) enhances the model’s capacity for object discrimination across diverse scales [8, 20]. Moreover, the immediate concatenation of feature representations within the model’s neck segment, combined with the newly adopted mosaic augmentation regime during training, enhances the architecture's flexibility and operational efficiency [7].
Loss is a pivotal element in YOLOv8's optimization machinery, serving as the yardstick for measuring the discrepancy between the network’s predicted outputs and the ground truth or target values. YOLOv8 draws upon a fused formulation comprising box loss, classification (cls) loss, and distributional focal loss (dfl). The weight carried by each of these loss constituents, along with their functional contribution to overall model efficacy, is unpacked in the following:
• Box loss: This component evaluates the misalignment between the set of predicted bounding box coordinates and the corresponding ground truth annotations [7, 21], deploying quantitative criteria such as mean squared error (MSE) or smooth L1 loss.
• Classification (cls) loss: This term appraises the deviation separating the estimated class probability distributions from the actual category labels [7, 22], operationalized through categorical cross-entropy loss.
• Distributional focal loss (dfl): A broadening of the standard focal loss formulation, this component confronts the problem of disproportionate class representation inherent to object detection tasks [7, 23], accomplished by attaching elevated weighting to samples that prove more resistant to correct classification.
YOLOv8 is available in a range of model sizes, including nano (YOLOv8n), small (YOLOv8s), medium (YOLOv8m), large (YOLOv8l), and extra-large (YOLOv8x). Throughout this investigation, we examine the complete set of five variants, with their respective specifications listed in Table 1.
Table 1. Details of YOLOv8 variants analyzed.
Model | FLOPs (B) | Params (M) | Size (pixels) |
YOLOv8n | 8.7 | 3.2 | 640 |
YOLOv8s | 28.6 | 11.2 | 640 |
YOLOv8m | 78.9 | 25.9 | 640 |
YOLOv8l | 165.2 | 43.7 | 640 |
YOLOv8x | 257.8 | 68.2 | 640 |
In the domain of object detection work, precision constitutes a fundamental yardstick applied to measure the soundness of a model’s affirmative classifications. It captures the proportion of genuine identifications relative to the total number of cases labeled as positive [24].
In object detection, precision measures how accurately a model pinpoints and categorizes objects. It acts as a barometer of the model’s dependability in flagging positive examples, thereby suppressing spurious positive outputs [24]. A loftier precision reading translates into a sparser incidence of false-positive assertions.
In formal terms, precision is rendered through the expression displayed in Eq. 1, where ‘TP' indicates the tally of true positive predictions, and False Positives 'FP' denotes occurrences erroneously assigned a positive label.
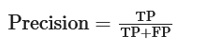 (1)
(1)
Recall, alternately labeled sensitivity or the true positive rate, occupies a position of substantial consequence within object detection. It serves as an evaluative mechanism that probes a model's ability to correctly identify and account for authentic positive object instances [7, 8].
As formalized in Eq. 2, recall is defined mathematically, with 'TP' denoting true positive predictions and 'FN' denoting false negative predictions.
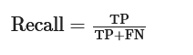 (2)
(2)
The recall score attests to the model's success in preventing missed identifications. A loftier recall figure signals that the model exhibits a reduced tendency to miss genuine positives, a property that often assumes critical importance in settings where failing to register true positives may carry momentous consequences.
The F1-score, often described as a harmonized measure, combines precision and recall into a single, distilled representation of a model's object detection performance. It emerges as an amalgamated figure expressive of the model's overall finesse in stabilizing both of these facets [7, 8].
This singular index is extracted through the formula shown in Eq. 3:
 (3)
(3)
Wherein Precision stands for the quotient of true positives relative to the pooled count of true positives and false positives, while Recall stands for the quotient of true positives relative to the summed tally of true positives and false negatives.
In contexts marked by lopsided class distributions or where the costs of false positives and false negatives diverge markedly, a higher F1-score betokens a model that reliably detects objects while maintaining a carefully calibrated equipoise between precision and recall [24, 25].
The Mean Average Precision (mAP), a widely used benchmark for evaluating object detection pipelines, combines precision and recall by averaging the precision (AP) across all classes [8]. It represents a revealing metric that untangles the reciprocal concessions between these two dimensions by quantifying the area under the precision-recall curve [24, 26].
The formalized statement of AP, as put forth in Eq. 4, depicts the integral of precision sampled over successive recall gradations, notated as precision(r), where r marks a specified recall level:
 (4)
(4)
An amplified mAP reading reflects a more proficient object detection capability, balancing precision and recall.
Additionally, mAP features adaptations tailored to varying Intersection over Union (IoU) decision boundaries. To illustrate, [email protected] zeroes in on an IoU cutoff of 0.5, whereas [email protected]:0.95 encapsulates the mean average precision computed over a sweep of IoU thresholds spanning from 0.5 to 0.95 [27].
The base code for YOLOv8 used in our implementations was obtained from the official repository1, ensuring that our work was not only reliable but also in compliance with prevailing best practices in computer vision and object detection. Our model training was run on a high-performance computing (HPC) cluster, leveraging four Nvidia A100 SXM4 40GB GPUs. In addition to the GPUs, the system was equipped with 32 CPU cores and 64GB of system memory, providing a robust environment for computational processing.
Within our evaluation framework and the procedure for selecting candidate models, we assigned a premeditated centrality to recall, elevating it as the decisive yardstick for architectural selection. This emphasis is particularly relevant to the wildfire and smoke detection domain, a stance buttressed by the contemporary body of published research [8]. The calculated spotlight on this particular metric originates from the sector's idiosyncratic stakes, born of an awareness that the consequences flowing from false negatives—situations where an actual conflagration or smoke plume escapes notice—can prove devastating; in agrarian landscapes especially, such failures may translate into sweeping crop annihilation, destruction of assets, and the conceivable forfeiture of human lives. Accordingly, in line with the deployment-driven priorities identified by reviewers, our decision to subordinate other performance indicators to recall reflects a purposeful reckoning with the exceptional hazards posed in this operational theater.
Under the stock configuration supplied with YOLOv8, the criterion for model selection is a compound fitness value computed as a weighted sum of four measures: Precision, Recall, [email protected], and [email protected]:0.95. In standard practice, Precision and Recall tend to command comparatively modest influence within this fitness formulation, with the spotlight trained more intently on the mAP components. Yet, given the life-or-death urgency of rapid, reliable wildfire identification, our inquiry reengineers the coefficient allocation to more faithfully reflect the bespoke requirements of this use case.
We remodeled the evaluation rubric to embed the outsized criticality of Recall, assigning it a multiplier that reflects its primacy in mitigating the risk of undetected events. This restructuring aligns our assessment protocol more closely with the operational mandate to surface every feasible wildfire or smoke occurrence. Through a redistribution of the fitness coefficients, such that Precision and each of the two mAP indicators receive a 20% share. At the same time, Recall is accorded an elevated weighting of 40%; we place unmistakable emphasis on the imperative for a detection architecture whose foremost commitment is to flag every plausible danger, thereby hardening the reliability of our monitoring apparatus during exigent episodes.
The inaugural segment of this investigative program involves fine-tuning pretrained YOLOv8 backbones on our curated dataset dedicated to wildfire and smoke recognition. Exploiting previously conditioned models compresses the path to convergence and streamlines accommodation to an unfamiliar sample distribution, thereby fostering procedural parsimony. The fine-tuning pipeline launches with the restoration of YOLOv8's pretrained synaptic weights, installing a resilient baseline for the stages to follow by capitalizing on antecedent knowledge distilled from expansive visual repositories, thus amplifying the flexibility and throughput of the resulting architectures.
Once initialization concludes, the training regimen shifts to conditioning the networks on the novel wildfire and smoke imagery. Throughout this interval, the full complement of hyperparameters is held at their factory-prescribed values: learning rate at 0.01, batch size at 16, epoch horizon at 100, weight decay at 0.0005, and the optimization algorithm set to SGD. This restrained protocol preserves the architectural soundness of the pretrained configurations while nonetheless granting latitude for reshaping by the subtleties and singularities of the target domain. Through this attunement to incoming data, the detection apparatus develops a more acute receptivity to the distinctive motifs, textural signatures, and morphological hallmarks associated with wildfire and smoke surveillance.
At the close of the training cycle, the model selection process begins. This waypoint in our study is dedicated to a painstaking dissection of the performance indicators, with recall as the overriding priority, to isolate the fittest variant. Cognizant of the non-negotiable requirement for exhaustive detection coverage across the wildfire and smoke landscape, the emphasis on recall amounts to a deliberate stratagem to substantiate the architecture's ability to detect every conceivable incident. This anchoring on recall answers to the indispensable stipulation that the system unfalteringly capture all occurrences of concern, thereby attenuating the jeopardy of missed identifications within operational milieux where a shortfall in precision can beget momentous consequences.
The subsequent tract of this investigation comprises an exacting hyperparameter refinement protocol, the purpose of which is to home in on the parameter constellation best suited to the designated application sphere. This optimization enterprise is conducted in two successive movements: a One Factor At a Time probing phase, followed by a Random search exploration.
The hyperparameter roster under investigation comprises batch size, learning rate, the choice of optimization algorithm, weight decay, and the number of training epochs. These variables were judiciously chosen on the grounds of their pertinence and their demonstrated capacity to exert influence. Quantities such as learning rate, optimizer identity, and epoch count are conventionally recognized as belonging to the core pantheon of hyperparameters throughout the machine learning literature; the weight of documentation attesting to their bearing on model induction and terminal performance renders them ineluctable participants in any tuning exercise worthy of the name. In a complementary vein, weight decay and batch size received explicit commendation from the originators of YOLOv8, who highlighted their latent potential to sculpt model behavior. On that basis, these two were likewise folded into the refinement sweep.
Learning rate: The learning rate (lr0) determines the step size for updating the model's weights during training. Increasing the learning rate can shorten the path to convergence. Yet, it also introduces the risk that the algorithm may bypass the most advantageous weight configuration, with detrimental consequences for downstream capability [28]. In contrast, adopting a subdued learning rate tends to yield a steadier convergence trajectory, though it may considerably extend the time required to settle upon the best attainable solution.
Optimizer: An optimizer is the computational routine that adjusts the model's learnable parameters during training to minimize the loss function [29]. Each candidate optimizer brings to bear a distinctive methodology for reconciling the competing demands of swift convergence against the robustness and correctness of the final parameter state. The set of optimizers subjected to examination in this study is enumerated as follows:
• Stochastic gradient descent (SGD): This widely used optimization procedure updates model parameters in small increments, advancing along the path defined by the negative gradient of the loss function, with the step size modulated by the learning rate [30]. Although it is prized for its conceptual clarity and computational frugality, it is not immune to becoming mired in local optima.
• Adaptive moment estimation (Adam): This optimizer ranks among the more refined alternatives to SGD. It reconfigures model weights by combining per-parameter adaptive learning rates with momentum. Specifically, Adam calibrates the update magnitude for each weight individually by integrating information about the current gradient scale and the accumulated history of previous gradients, thereby delivering a more potent and resource-conscious optimization sequence [31].
• Adamax: Originating as a branch of the Adam family, Adamax replaces the squared gradient term with the absolute gradient value. By adopting the L-infinity norm rather than the L2 norm, this variant can be especially amenable to models with gradients that shift only sporadically or are sparse [32].
• AdamW: This formulation extends the Adam lineage by explicitly introducing a weight-decay term into the loss computation, a modification designed to suppress overfitting and improve generalization to out-of-sample data [32].
• Nesterov-accelerated Adam (NAdam): NAdam merges the Adam framework with Nesterov-style momentum [33], a refinement that accelerates convergence and produces a more even-tempered trajectory.
• Rectified Adam (RAdam): This variant diverges from the base Adam by introducing a new adaptive learning rate scheduling method that relies on gradient variance [34]. The outcome is a more uniform training experience, sharpening both precision and operational stability.
• Root mean square propagation (RMSProp): Conceived as a momentum-driven optimizer, RMSProp uses a rolling average of squared gradients to independently adjust the learning rate for each weight [35]. This strategy helps carve out an appropriate and expedient descent corridor toward the minimum loss.
Batch size: The batch size captures the quantity of training samples processed in a single forward-backward pass before the model's weights are updated [36]. A bulkier batch yields a more dependable estimate of the true gradient direction. Still, it exacts a heavier computational toll, while a leaner batch facilitates quicker iteration cycles at the price of introducing greater stochastic fluctuation into the convergence pathway.
Weight decay: A regularization mechanism that adds a penalty term to the loss function, calibrated by the magnitude of the model's weight parameters [37]. The weight decay coefficient controls the strength of this penalty. By discouraging excessively large weight values, this technique helps the model resist overfitting and improves its predictive performance on previously unseen data [37].
Epochs: The number of epochs specifies how many full passes through the entire training corpus are performed during training. Extending training across more epochs may boost model performance but simultaneously increase exposure to overfitting. On the other hand, training with a reduced epoch budget can offer gains in time efficiency at the possible expense of insufficient learning, leaving the model underfitted [38].
Table 2 presents the specific hyperparameters and the corresponding values investigated during the tuning stage.
Table 2. Summary of hyperparameters and the values utilized during the fine-tuning stage.
Hyperparameter | Values |
Learning rate | 0.001, 0.01, 0.1 |
Optimizer | SGD, Adam, AdamW, Adamax, NAdam, RAdam, RMSProp |
Batch size | 16, 32, 64, 128, 256 |
Weight decay | 0.00005, 0.0005, 0.005, 0.05 |
Epochs | 100, 200, 300 |
The One Factor At a Time (OFAT) methodology represents a disciplined strategy applied within the hyperparameter optimization cycle. In this framework, a single hyperparameter is perturbed across its candidate range, while all other settings remain fixed. This operation is successively performed for each hyperparameter featured in the model, thereby enabling a clear-eyed assessment of how each factor, taken on its own, influences model performance.
The principal attributes that define the OFAT methodology are unpacked in what follows:
1. Isolation: By focusing on a single hyperparameter per experimental round, OFAT decouples the impact of each factor [39]. This disentanglement provides insight into how each hyperparameter shapes model behavior within the context of the particular task.
2. Simplicity: OFAT provides a clean, readily navigable approach for probing the hyperparameter space, facilitating easy comprehension and diagnostic review [40].
3. Efficiency: Standing in contrast to exhaustive grid search, OFAT avoids canvassing every possible hyperparameter setting, thereby yielding meaningful savings in computational overhead.
4. Systematic exploration: The protocol ensures that no hyperparameter escapes dedicated examination, yielding a finely resolved portrait of each hyperparameter's functional significance within the model's performance ecosystem [41].
Once the OFAT stage concludes, the study advances into the Random Search (RS) stage. The preceding OFAT phase conducted a focused dissection to pinpoint hyperparameters whose variations yielded the most substantial performance improvements. These identified hyperparameters are subsequently promoted to the RS stage.
RS operates by randomly sampling hyperparameter combinations from predetermined intervals, thereby enabling a more fluid and often more resource-efficient scan of the attainable configuration space [42]. In contrast to exhaustive schemes such as grid search, which methodically explore the entire combinatorial space, RS relies on probabilistic sampling of hyperparameter tuples [23].
This strategy not only provides a pathway that remains tractable as the dimensionality of the search space grows but also creates space for chance discoveries of unconventional parameter constellations that may elevate model performance beyond expectations [23].
The design ensures that computational resources are allocated intelligently, focusing on the hyperparameters previously identified as influential during the OFAT stage. By fusing the granular understanding derived from systematic OFAT analysis with the stochastic probing characteristic of RS, the procedure achieves a carefully balanced compromise between disciplined measurement and open-ended experimentation.
Considered holistically, this two-part hyperparameter optimization sequence—the marriage of OFAT with RS—constitutes a resilient and cost-effective conduit toward an optimized model specification for smoke and wildfire identification. The productive tension between rigorous single-parameter assessment and the agile exploration of joint-parameter effects furnishes a textured approach well matched to the layered challenges posed by object-detection applications.
A visual digest of this integrated methodological pipeline is supplied in Figure 3.
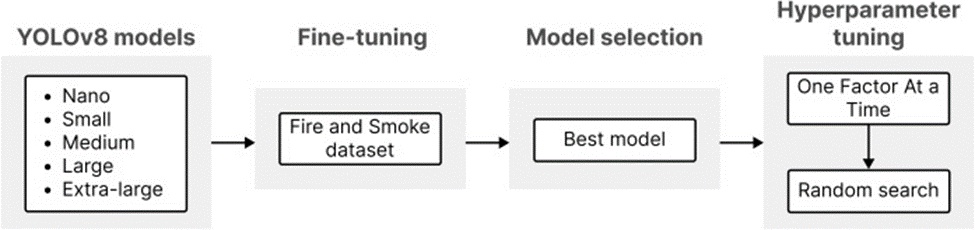
Figure 3. Workflow followed in this research.
Table 3 collates the findings from the suite of YOLOv8 variants fine-tuned for the purpose-assembled smoke and wildfire imagery corpus. This exercise was conducted to chart how each model scale—from the compact nano to the capacious xlarge—navigates the trade-offs between detection fidelity and resource expenditure. With the full set of training hyperparameters set to their factory defaults, a comparative audit was performed to identify the best-performing variant from this experimental segment.
Table 3. Results of each version of YOLOv8 when fine-tuned with the dataset for smoke and wildfire detection. For this stage, all the training parameters were kept at their default values: lr0 = 0.01, optimizer = SGD, batch = 16, weight decay = 0.0005, and epochs = 100.
Model | Class | [email protected]:0.95 | F1-score | Recall | Precision | Speed (ms) | Training time (hours) | |
YOLOv8n | All | 0.450 | 0.788 | 0.759 | 0.733 | 0.787 | 1.8 | 2.517 |
Smoke | 0.542 | 0.854 | 0.823 | 0.801 | 0.847 |
| ||
Fire | 0.358 | 0.722 | 0.695 | 0.664 | 0.728 |
| ||
YOLOv8s | All | 0.514 | 0.834 | 0.808 | 0.781 | 0.837 | 1.8 | 2.510 |
Smoke | 0.596 | 0.881 | 0.858 | 0.832 | 0.886 |
| ||
Fire | 0.431 | 0.786 | 0.758 | 0.730 | 0.789 |
| ||
YOLOv8m | All | 0.564 | 0.857 | 0.826 | 0.790 | 0.865 | 2.7 | 3.011 |
Smoke | 0.675 | 0.898 | 0.869 | 0.834 | 0.907 |
| ||
Fire | 0.483 | 0.816 | 0.782 | 0.745 | 0.824 |
| ||
YOLOv8l | All | 0.589 | 0.862 | 0.836 | 0.809 | 0.864 | 3.6 | 3.231 |
Smoke | 0.661 | 0.897 | 0.872 | 0.844 | 0.902 |
| ||
Fire | 0.517 | 0.827 | 0.799 | 0.774 | 0.826 |
| ||
YOLOv8x | All | 0.605 | 0.864 | 0.835 | 0.812 | 0.860 | 5 | 3.682 |
Smoke | 0.673 | 0.895 | 0.870 | 0.845 | 0.896 |
| ||
Fire | 0.537 | 0.833 | 0.794 | 0.766 | 0.823 |
|
Beginning with the nano-configuration, it delivers the least competitive scores throughout the evaluated range, attaining a recall of 0.733 on the aggregated classes and a mark of 0.664 when restricted to the ‘Fire’ category alone. While its training duration of 2.517 h constitutes a clear advantage, the accompanying precision and F1-score readings indicate that this variant is unlikely to satisfy the demands of high-stakes deployment environments where sensitivity is paramount. That said, the ‘Smoke’ category yields a recall of 0.801—a comparatively bright spot that could render the nano variant acceptable in contexts where consequences of missed detections are less severe.
Stepping up to the small-scale variant, a visible enhancement registers across virtually the entire metric panel relative to the nano baseline. Its holistic precision climbs to 0.837, while the recall value for the ‘Smoke’ category inches upward to 0.832; the ‘Fire’ category, however, remains somewhat subdued at 0.730. Training time remains nearly steady at 2.510 h, providing an equilibrium point for scenarios operating under tighter computational constraints.
The upward trend in the metric persists in the medium-scale variant, which reconciles detection quality and processing burden. Its recall reading, with particular note taken of the ‘Fire’ category at 0.745, marks a worthwhile advancement, while the precision figure of 0.907 posted on the ‘Smoke’ category underscores its discerning capacity. Furthermore, it secures the leading results on both [email protected] and [email protected]:0.95 within the ‘Smoke’ class. This variant gestures toward a more evenly poised proposition, albeit at a training cost of 3.011 h.
When surveying the leading group, the large-scale variant builds on the medium design's foundations and delivers significant advancement. Yielding an all-class recall of 0.809, an overall precision measure of 0.864, and requiring 3.231 h of training, it attains substantial metric harmonization. Both the ‘Smoke’ and ‘Fire’ classes return encouraging recall rates—0.844 and 0.774, respectively.
The xlarge-scale variant stretches the attainable ceiling still further, driving certain indicators to their apex while incurring a heavier training burden (3.682 h). Although it records a recall of 0.845 for the ‘Smoke’ class and exhibits the strongest performance with respect to [email protected] and [email protected]:0.95 for the ‘Fire’ class, the incremental advantage over large remains slender.
An inspection of the learning trajectories traced by the distinct YOLOv8 versions reveals a recurrent signature in the loss dynamics, as shown in Figure 4. The less parameterized variants exhibit tighter correspondence between their training and validation loss curves, suggesting lower susceptibility to overfitting. Conversely, as architectural complexity progressively enriches the medium, large, and xlarge variants, a mild yet consistent drift toward overfitting becomes discernible across all three loss branches.
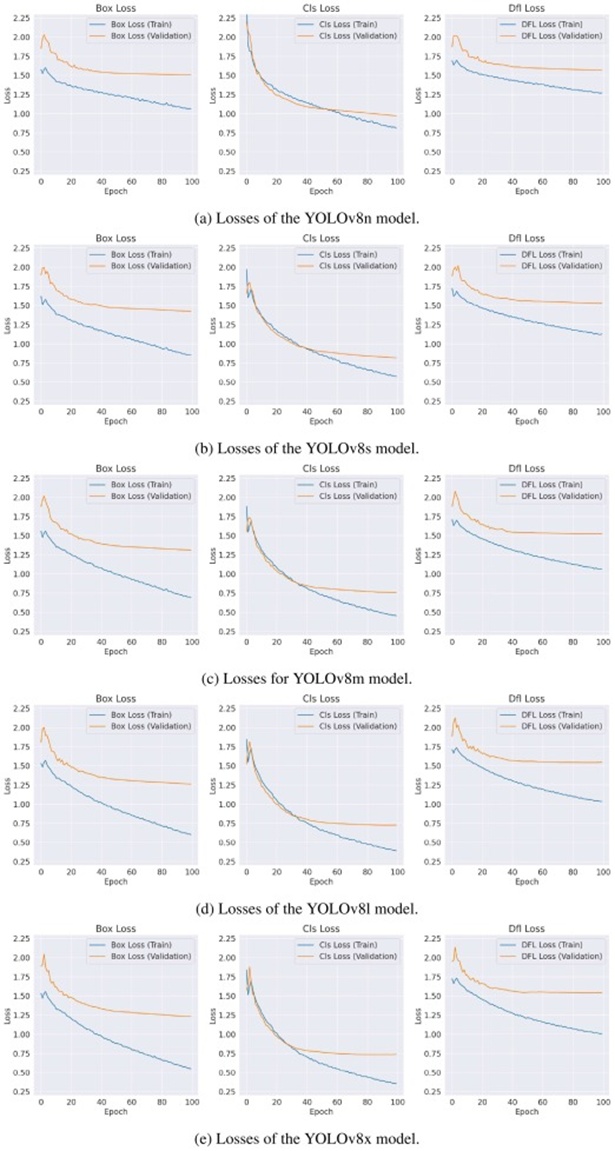
Figure 4. Losses of YOLOv8 variants when fine-tuning.
The observed dynamics highlight the familiar tension between representational power and robust generalization. While the effect remains moderate and plausibly amenable to mitigation through targeted regularization and hyperparameter adjustment, the pattern nonetheless constitutes an important signal for consideration during model appraisal.
Beyond the portrait painted by performance metrics alone, the inference latency of each variant looms as a pivotal consideration—especially for use cases predicated on near-instantaneous detection and downstream reaction. The nano and small configurations achieve the most favorable processing intervals at 1.8 ms, making them natural candidates for contexts that prize rapid response above all else. This swiftness, however, comes at the cost of recall and precision, most notably in fire-specific detection tasks. The medium variant nudges processing time upward to 2.7 ms while reciprocating with a tangible elevation in detection quality.
Transitioning to the large-scale variant, latency extends to 3.6 ms. Though comparatively more deliberate, the large variant's facility for balancing classification correctness, computational appetite, and training expediency becomes unmistakable at this point, as it materially surpasses the smaller configurations without incurring a sharply disproportionate latency cost. At the upper bound, the xlarge-scale construction—notwithstanding its tiny edge in detection accuracy—exacts a substantially heavier toll at 5 ms per inference operation.
Surveying the totality of evidence, the large and xlarge instantiations surface as the preeminent candidates, with the xlarge variant securing marginal advantages on selected indices. When metrics are examined through a class-aware lens, both models demonstrate robust detection performance for both smoke and fire. The modest recall lead claimed by Xlarge, while meriting acknowledgment, does not cumulate into convincing overall dominance. The concomitant increase in computational demand and training duration must offset the fractional gains recorded in the performance ledger.
The large variant's poised profile—its performance readings trailing closely behind those of xlarge while imposing a gentler strain on resources—positions it as the more operationally sensible pick. In a domain where recall enjoys a tempered primacy but does not function as the exclusive determinant, the selection of the large configuration crystallizes a deliberate equilibrium among detection potency, false-positive discipline, throughput, and infrastructural constraints.
Consequently, for the targeted assignment of wildfire and smoke recognition, the large architecture is chosen as the optimum outcome arising from the fine-tuning sequence. It captures a measured balance between detection fidelity, computational expenditure, and training practicality. This verdict establishes it as the most compelling product of the current phase and has thus been adopted as the substrate for the succeeding hyperparameter optimization phase.
Having completed the fine-tuning segment, attention now turns to the pivotal stage of hyperparameter adjustment. With the chosen large architecture demonstrating a satisfactory balance of capabilities, the subsequent portion of the study calibrates hyperparameters to sharpen the model's overall accuracy and resource efficiency.
The opening pass of the hyperparameter calibration employs the OFAT approach, in which every parameter is scrutinized independently and in depth. Detailed below are the results from evaluating each hyperparameter in isolation during the OFAT stage.
Table 4 documents how altering the learning rate, with all remaining hyperparameters clamped at fixed values, shapes performance on the validation set.
Table 4. Results of each learning rate analyzed on validation. Fixed parameters: optimizer = SGD, batch = 16, weight decay = 0.0005, and epochs = 100.
Learning rate | Class | [email protected]:0.95 | F1-score | Recall | Precision | Speed (ms) | Training time (hours) | |
0.01 | All | 0.589 | 0.862 | 0.836 | 0.809 | 0.864 | 3.6 | 3.231 |
Smoke | 0.661 | 0.897 | 0.872 | 0.844 | 0.902 |
| ||
Fire | 0.517 | 0.827 | 0.799 | 0.774 | 0.826 |
| ||
0.001 | All | 0.591 | 0.860 | 0.836 | 0.800 | 0.875 | 3.6 | 3.547 |
Smoke | 0.664 | 0.896 | 0.867 | 0.825 | 0.913 |
| ||
Fire | 0.528 | 0.823 | 0.802 | 0.770 | 0.836 |
| ||
0.0001 | All | 0.472 | 0.806 | 0.775 | 0.743 | 0.810 | 3.5 | 3.592 |
Smoke | 0.558 | 0.863 | 0.837 | 0.815 | 0.860 |
| ||
Fire | 0.386 | 0.748 | 0.713 | 0.672 | 0.760 |
|
When configured with a learning rate of 0.01, the model produces a sturdy, well-distributed metric profile. The trio of precision, recall, and F1-score lands in balanced territory at 0.864, 0.809, and 0.836 for the ‘All’ class amalgamation. Narrowing to the ‘Smoke’ category specifically, these same figures advance to 0.902, 0.844, and 0.872 in corresponding order, reflecting a marked competence in detecting smoke occurrences and affixing the correct label. The ‘Fire’ class, though its readings trail slightly, still yields solid results, with a precision of 0.826, a recall of 0.774, and an F1-score of 0.799. The [email protected] and [email protected]:0.95 registered under this learning rate also sit at comparatively elevated levels, signifying the model’s proficiency at spotting objects crossing a variety of overlap regimes.
Stepping the learning rate down to 0.001 brings a scattering of marginal gains in selected dimensions, yet extracts a toll in the form of a lengthened training interval (3.547 h). Even as precision across the ‘All,’ ‘Smoke,’ and ‘Fire’ groupings edges upward to 0.875, 0.913, and 0.836, respectively, recall figures contracted for all categories. The [email protected]:0.95 measure showed a fractional bump, whereas [email protected] remained at a lower level. Inference latency held steady at 3.6 ms—unchanged from the preceding learning rate—indicating that computational throughput did not shift.
A further retraction of the learning rate to 0.0001 triggers a clear collapse in performance across almost the entire metric landscape. Precision, recall, and the F1-score slip across every class division, with the ‘Fire’ category bearing a disproportionately heavy impact, as its precision and recall descend to 0.760 and 0.672. Both [email protected] and [email protected]:0.95 also undergo a considerable decline, most acutely within the ‘All’ class composite, pointing to a reduced capacity for identifying objects under varying degrees of spatial overlap. Somewhat paradoxically, inference speed ticks upward marginally to 3.5 ms; however, this trifling improvement falls far short of compensating for the widespread erosion seen elsewhere.
This sweep across distinct learning rate magnitudes reveals an intricate interdependence among detection quality, training expenditure, and computational parsimony. The value of 0.01 successfully negotiates a measured reconciliation of these contending factors, generating stable returns across the full battery of examined metrics. The isolated bright spots accompanying a learning rate of 0.001 fail to outweigh the added temporal investment, whereas the steep performance degradation observed at 0.0001 overrides any conceivable benefit from marginal gains in processing tempo.
Accordingly, the learning rate of 0.01 is selected as the most judicious configuration, establishing a platform that simultaneously upholds effectiveness and operational practicability at this phase of the hyperparameter examination.
Table 5 presents the detailed outcomes of a wide-ranging inquiry into the behavior of an assortment of optimizers when applied to the problem of wildfire and smoke identification. The insights contained therein prove essential for evaluating how distinct optimization strategies perform once enlisted to address a pressing real-world task.
Table 5. Results of each optimizer analyzed on the validation set. Fixed parameters: lr0 = 0.01, batch = 16, weight decay = 0.0005, and epochs = 100.
Optimizer | Class | [email protected]:0.95 | F1-score | Recall | Precision | Speed (ms) | Training time (hours) | |
SGD | All | 0.589 | 0.862 | 0.836 | 0.809 | 0.864 | 3.6 | 3.231 |
Smoke | 0.661 | 0.897 | 0.872 | 0.844 | 0.902 |
| ||
Fire | 0.517 | 0.827 | 0.799 | 0.774 | 0.826 |
| ||
Adam | All | 0.269 | 0.597 | 0.599 | 0.568 | 0.633 | 3.6 | 3.783 |
Smoke | 0.333 | 0.668 | 0.657 | 0.607 | 0.715 |
| ||
Fire | 0.205 | 0.527 | 0.540 | 0.529 | 0.551 |
| ||
Adamax | All | 0.353 | 0.707 | 0.684 | 0.643 | 0.731 | 3.7 | 3.620 |
Smoke | 0.437 | 0.781 | 0.755 | 0.698 | 0.823 |
| ||
Fire | 0.269 | 0.633 | 0.612 | 0.588 | 0.639 |
| ||
AdamW | All | 0.247 | 0.559 | 0.579 | 0.559 | 0.601 | 3.7 | 3.479 |
Smoke | 0.312 | 0.635 | 0.641 | 0.614 | 0.671 |
| ||
Fire | 0.182 | 0.482 | 0.518 | 0.505 | 0.532 |
| ||
NAdam | All | 0.294 | 0.631 | 0.626 | 0.605 | 0.648 | 3.7 | 3.609 |
Smoke | 0.364 | 0.704 | 0.687 | 0.660 | 0.716 |
| ||
Fire | 0.224 | 0.559 | 0.565 | 0.550 | 0.581 |
| ||
RAdam | All | 0.292 | 0.624 | 0.620 | 0.579 | 0.666 | 3.6 | 3.866 |
Smoke | 0.368 | 0.702 | 0.688 | 0.616 | 0.779 |
| ||
Fire | 0.215 | 0.545 | 0.548 | 0.542 | 0.554 |
| ||
RMSProp | All | 0.241 | 0.558 | 0.570 | 0.529 | 0.616 | 3.7 | 3.645 |
Smoke | 0.299 | 0.625 | 0.627 | 0.552 | 0.725 |
| ||
Fire | 0.183 | 0.491 | 0.507 | 0.507 | 0.507 |
|
SGD demonstrates a forceful, evenly distributed metric footprint. Aggregate precision registers at 0.864 and recall at 0.809, fusing into an F1-score of 0.836—a figure that bespeaks a carefully struck harmony. With [email protected] at 0.862 and [email protected]:0.95 at 0.589, its ability to surface genuine positive cases warrants recognition. Drilling into class-specific details reveals a distinct strength in ‘Smoke’ detection, with recall of 0.844 and precision of 0.902. The ‘Fire’ category likewise posts credible results, with recall attaining 0.774. A training duration of 3.231 h, combined with a latency of 3.6 ms, attests to a productive marriage of capability and economy.
The Adam optimizer lays bare pervasive inadequacies, with overall precision and recall slumping to 0.633 and 0.568, respectively. The resulting F1-score is 0.599. The [email protected] and [email protected]:0.95 values, situated at 0.597 and 0.269, corroborate these failings. Class-level breakdowns bring into focus the particular difficulty with ‘Fire’ identification, where recall scrapes a mere 0.529. A training run of 3.783 h and latency mirroring that of SGD do little to vindicate these disappointing findings.
Adamax delivers a moderate performance, achieving an overall precision of 0.731 and recall of 0.643. An F1-score of 0.684 implies a passable equilibrium, although [email protected] and [email protected]:0.95 values of 0.707 and 0.353 may hint at constraints in its positive-prediction reliability. At the class level, the figures document more favorable handling of ‘Smoke’ relative to ‘Fire.’ With 3.620 h of training and a latency of 3.7 ms, its yield does not meet the requirements of this use case.
AdamW grapples with severe difficulties, achieving the lowest overall precision of 0.601 and recall of 0.559, yielding a sparse F1-score of 0.579. Its [email protected] of 0.559 and [email protected]:0.95 of 0.247 reinforce these shortcomings. Class-disaggregated examination reveals faltering detection across both ‘Fire’ and ‘Smoke’ categories. Its training time of 3.479 h and latency of 3.7 ms do not compensate for such pronounced metric deficiencies.
NAdam delivers an unremarkable set of readings, with overall precision and recall at 0.648 and 0.605, respectively, and a resultant F1-score of 0.626. The [email protected] and [email protected]:0.95 quantities of 0.631 and 0.294 further underscore this mediocrity. While per-class metrics indicate evenness between ‘Fire’ and ‘Smoke’ recognition, a training footprint of 3.609 h and a latency of 3.7 ms fail to elevate it above the surrounding field.
RAdam records overall precision of 0.666 and recall of 0.579, combining into an F1-score of 0.620. Its [email protected] of 0.624 and [email protected]:0.95 of 0.292 conform to this pattern of moderate results. Class-sensitive figures indicate a more adept response to ‘Smoke,’ yet an extended training time of 3.866 h and a latency of 3.6 ms diminish its overall attractiveness.
Concluding the list, RMSProp underachieves, posting the feeblest aggregate precision of 0.616 and recall of 0.529, which yield an F1-score of 0.570. Its [email protected] of 0.558, alongside [email protected]:0.95 of 0.241, substantiates this inadequacy. Class-specific results emphasize its struggles, most conspicuously in ‘Fire’ detection. A training investment of 3.645 h and a latency of 3.7 ms do not redeem the lower metric tier.
In summary, SGD distinguishes itself as the preeminent optimizer for the wildfire and smoke detection task, owing to its consistently high performance across the metric panel and both object classes. Its deft reconciliation of precision with recall for ‘Smoke’ and ‘Fire’ alike, coupled with efficient training duration and inference latency, confirms its suitability for this domain. The remaining optimizers tell a story of heterogeneous results, with several encountering difficulties in particular sub-areas, a pattern that further underscores the suitability of SGD in this context.
The wide-ranging evaluation summarized in Table 6 analyzes multiple batch-size alternatives.
Table 6. Results of each batch size analyzed on validation. Fixed parameters: lr0 = 0.01, optimizer = SGD, weight decay = 0.0005, and epochs = 100.
Batch size | Class | [email protected]:0.95 | F1-score | Recall | Precision | Speed (ms) | Training time (hours) | |
16 | All | 0.589 | 0.862 | 0.836 | 0.809 | 0.864 | 3.6 | 3.231 |
Smoke | 0.661 | 0.897 | 0.872 | 0.844 | 0.902 |
| ||
Fire | 0.517 | 0.827 | 0.799 | 0.774 | 0.826 |
| ||
32 | All | 0.580 | 0.861 | 0.833 | 0.811 | 0.857 | 3.4 | 2.386 |
Smoke | 0.674 | 0.896 | 0.867 | 0.825 | 0.913 |
| ||
Fire | 0.528 | 0.823 | 0.804 | 0.775 | 0.836 |
| ||
64 | All | 0.601 | 0.868 | 0.838 | 0.815 | 0.863 | 3.4 | 1.980 |
Smoke | 0.671 | 0.901 | 0.873 | 0.850 | 0.898 |
| ||
Fire | 0.531 | 0.835 | 0.804 | 0.780 | 0.829 |
| ||
128 | All | 0.636 | 0.866 | 0.836 | 0.806 | 0.868 | 3.4 | 1.706 |
Smoke | 0.699 | 0.900 | 0.863 | 0.822 | 0.908 |
| ||
Fire | 0.522 | 0.832 | 0.809 | 0.781 | 0.839 |
| ||
256 | All | 0.617 | 0.863 | 0.833 | 0.801 | 0.868 | 3.5 | 1.625 |
Smoke | 0.684 | 0.894 | 0.864 | 0.822 | 0.910 |
| ||
Fire | 0.551 | 0.831 | 0.802 | 0.780 | 0.825 |
|
Starting with the default batch size of 16, this arrangement yields an aggregate precision score of 0.864, a recall of 0.809, and a corresponding F1-score of 0.836. Class-disaggregated inspection shows the 'Smoke' category outperforming 'Fire' by a clear margin: precision and recall for 'Smoke' reach 0.902 and 0.844, respectively, whereas for 'Fire' these measures settle at 0.826 and 0.774, respectively. The training duration for this batch size is 3.231 h.
Doubling the batch size to 32 raises the holistic recall measure to 0.811, while precision slips a touch to 0.857. Within the 'Smoke' category, a comparable dynamic unfolds—precision strengthens while recall retreats fractionally. The 'Fire' category registers barely discernible positive shifts in both recall and precision. No advancement can be reported for [email protected], though [email protected]:0.95 does show minor improvements across the 'Fire' and 'Smoke' groupings. Training time experiences a notable contraction, dropping to 2.386 h—a favorable development given the accompanying modest metric enhancements.
Progressing further to a batch size of 64, the detection figures maintain their upward momentum, with the most conspicuous gain materializing in recall, which climbs to an overall reading of 0.815. The two class-specific tracks share the trend: recall for 'Smoke' reaches 0.850 and for 'Fire' attains 0.780. In addition, both the F1-score and [email protected] exhibit meaningful improvement. Precision across the 'Smoke' and 'Fire' classes, conversely, remains relatively stationary. Training duration contracts once more, dropping to roughly 1.98 h, a factor that distinguishes this batch size for its ability to couple computational thrift with sustained—and, in important respects, elevated—detection quality.
Elevating the batch size to 128 improves overall precision and within each class. A gain also manifests in recall for the 'Fire' category; however, the aggregate recall recedes to 0.806, and the 'Smoke' category retreats to 0.822. No substantive progress is observed for [email protected], though [email protected]:0.95 shows appreciable positive movement across the overall amalgam and the 'Smoke' class. Training time contracts once more, now reaching 1.706 h, perpetuating the observed correlation between larger batches and heightened efficiency.
At the ceiling batch size of 256, the accrual of additional benefits is minimal compared to the 64 and 128 configurations. The sole metric to exhibit improvement is precision within the 'Smoke' category, which ticks upward slightly; across all other dimensions, performance essentially mirrors that of the batch size 128 setup. While certain indicators surpass those of the smaller-batch alternatives, no clear superiority can be claimed. This setting, however, posts the shortest training span of the series at approximately 1.625 h.
Synthesizing the evidence, the analysis highlights an intricate set of interdependencies among batch size selection, detection effectiveness, and resource expenditure that operate differently across object categories. The batch size of 64 emerges as the most judicious compromise, providing enhanced holistic recall while minimizing training overhead. Despite registering slightly lower precision than the batch size 128 configuration, this choice remains consonant with the study's pursuit of equilibrium. Notably, the recall advantage secured by this batch size over the 128 setting substantially eclipses the gap in their respective precision scores.
It should be remarked that the measured inference latency stayed effectively identical irrespective of the batch size employed, and therefore did not act as a deciding variable in settling upon the most advantageous batch size.
The effect of the weight decay coefficient is detailed in Table 7. Configured at 0.00005, the model yields aggregate precision, recall, and F1-score values of 0.864, 0.820, and 0.841, respectively. The [email protected] and [email protected]:0.95 readings are 0.865 and 0.600, respectively. Focusing solely on 'Smoke,' precision and recall lift further to 0.901 and 0.860, whereas 'Fire' holds at 0.827 and 0.780. These figures attest to a well-negotiated trade-off between localization and categorization at this coefficient magnitude, achieved within an efficient training window of 1.973 h.
Table 7. Results for each weight decay were analyzed on the validation set. Fixed parameters: lr0 = 0.01, optimizer = SGD, batch = 64, and epochs = 100.
Weight decay | Class | [email protected]:0.95 | F1-score | Recall | Precision | Speed (ms) | Training time (hours) | |
0.00005 | All | 0.600 | 0.865 | 0.841 | 0.820 | 0.864 | 3.4 | 1.973 |
Smoke | 0.674 | 0.906 | 0.880 | 0.860 | 0.901 |
| ||
Fire | 0.526 | 0.824 | 0.803 | 0.780 | 0.827 |
| ||
0.0005 | All | 0.601 | 0.868 | 0.838 | 0.815 | 0.863 | 3.4 | 1.980 |
Smoke | 0.671 | 0.901 | 0.873 | 0.850 | 0.898 |
| ||
Fire | 0.531 | 0.835 | 0.804 | 0.780 | 0.829 |
| ||
0.005 | All | 0.474 | 0.801 | 0.773 | 0.735 | 0.815 | 3.2 | 2.013 |
Smoke | 0.553 | 0.846 | 0.818 | 0.768 | 0.874 |
| ||
Fire | 0.396 | 0.755 | 0.727 | 0.701 | 0.755 |
| ||
0.05 | All | 0.085 | 0.217 | 0.156 | 0.552 | 0.091 | 3.2 | 1.900 |
Smoke | 0.088 | 0.206 | 0.194 | 0.449 | 0.124 |
| ||
Fire | 0.083 | 0.228 | 0.107 | 0.654 | 0.058 |
|
At the 0.0005 mark, a gentle waning in recall—down to 0.815 for the aggregated classes—can be observed, while precision remains anchored at 0.863. The 'Smoke' class undergoes a delicate downshift, posting precision of 0.898 and recall of 0.850; the 'Fire' class, in contrast, edges up ever so slightly to 0.829 and 0.780. The overall [email protected] and [email protected]:0.95 continue to hold steady at 0.868 and 0.601, signaling a stable performance plateau, and training time increases negligibly to 1.980 h.
Elevation to a weight decay of 0.005 triggers a more marked downturn, as precision, recall, and F1-score descend to 0.815, 0.735, and 0.773 across the combined classes. Both 'Smoke' and 'Fire' absorb declines: precision drops to 0.874 and 0.755, while recall recedes to 0.768 and 0.701. The [email protected] and [email protected]:0.95 readings similarly slide to 0.801 and 0.474, indicating eroded model performance, compounded by a training time of 2.013 h.
The examination of the 0.05 weight decay setting uncovers a near-total breakdown of model capacity, with aggregate precision collapsing to just 0.091. Precision for the 'Smoke' and 'Fire' categories plummets to 0.124 and 0.058, respectively, while recall is 0.449 and 0.654, respectively. The [email protected] and [email protected]:0.95 sink to 0.217 and 0.085, revealing a severe compromise in detection performance. Despite a marginally briefer training expenditure of 1.900 h, this degree of regularization is plainly untenable.
Inspection of latency behavior across varying weight-decay regimes reveals a largely invariant picture. With coefficients of 0.00005 and 0.0005, processing speed remains static at 3.4 ms. A fractional acceleration is perceptible at values of 0.005 and 0.05, where latency trims modestly to 3.2 ms. These patterns indicate that fluctuations in the weight decay parameter leave the model's processing tempo largely undisturbed, and the minute differences observed are unlikely to carry decisive weight in the final parameter determination.
To summarize, the weight-decay magnitudes of 0.0005 and 0.00005 each deliver the strongest overall performance. The performance gap between these two candidates is narrow; consequently, 0.00005 was selected as the preferred configuration. The improvements it brings to recall, precision, and the F1-score outweigh the marginal advantage that 0.0005 holds in [email protected]:0.95. The chosen setting also remains comfortably within acceptable bounds of computational cost and throughput, lending justification to its adoption.
As we approach the final hyperparameter under study, Table 8 illustrates how modifications to the epoch budget affect the detector's output.
Table 8. Results of each number of epochs analyzed on validation. Fixed parameters: lr0 = 0.01, optimizer = SGD, batch =64, and weight decay = 0.00005.
Epochs | Class | [email protected]:0.95 | F1-score | Recall | Precision | Speed (ms) | Training time (hours) | |
100 | All | 0.600 | 0.865 | 0.841 | 0.820 | 0.864 | 3.4 | 1.973 |
Smoke | 0.674 | 0.906 | 0.880 | 0.860 | 0.901 |
| ||
Fire | 0.526 | 0.824 | 0.803 | 0.780 | 0.827 |
| ||
200 | All | 0.627 | 0.877 | 0.847 | 0.792 | 0.909 | 3.2 | 4.020 |
Smoke | 0.706 | 0.903 | 0.868 | 0.812 | 0.933 |
| ||
Fire | 0.599 | 0.851 | 0.824 | 0.771 | 0.885 |
| ||
300 | All | 0.600 | 0.866 | 0.839 | 0.819 | 0.859 | 3.2 | 5.851 |
Smoke | 0.669 | 0.901 | 0.879 | 0.859 | 0.899 |
| ||
Fire | 0.530 | 0.831 | 0.799 | 0.779 | 0.820 |
|
When the training cycle is limited to 100 epochs, the detector produces an evenly distributed metric profile across the full set of classes: overall precision of 0.864, recall of 0.820, and an F1-score of 0.841. This pattern is somewhat more accentuated for the 'Smoke' grouping (precision at 0.901) than for the 'Fire' grouping (precision at 0.827). Moreover, the 100-epoch specification yields the highest recall readings, both in aggregate and when classes are examined in isolation. Training takes 1.973 h, with inference latency of 3.4 ms.
Extending the training horizon to 200 epochs yields a rise in precision throughout the class spectrum, the overall figure climbing to 0.909. The 'Smoke' grouping derives the greatest dividend from the supplementary epochs, with precision vaulting to 0.933. The 'Fire' grouping likewise partakes in the precision upswing, arriving at 0.885. A modest elevation of [email protected]:0.95 is also discernible. Set against these gains, however, training time nearly doubles to roughly 4.02 h, and processing tempo softens slightly to 3.2 ms. In parallel, recall contracts globally and for each class. This observation carries weight, especially given that the precision gains remain relatively contained compared to the baseline established at 100 epochs.
At the 300-epoch extreme, the picture becomes more ambiguous. Aggregate precision diminishes fractionally to 0.859, recall holds at a comparable 0.819, and the resultant holistic F1-score rests at 0.839. The class-specific precision and recall figures display no advancement whatsoever. This setting does not differ substantially from what is achieved with 100 epochs, aside from a stark increase in training time to 5.851 h. No improvement is registered in either [email protected] or [email protected]:0.95. Inference speed remains unshifted at 3.2 ms.
Condensing the observations, whereas extending the epoch count to 200 yields a precision boost; that gain comes at the cost of diminished recall and a greatly expanded training cycle, without yielding meaningful improvements in allied indicators such as the F1-score or [email protected]:0.95. Pushing the training further to 300 epochs offers nothing of substance beyond what the 100-epoch configuration already delivers, while imposing an even heftier temporal burden.
In light of the assembled evidence, maintaining the 100-epoch arrangement represents the soundest choice. This decision balances model capability and computational pragmatism, delivering dependable metric performance across the board while avoiding the disproportionate increase in training time that accompanies larger epoch allowances.
Following thorough scrutiny of a range of hyperparameters using the OFAT methodology, an optimized specification was definitively identified. The highest-performing instantiation crystallized around the following parameter set: lr0 fixed at 0.01, SGD as the optimizer, batch size set to 64, weight decay calibrated to 0.00005, and training over 100 epochs. This best configuration served as the substrate for subsequent hyperparameter refinement, standing as a stalwart baseline upon which further tuning could be built.
With the OFAT investigation concluded and armed with the understanding gleaned from its findings, we moved fluidly into the execution of RS, drawing upon those parameters that had demonstrated the greatest leverage over the model's behavior. The overarching objective was to determine whether an as-yet-undiscovered parameter constellation exists that could further enhance the model's ability to detect wildfires and smoke events.
In Table 9, the variables designated for exploration during the random search phase are enumerated, their selection grounded in the evidence accumulated during the preceding OFAT stage. For both the learning rate and the weight decay coefficient, a log-uniform distribution was used to sample candidate values within the specified intervals.
Table 9. Parameters selected for random search.
Parameter | Values |
Batch size | [64, 128] |
Learning rate | [0.001, 0.01] |
Weight decay | [0.00005, 0.0005] |
Beyond this, the decision was taken to execute 30 independent iterations of the random search procedure. This particular number of trials represents a carefully weighed compromise between comprehensive scanning of the parameter landscape and prudent use of computational resources. The figure guarantees that the exploration is both thorough and practicable, affording a robust likelihood of identifying the most favorable hyperparameter configuration without incurring an untenable computational cost.
It is also important to underscore that, through the meticulous dissection carried out during the OFAT stage, a subset of parameters was found to affect model output in a manner both unambiguous and decisive. In particular, both the number of training epochs and the optimizer identity produced starkly divergent outcomes.
Given the highly conclusive nature of those results, a purposeful choice was made to hold these two parameters constant throughout the random search. The optimizer was locked to SGD, and the epoch count was pegged at 100. These determinations were deemed optimal, as any further probing of alternative settings was deemed unwarranted. During the OFAT evaluation, the remaining options had been trialed and found to produce demonstrably inferior results coupled with tangible disadvantages, obviating the need to subject them to additional scrutiny within the random search context.
Through the breadth of analysis enabled by random search, several instructive patterns and observations emerged, enriching our understanding of how the model responds to divergent hyperparameter specifications. As shown in Table 10, across the configurations trialed, every model surpassed the aggregate precision of the C1 baseline—the model inherited from the OFAT analysis. In a similar vein, per-class precision readings also exceed those of the baseline in virtually every instance.
Table 10. Results of each random search combination on validation. Fixed parameters: optimizer = SGD and epochs = 100.
Model | Hyperparameters | Class | [email protected]:0.95 | F1-score | Recall | Precision | Speed (ms) | Training time (hours) | |
C1 | batch = 64, lr0 = 0.001, weight decay = 0.00005 | All | 0.600 | 0.865 | 0.841 | 0.820 | 0.864 | 3.4 | 1.973 |
Smoke | 0.674 | 0.906 | 0.880 | 0.860 | 0.901 |
| |||
Fire | 0.526 | 0.824 | 0.803 | 0.780 | 0.827 |
| |||
C2 | batch = 128, lr0 = 0.002478, weight decay = 0.0003585 | All | 0.617 | 0.868 | 0.840 | 0.816 | 0.866 | 3.2 | 1.717 |
Smoke | 0.681 | 0.901 | 0.869 | 0.830 | 0.912 |
| |||
Fire | 0.552 | 0.836 | 0.812 | 0.803 | 0.821 |
| |||
C3 | batch = 128, lr0 = 0.003466, weight decay = 0.0001080 | All | 0.619 | 0.867 | 0.842 | 0.813 | 0.872 | 3.2 | 1.713 |
Smoke | 0.687 | 0.899 | 0.873 | 0.838 | 0.910 |
| |||
Fire | 0.550 | 0.835 | 0.810 | 0.787 | 0.835 |
| |||
C4 | batch = 64, lr0 = 0.003591, weight decay = 0.00006723 | All | 0.619 | 0.868 | 0.848 | 0.821 | 0.876 | 3.4 | 1.977 |
Smoke | 0.685 | 0.900 | 0.879 | 0.847 | 0.913 |
| |||
Fire | 0.553 | 0.836 | 0.816 | 0.795 | 0.839 |
| |||
C5 | batch = 128, lr0 = 0.00201, weight decay = 0.00006124 | All | 0.613 | 0.865 | 0.843 | 0.814 | 0.874 | 4 | 2.196 |
Smoke | 0.684 | 0.898 | 0.876 | 0.839 | 0.917 |
| |||
Fire | 0.542 | 0.832 | 0.810 | 0.789 | 0.831 |
| |||
C6 | batch = 64, lr0 = 0.002953, weight decay = 0.00008582 | All | 0.609 | 0.863 | 0.837 | 0.818 | 0.857 | 4.1 | 2.705 |
Smoke | 0.678 | 0.900 | 0.869 | 0.843 | 0.896 |
| |||
Fire | 0.539 | 0.827 | 0.806 | 0.793 | 0.819 |
| |||
C7 | batch = 64, lr0 = 0.001334, weight decay = 0.0003086 | All | 0.614 | 0.867 | 0.846 | 0.823 | 0.871 | 4 | 2.743 |
Smoke | 0.684 | 0.902 | 0.880 | 0.852 | 0.910 |
| |||
Fire | 0.543 | 0.832 | 0.813 | 0.794 | 0.833 |
| |||
C8 | batch = 64, lr0 = 0.008187, weight decay = 0.0001478 | All | 0.612 | 0.866 | 0.840 | 0.816 | 0.866 | 4 | 2.735 |
Smoke | 0.681 | 0.903 | 0.873 | 0.846 | 0.902 |
| |||
Fire | 0.544 | 0.830 | 0.807 | 0.785 | 0.830 |
| |||
C9 | batch = 128, lr0 = 0.0038004, weight decay = 0.0003007 | All | 0.603 | 0.868 | 0.840 | 0.811 | 0.870 | 4.1 | 2.178 |
Smoke | 0.676 | 0.907 | 0.876 | 0.839 | 0.916 |
| |||
Fire | 0.530 | 0.828 | 0.803 | 0.783 | 0.823 |
| |||
C10 | batch = 128, lr0 = 0.001654, weight decay = 0.0002925 | All | 0.619 | 0.867 | 0.843 | 0.816 | 0.872 | 4.1 | 2.213 |
Smoke | 0.683 | 0.899 | 0.873 | 0.837 | 0.913 |
| |||
Fire | 0.556 | 0.834 | 0.812 | 0.794 | 0.831 |
| |||
C11 | batch = 64, lr0 = 0.001489, weight decay = 0.000052318 | All | 0.592 | 0.864 | 0.842 | 0.820 | 0.866 | 4.2 | 2.735 |
Smoke | 0.665 | 0.902 | 0.882 | 0.856 | 0.911 |
| |||
Fire | 0.519 | 0.826 | 0.801 | 0.783 | 0.820 |
| |||
C12 | batch = 128, lr0 = 0.003701, weight decay = 0.0004823 | All | 0.641 | 0.869 | 0.840 | 0.791 | 0.895 | 3.2 | 1.703 |
Smoke | 0.703 | 0.900 | 0.863 | 0.802 | 0.933 |
| |||
Fire | 0.579 | 0.838 | 0.817 | 0.781 | 0.857 |
| |||
C13 | batch = 64, lr0 = 0.002423, weight decay = 0.00006450 | All | 0.630 | 0.874 | 0.846 | 0.806 | 0.891 | 3.4 | 2.009 |
Smoke | 0.696 | 0.910 | 0.879 | 0.833 | 0.930 |
| |||
Fire | 0.564 | 0.838 | 0.814 | 0.779 | 0.853 |
| |||
C14 | batch = 64, lr0 = 0.001335, weight decay = 0.00011227 | All | 0.627 | 0.868 | 0.843 | 0.799 | 0.892 | 3.4 | 2.009 |
Smoke | 0.696 | 0.901 | 0.874 | 0.823 | 0.931 |
| |||
Fire | 0.559 | 0.834 | 0.812 | 0.775 | 0.853 |
| |||
C15 | batch = 64, lr0 = 0.008838, weight decay = 0.0002221 | All | 0.622 | 0.869 | 0.844 | 0.806 | 0.886 | 3.2 | 2.004 |
Smoke | 0.687 | 0.900 | 0.875 | 0.833 | 0.921 |
| |||
Fire | 0.558 | 0.838 | 0.814 | 0.780 | 0.851 |
| |||
C16 | batch = 128, lr0 = 0.001114, weight decay = 0.00007419 | All | 0.623 | 0.865 | 0.843 | 0.799 | 0.892 | 3.2 | 1.705 |
Smoke | 0.690 | 0.898 | 0.875 | 0.823 | 0.934 |
| |||
Fire | 0.555 | 0.832 | 0.811 | 0.776 | 0.850 |
| |||
C17 | batch = 128, lr0 = 0.00696, weight decay = 0.000099264 | All | 0.634 | 0.864 | 0.838 | 0.795 | 0.886 | 3.2 | 1.704 |
Smoke | 0.698 | 0.895 | 0.865 | 0.809 | 0.929 |
| |||
Fire | 0.570 | 0.833 | 0.810 | 0.781 | 0.842 |
| |||
C18 | batch = 128, lr0 = 0.002108, weight decay = 0.0004372 | All | 0.635 | 0.866 | 0.841 | 0.798 | 0.889 | 3.2 | 1.700 |
Smoke | 0.699 | 0.897 | 0.865 | 0.811 | 0.927 |
| |||
Fire | 0.572 | 0.835 | 0.816 | 0.785 | 0.850 |
| |||
C19 | batch = 128, lr0 = 0.002165, weight decay = 0.000059954 | All | 0.638 | 0.869 | 0.843 | 0.802 | 0.889 | 3.2 | 1.701 |
Smoke | 0.702 | 0.902 | 0.874 | 0.822 | 0.932 |
| |||
Fire | 0.574 | 0.837 | 0.812 | 0.782 | 0.845 |
| |||
C20 | batch = 128, lr0 = 0.001646, weight decay = 0.00006276 | All | 0.633 | 0.871 | 0.846 | 0.803 | 0.893 | 3.2 | 1.699 |
Smoke | 0.700 | 0.904 | 0.874 | 0.821 | 0.934 |
| |||
Fire | 0.566 | 0.837 | 0.817 | 0.784 | 0.853 |
| |||
C21 | batch = 64, lr0 = 0.00426, weight decay = 0.000112 | All | 0.629 | 0.869 | 0.844 | 0.815 | 0.875 | 3.2 | 2.001 |
Smoke | 0.695 | 0.901 | 0.874 | 0.839 | 0.912 |
| |||
Fire | 0.563 | 0.837 | 0.814 | 0.792 | 0.838 |
| |||
C22 | batch = 128, lr0 = 0.003139, weight decay = 0.0004149 | All | 0.640 | 0.867 | 0.841 | 0.792 | 0.897 | 3.2 | 1.703 |
Smoke | 0.703 | 0.897 | 0.870 | 0.812 | 0.936 |
| |||
Fire | 0.577 | 0.837 | 0.813 | 0.772 | 0.858 |
| |||
C23 | batch = 128, lr0 = 0.00484, weight decay = 0.000071190 | All | 0.644 | 0.871 | 0.842 | 0.802 | 0.887 | 3.2 | 1.706 |
Smoke | 0.703 | 0.896 | 0.863 | 0.809 | 0.924 |
| |||
Fire | 0.585 | 0.846 | 0.822 | 0.796 | 0.850 |
| |||
C24 | batch = 128, lr0 = 0.00138, weight decay = 0.0001773 | All | 0.628 | 0.862 | 0.840 | 0.808 | 0.874 | 3.2 | 1.706 |
Smoke | 0.697 | 0.893 | 0.869 | 0.822 | 0.921 |
| |||
Fire | 0.559 | 0.830 | 0.810 | 0.794 | 0.827 |
| |||
C25 | batch = 64, lr0 = 0.006569, weight decay = 0.00033943 | All | 0.627 | 0.872 | 0.845 | 0.805 | 0.890 | 3.2 | 2.028 |
Smoke | 0.690 | 0.903 | 0.878 | 0.836 | 0.924 |
| |||
Fire | 0.563 | 0.840 | 0.812 | 0.773 | 0.856 |
| |||
C26 | batch = 64, lr0 = 0.001177, weight decay = 0.00014898 | All | 0.621 | 0.866 | 0.843 | 0.805 | 0.884 | 3.1 | 2.006 |
Smoke | 0.686 | 0.897 | 0.874 | 0.827 | 0.926 |
| |||
Fire | 0.556 | 0.835 | 0.812 | 0.784 | 0.842 |
| |||
C27 | batch = 128, lr0 = 0.0096, weight decay = 0.000074206 | All | 0.635 | 0.860 | 0.833 | 0.801 | 0.867 | 3.1 | 1.685 |
Smoke | 0.699 | 0.892 | 0.860 | 0.814 | 0.911 |
| |||
Fire | 0.571 | 0.829 | 0.806 | 0.789 | 0.824 |
| |||
C28 | batch = 64, lr0 = 0.002373, weight decay = 0.0004213 | All | 0.628 | 0.872 | 0.847 | 0.812 | 0.885 | 3.1 | 1.992 |
Smoke | 0.691 | 0.902 | 0.875 | 0.834 | 0.921 |
| |||
Fire | 0.564 | 0.843 | 0.819 | 0.790 | 0.850 |
| |||
C29 | batch = 64, lr0 = 0.006589, weight decay = 0.000057413 | All | 0.625 | 0.869 | 0.847 | 0.817 | 0.879 | 3.2 | 2.039 |
Smoke | 0.692 | 0.903 | 0.879 | 0.844 | 0.916 |
| |||
Fire | 0.557 | 0.834 | 0.814 | 0.789 | 0.841 |
| |||
C30 | batch = 64, lr0 = 0.001357, weight decay = 0000073171 | All | 0.625 | 0.866 | 0.841 | 0.800 | 0.887 | 3.1 | 2.008 |
Smoke | 0.692 | 0.899 | 0.873 | 0.822 | 0.930 |
| |||
Fire | 0.557 | 0.833 | 0.810 | 0.779 | 0.844 |
|
Securing elevated recall, by contrast, proved to be a considerably more demanding undertaking. Out of the entire pool of candidate models, a mere three—C4, C7, and C11—managed either to equal or to outstrip the holistic recall figure posted by the C1 configuration. Indeed, setting aside these three exceptions, the remaining configurations suffered a contraction in aggregate recall of as much as 0.028 (C22). Furthermore, the recall benchmark established for the 'Smoke' category was never exceeded in any trial. For the 'Fire' class, on the other hand, localized improvements did materialize in selected cases.
Turning to the F1-score, gains are detectable both at the aggregate level and within the 'Fire' class. These advances, however, are somewhat deceptive, as the lift in the F1-score is predominantly attributable to a surge in precision, a dynamic that cloaks the simultaneous retreat in recall, an equally consequential metric. With respect to [email protected] and [email protected]:0.95, the picture shows substantial dispersion, with models registering both superior and inferior outputs relative to the baseline. Training times and inference latencies did, on occasion, stretch upward, though not extravagantly, peaking at approximately 2.743 h and 4.2 ms, respectively.
Given that the entire set of models improved over the C1 configuration in precision, but only a subset achieved a corresponding increase in recall, the ensuing analysis focuses exclusively on those that did. The rationale is that even a marginal enhancement in recall can prove decisive when the stakes involve forestalling, spotting, and mounting a swift reaction to a fire. In other words, our attention narrows to models C4, C7, and C11.
The C4 model, with a weight decay of 0.00006723, a batch size of 64, and an initial learning rate of 0.003591, achieved notable improvements over the prior OFAT-tuned baseline. In concrete terms, precision rose to 0.876, recall to 0.821, and the F1-score to 0.848, while [email protected] strengthened to 0.868.
Regarding the pivotal 'Smoke' category, recall climbed to 0.847—a metric of considerable consequence for wildfire surveillance —signaling the model's sharpened sensitivity in identifying genuine positives. The training duration remained nearly steady compared with the OFAT-derived model. The 'Fire' class likewise benefited, with precision and recall rising to 0.839 and 0.795, respectively, indicating an even-handed uplift across the performance spectrum.
The C7 model, with a batch size of 64, an initial learning rate of 0.001334, and a weight decay of 0.0003086, continued its upward trajectory of improvement. It delivered an aggregate recall of 0.823, marginally surpassing the 0.820 achieved by the OFAT model, indicating a stronger ability to identify true positives accurately. This edge was particularly pronounced in 'Smoke' detection, where recall reached 0.852, further bolstering the model's aptitude for smoke identification.
Within the 'Fire' class, this model achieved a precision of 0.833 and a recall of 0.794, continuing the sequence of progressive gains. Tellingly, this model's training cycle lasted 2.743 h, and its inference latency reached 4 ms; even so, it showed an overall metric profile well-balanced across every respect. It stands as a testament to the value of probing beyond the confines of the OFAT-optimized solution.
The C11 model, configured with a batch size of 64, an initial learning rate of 0.001489, and a weight decay of 0.000052318, produced more incremental improvements. While its aggregate precision, recall, and F1-score all tracked closely alongside those of the OFAT-optimized reference, it nonetheless secured gains in targeted areas. Most prominently, recall for the 'Smoke' class rose to 0.856, and precision for the 'Fire' class increased modestly to 0.820. These selective improvements, though circumscribed in scope, point toward refined discriminatory capacity. The model's training outlay and processing throughput remained broadly comparable to those of the C7 variant.
A revealing commonality among the models that surpassed the OFAT-optimized benchmark is that each was trained using a batch size of 64. At the same time, this election modestly prolonged both training and inference latencies; the attendant uplift in key performance indicators suggests that the trade-off was, on balance, advantageous.
The random search sweep across hyperparameter combinations yielded instructive insights and identified three configurations that outperformed the OFAT-tuned model. The gains were most apparent in precision and recall—the two metrics that lie at the heart of effective wildfire and smoke detection.
Among this trio, the C4 formulation distinguishes itself as a harmoniously improved solution, having raised multiple critical performance indicators despite a mild increase in training duration and inference latency. While it was not the configuration that exceeded the baseline by the widest margin in precision, it nonetheless attained the strongest aggregate recall. In other words, it exhibited enhancement distributed across the full metric panel, in contrast to alternative models that registered sharper precision gains at the expense of a recall decline—an exchange pattern that is distinctly undesirable for the present application.
The aggregate of these findings confirms that the RS methodology enabled the discovery of a previously undiscovered parameter configuration, pushing beyond the reach of the OFAT approach and thereby fostering heightened competitiveness in detecting forest fires and smoke events. It stands as a compelling endorsement of the potency of random search as a vehicle for hyperparameter refinement.
The enhancements secured through the sequential application of OFAT and random search can be further appreciated by juxtaposing the resulting models against the initial fine-tuned baseline. That baseline—constructed exclusively by training on the novel dataset—furnishes a reference point against which the magnitude of subsequent progress can be measured.
The initial fine-tuned model (YOLOv8l), trained solely on the new image corpus, achieved an aggregate precision of 0.864, recall of 0.809, and F1-score of 0.836. By comparison, C4, which emerged as the leading candidate from the random search, delivered substantial improvements across these central indicators. Concretely, relative to the initial fine-tuned model, C4 lifted overall precision by 1.39%, recall by 1.48%, the F1-score by 1.44%, [email protected] by 0.70%, and [email protected]:0.95 by 5.09 %.
This side-by-side examination underscores the potency of our optimization pipeline in refining the model's specification. It brings into relief the meaningful performance dividends that flow from a deliberate and exacting hyperparameter tuning sequence. The concurrent gains in precision and recall signal a sharpened dual capacity to localize and correctly categorize both smoke and flame phenomena, rendering the resulting model a compelling instrument for deployment in operational settings.
Beyond numerical comparisons, we broadened the analytical lens through visual inspections aimed at teasing apart the behavioral differences between the initial fine-tuned model, the OFAT-derived model (termed C1), and the ultimate top-performing configuration (C4) obtained from RS. These qualitative examinations provided illuminating insights into how each model behaved when confronted with real-world visual material.
A corpus of images was gathered from internet sources, deliberately targeting scenes portraying agricultural landscapes engulfed in flames. The selection was curated to span a wide range of viewpoints and environmental conditions, thereby ensuring that the models were tested against the intricate and capricious nature of wildfire episodes in agricultural contexts. This approach yielded a holistic diagnostic, enabling a comparison of the detection faculties resident in the initial and final instantiations of the model. The comparative exercise focused not only on the quantitative dimensions of model output but also on the qualitative distinctions in how each architecture interprets and reacts to real-world scenarios, most critically in agricultural settings where prompt and precise recognition is essential.
The outcome revealed that across a large share of the trials, all three models delivered solid, mutually comparable performance. Nevertheless, closer inspection of specific test compositions revealed subtle gradations in their effectiveness, corroborating the variations already captured by the reported metrics. These distinctions become especially manifest in Figure 5, which assembles a curated set of scenes that lay bare the differential proficiencies of each model.
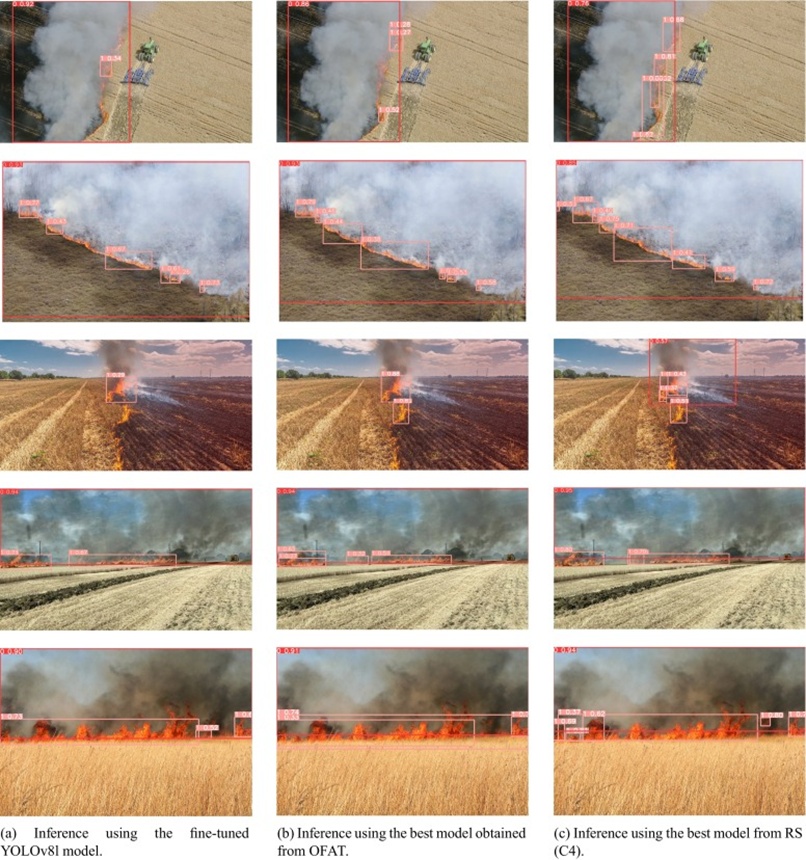
Figure 5. Inference using the best models of each stage. 0 = smoke, 1 = fire.
As borne out by our testing, the three models generally performed well and exhibited broadly analogous behavior throughout many of the evaluated scenarios. Yet a more granular analysis of select test frames revealed subtle nuances in their respective capabilities. These variations, though not invariably striking at first glance, were plainly identifiable in particular instances. The contrasts in model performance are exemplified in a subset of the scenes shown in Figure 5. This juxtaposition cogently illustrates the progression and distinguishing traits of the initial and final optimized models, thereby affirming the contribution of fine-tuning and hyperparameter refinement to elevating detection competence.
The fine-tuned-only model betrays perceptible limitations in its output. Most notably, it often yields lower confidence scores than the other two variants. This shortfall is especially apparent in the model's inconsistent recording of every fire and smoke occurrence present in a scene. Such a constraint represents a material weakness, as it indicates a higher likelihood that the model will miss genuine fire and smoke events under various conditions. Missed detections of this nature could carry grave consequences, especially in time-critical situations where early and accurate identification is the linchpin of swift countermeasures.
In marked contrast, the best-performing configuration identified through the OFAT procedure shows clear progress relative to the basic fine-tuned counterpart. This model produces more reliable outputs, as evidenced by its higher confidence scores. The step up in confidence levels bespeaks a more resilient and more precise detection faculty. Moreover, this model exhibits a meaningful advance in the accuracy with which it places bounding boxes, outstripping the initial model in singling out and circumscribing fire and smoke phenomena. Though it is not without residual blemishes, this OFAT-optimized variant constitutes a tangible stride toward more accurate and more trustworthy wildfire recognition, a property of considerable consequence for deployment across varied and demanding operational environments.
Lastly, turning to the third model, designated C4 and issuing from the RS procedure, it distinguishes itself by its well-rounded behavior. Although this variant occasionally yields marginally lower confidence scores than the OFAT model, the C4 configuration excels at suppressing false-positive detections. This characteristic contributes to the greater consistency and dependability it exhibits over the gamut of test scenes incorporated in the investigation.
The third model, designated C4 and originating from the RS stage, stands apart further for its exceptional proficiency at surfacing instances of interest. While it sometimes records confidence levels that do not exceed those of the OFAT-tuned variant, it shines at flagging more instances with high confidence scores. This augmented detection capability is brought into sharp focus in specific situations, such as those shown in the first and third rows of the figure, where C4 reliably identifies fire and smoke events that other models are liable to overlook.
It must, however, be acknowledged that, on occasion, the C4 model may generate bounding boxes that overlap, hindering the clear separation of individual instances. Despite this tendency, provided the monitoring infrastructure is properly designed to leverage the detection module's confidence scores fully, C4's greater aptitude for surfacing higher-confidence detections makes it a safer and more trustworthy option for surveilling zones at risk of wildfire outbreaks. This strength carries particular value in guaranteeing comprehensive vigilance and responsiveness within agricultural and environmental safety applications.
To supplement evaluations of static imagery, we further broadened our assessment of the C4 model—the top-performing and definitive configuration identified through this investigation—by deploying it on video sequences. This trial was conceived to gauge the model's behavior and throughput within a fluid, real-time stream, closely mirroring the unfolding dynamics of actual wildfire and smoke conditions across time.
Finally, we have situated our optimized model alongside alternative approaches drawn from the contemporary literature, as set out in Table 11. It bears emphasis that the ambition of our study was not to eclipse any particular benchmark but rather to document a thoroughgoing optimization pathway for YOLOv8 geared toward practical, real-world deployment. Our model registers commendable enhancements, a point of particular salience given the overriding importance of prompt and dependable fire and smoke identification.
Table 11. Comparison of our optimized model (C4) with other YOLO approaches from the literature.
Model | Class | [email protected]:0.95 | F1-score | Recall | Precision | Ref. | |
YOLOv3 | All | 0.661 | 0.789 | 0.810 | 0.780 | 0.840 | |
YOLOv5 | All | – | 0.707 | – | 0.685 | 0.714 | |
YOLOv7 | All | – | 0.828 | – | 0.766 | 0.831 | |
YOLOv8 | All | 0.619 | 0.868 | 0.848 | 0.821 | 0.876 | Ours |
The results, nonetheless, show that our model not only maintains competitive metric levels but also exceeds other YOLO generations across several key dimensions. An aggregate precision of 0.876 and a recall of 0.821, computed over the full set of classes, testify jointly to its discriminative accuracy and its dependability in surfacing genuine positives—a property of paramount consequence in the domain of wildfire and smoke surveillance. The F1-score, positioned at 0.848, conveys a well-negotiated equilibrium between precision and recall. Beyond this, our model outstrips prior YOLO releases, achieving an [email protected] of 0.868 and demonstrating robustness with an [email protected]:0.95 of 0.619, figures that attest to its operational soundness across a range of decision thresholds. These strong numerical indicators bolster the model's suitability for deployment in practical contexts, affirming that the painstaking optimization regimen undertaken in this work has indeed produced a formidable entrant in the object detection arena.
To summarize, the cyclical hyperparameter refinement procedure—drawing on both the OFAT technique and RS—has yielded meaningful gains for our model, extending well beyond the initial fine-tuning milestone. Appraisal through a multiplicity of metrics has not merely evidenced steady theoretical advancement but has also laid bare tangible real-world benefits. These enhancements are further supported by illustrative graphical examples that align with the quantitative findings and, together, furnish a holistic portrait of the model's capabilities.
The ramifications of these advances carry particular weight when viewed through the lens of agricultural safeguarding and surveillance. The tuned model's sharpened ability to faithfully and precisely flag wildfire and smoke episodes can serve as an indispensable tool for protecting cultivated land and agricultural assets.
This elevated exactness and consistency translate into prompter recognition and, by extension, the prospect of swifter reaction to fire ignitions across rural and farming territories, thereby defending harvests, herds, and the subsistence of communities anchored in agriculture. The performance gains realized in this investigation, therefore, amount to more than a purely technical milestone; they constitute a substantive contribution to the broader spheres of agrarian safety and environmental stewardship.
Throughout this investigation, we focused on refining a deep learning architecture for the vital task of smoke and wildfire recognition, with a particular emphasis on deployments in the agricultural domain. Our strategy encompassed a sweeping comparative audit of every YOLOv8 variant—a state-of-the-art computer vision framework—conditioned against a dataset purpose-built to represent a broad spectrum of fire and smoke manifestations, with particular attention to those impacting farming landscapes. The large-capacity edition, YOLOv8l, was singled out as the preeminent configuration, with the greatest promise for subsequent stages of optimization, given its baseline performance.
Once the YOLOv8 large variant was designated as the foundational architecture, we applied the One Factor at a Time framework to systematically vary and evaluate isolated hyperparameters. This exacting sequence guided us toward an optimized parameter set: an initial learning rate of 0.01, the SGD optimizer, a batch size of 64, a weight decay coefficient of 0.00005, and a training span of 100 epochs. Seeking to improve performance further and strengthen the model's resilience, we subsequently incorporated a Random Search strategy into the hyperparameter tuning pipeline.
The culmination of our optimization campaign produced a final model that represents a significant advancement over the initial YOLOv8l baselines. This polished configuration, distinguished by its reliance on the SGD optimizer, a precisely calibrated weight decay of 0.00006723, a batch size of 64, an optimal learning rate of 0.003591, and a comprehensive training allotment of 100 epochs, yielded pronounced performance upswings. In concrete terms, it achieved an uplift in overall precision of 1.39 %, recall of 1.48 %, and F1-score of 1.44 %, along with appreciable advances in mAP indicators—an increase of 0.70 % at the 0.50 threshold and a striking 5.09 % across the 0.50:0.95 range. These gains cement the model's heightened capacity to detect smoke and wildfires, underscoring the decisive influence of our hyperparameter optimization protocol on strengthening detection performance.
The advancements attained through our culminating optimized model transcend the purely theoretical realm, manifesting themselves as substantial practical improvements. When subjected to exacting evaluation against a handpicked collection of real-world images, deliberately curated to span a diversity of agricultural conditions, the model's progress was rendered unmistakable. In the first instance, whereas the initial model frequently overlooked fire and smoke occurrences within a given frame, the final optimized version demonstrated a pronounced aptitude for surfacing a considerably larger tally of such occurrences, amplifying its usefulness in time-critical wildfire detection scenarios. Furthermore, the baseline model's tendency to emit low-confidence detections was markedly alleviated in the optimized incarnation, which uncovered more instances while consistently delivering higher, more stable confidence scores.
To sum up, our study illustrates that through an even-handed synthesis of wide-ranging fine-tuning and granular hyperparameter refinement—harnessing both One Factor at a Time analysis and Random Search—a highly proficient model for detecting smoke and fire across heterogeneous settings, and most pointedly within agricultural environments, can be constructed. The approach laid out in this paper reveals that attaining a functional and efficient detection architecture need not lean on the sophistication of more elaborate algorithmic families, such as evolutionary strategies. Rather, deliberate and judicious optimization can drive significant progress toward real-world utility. These developments not only highlight the model's effectiveness when deployed in practical contexts but also represent a meaningful addition to the corpus of image recognition technology directed at agricultural and environmental protection.
When casting an eye toward the horizon, considerable latitude exists for extending this line of inquiry. Probing alternative object detection backbones and a wider catalogue of hyperparameters through a comparative study could yield deeper insights. Augmenting the training and validation corpora to encompass a broader assortment of fire and smoke exemplars, particularly those specific to diverse agricultural milieux, would further enhance the model's adaptability. Additionally, examining the real-time fielding potential of this architecture, above all within emergency response infrastructures serving farming communities, constitutes a promising trajectory for subsequent investigation.
None
The authors declare the following financial interests/personal relationships which may be considered as potential competing interests: all authors are employed by Kauel Inc.
None
None
Open Access The author(s) retain copyright. This article is licensed under the Creative Commons Attribution-NonCommercial-ShareAlike 4.0 International License. It may be shared and adapted for non-commercial purposes with appropriate attribution, an indication of changes, and distribution of adaptations under the same license. Third-party material may be subject to separate terms identified in its credit line. View the license at https://creativecommons.org/licenses/by-nc-sa/4.0/.
 Agro Intelligence Research Press