Forecasting crop yields provides crucial intelligence for growers of high-value commodities, helping them organize and streamline harvest logistics. The bulk of current yield forecasting approaches rely on manual sampling and statistical procedures, which are intricate, labor-intensive, and time-consuming. Lately, advances in image processing and the broader integration of autonomous systems, such as unmanned aerial vehicles, have enabled swifter, more precise yield forecasting across diverse crops. This work puts forward a novel, rapid, efficient, and accurate image processing algorithm. The segmentation technique proved capable of distinguishing mature citrus trees from their natural surroundings within the CIE (Commission Internationale de l'Éclairage) Lab color space. The influence of the spacing between the camera and the target on resolution and detection accuracy was examined and discussed. Outcomes revealed that distances from 1.524 meters (5 feet) up to 2.134 meters (7 feet) yielded high detection accuracy. The count of correctly recognized fruit attained 91.69%, with an average processing duration of 1.1 s for each image across a set of 132 images. A correlation coefficient (R2) equal to 0.98 was secured between the citrus counting algorithm and counts generated through human visual assessment of 66 sample trees. A comparative review of the introduced technique indicated greater accuracy and robustness than other related research.
In contemporary agriculture, pre-harvest yield estimation and mapping of carry weight occur at several junctures of the production cycle. Being able to project yield empowers farmers to plan their harvest logistics, crop storage, and sales. Today, the leading technique for estimating fruit tree yield relies on fruit sampling and a statistical framework. Sampling is commonly performed on a handful of individual trees and subsequently extrapolated across the whole orchard. Multiple researchers have worked to improve traditional approaches; for example, Ref. [1] sorted tree rows by vegetative indices to develop multilevel manual sampling protocols for fruit count estimation. Still, their approach demands heavy labor input. Inefficiency, labor expense, and time drain represent the core shortcomings of conventional techniques. An intelligent remote imaging system was designed and trialed by Ref. [2] for yield prediction, grounded in both direct fruit-count sampling and aerial observation. Their findings indicated that more advanced equipment is required to speed yield estimation and reduce costs.
Given the swift evolution of machine vision technology, these systems can offer real-time operation, cost-effectiveness, reliability, and speed [3]. Certain scholars have delved into automated fruit detection methods to pinpoint and count fruits on the tree. Koirala et al. [4] gauged mango fruit load via machine vision paired with deep learning. Bresilla et al. [5] employed deep convolutional neural network architectures rooted in single-stage detectors to spot and count fruits (apple and pear) within the tree canopy. Gan et al. [6] identified immature green citrus by combining color and thermal imagery. Wan et al. [7] developed a computer vision-based methodology for assessing the maturity of fresh tomatoes. Choi et al. [8] deployed red, green, and blue (RGB), near-infrared (NIR), and depth sensors as part of an outdoor machine vision system to quantify immature citrus located in tree canopies. Sa et al. [9] developed a fruit detection system that recognizes seven fruits using a novel multimodal Faster R-CNN model. Qiang et al. [10] applied a multi-class support vector machine (SVM) to simultaneously segment the fruits 50 and branches of citrus fruit. Within the machine vision technology employed, the speed, precision, and robustness of these methods are vital for fruit yield estimation [11]. Building on what these works accomplished, refining a fruit detection method can further improve the precision of fruit yield estimation and mapping.
Previously studied fruit detection methods span a range of sensors, systems, image processing techniques, and soft computing methods [12, 13]. Most image processing stages involved in fruit detection are highly complex [14, 15]. Soft computing methods are also applied after feature extraction to improve detection accuracy [9].
The most cutting-edge computational methods applied to fruit detection were support vector machines [16], artificial neural networks [17, 18], and deep learning [14], each of which made strong contributions. Yet they compound system complexity and require sufficient, precise training samples to produce dependable results.
Image processing operating in the visible spectrum is the most established practice for in-field fruit recognition [19]. Other studies have used various thermal, color, and hyperspectral cameras to capture images of fruit [20, 21]. The fluctuating lighting conditions typical of orchards under natural sunlight can also affect the intensity of light reflection, leading to false fruit detection [22].
Fruit color, geometry, and texture are three pivotal features in image processing. These characteristics help set fruit apart from leaves, branches, and other background objects within the orchard setting. Linker et al. [23] and Stajnko et al. [24] conducted analyses centered on shape and color, reporting accuracies of 85% and 89%, respectively. Thus, to achieve superior detection accuracy, multiple features (color, shape, texture, and reflectance) need to be integrated to address challenges such as clustering, occlusion, and changing lighting conditions. Earlier, Ref. [25] thoroughly combined color, shape, and size features to segment oranges in tree canopy images. Later, Ref. [26] presented an automatic fruit recognition system that classifies and identifies fruit types by using fruit shape and color to characterize each image.
The key to yield estimation involves detecting fruit positioned on the surface and isolating it from a confusing backdrop. Different color spaces have been applied to imagery for varied fruit detection tasks. Dorj et al. [15] developed a new algorithm for automating fruit detection by converting the red-green-blue (RGB) color space to the hue-saturation-value (HSV) color space. Accordingly, they reported a correlation coefficient (R2) of 0.93 between the citrus counting algorithm and manual counting by human observers. Their image segmentation pipeline, however, was notably complex, spanning threshold-based color detection, fruit segmentation, noise filtering, morphological operations, labeling, feature extraction, and classification. In recent work [27, 28], a multi-elliptical boundary model was formulated in Cr-Cb coordinates to detect citrus fruit and tree trunks under natural lighting conditions. Their experimental data showed that the correct identification rate for fruit detection from images increased to 90.8%, while the false-positive rate decreased to 11.2%. Even so, image processing remains time-heavy.
In select studies, merging multiple color components across one or more color spaces has also been employed to segment images [29]. The methods largely focused on extracting weighted additions and subtractions by separating multiple color components within the chosen color space, sidestepping noise-deletion, filtering, and thresholding operations. Finding an acceptable trade-off between accuracy and computational efficiency, however, proves difficult. Although the proposed ensemble strategy can enhance the results delivered by individual methods, it also bundles together the cost of all of them.
Citrus ranks among the many fruit crops cultivated in California and is significant to the state’s economy. As ripening progresses, the coloration of citrus fruit (excluding limes) diverges from the background; accordingly, we hypothesized that the color feature would be easy to segment from background elements such as leaves, trunks, and skies. Thus, it may be feasible for citrus detection to rely on a color-image algorithm operating in an alternative color space. In the current study, a new algorithm was developed to detect and enumerate citrus fruits using fast image processing without background or noise removal. Thanks to its reduced data handling and faster execution, the proposed algorithm may also be suitable for real-time machine vision and harvesting robotics.
One hundred thirty-three images were acquired at 145 cm elevation and at a constant 213 cm distance perpendicular to each tree row, using an iPhone XR (Apple Inc., USA) digital camera phone. The pictures had a resolution of 4032×3024 pixels (near 5.5 Megapixels), shot in auto-focus mode with natural sunlight as the backdrop, excluding optical or digital zoom and flash; all files were preserved in JPG format. Evaluations were conducted on two citrus varieties (mandarin and orange) throughout the ripening window. The fruit imagery was gathered during September and November of 2018 at Shiraz Ranch orchards (the row bounded by latitude: 37°20′42.6″N, longitude: 121°06′48.4″W; and latitude: 37°20′53.5″N, longitude: 121°06′51.3″W) in Newman, California. Seeing that illumination ranks among the dominant factors shaping image quality, a light intensity meter was used to quantify brightness adjacent to the trees and beside the camera under natural outdoor daylight, spanning both overcast and sunny conditions. The hardware setup comprised: an Intel Core i5 Processor Laptop, a Windows 64-bit operating system, and 4 GB RAM. Furthermore, MATLAB software (version 2018a, Mathworks Inc., USA) underpinned the image processing and modeling efforts in this research.
The most formidable portion of fruit recognition lies in stripping away the “clutter objects”—foliage, limbs, sky, and ground—from the backdrop, an obstacle that earlier work has consistently shown to be taxing. Against this backdrop, a new algorithm for swift image processing, with fewer stages and lower complexity, was proposed to achieve a satisfactory level of accuracy. This algorithm was streamlined, as shown in Figure 1. Unlike other methodologies, it sidesteps stages such as noise filtering, morphological operations, labeling, and feature extraction [7, 15, 22, 26, 30, 31].
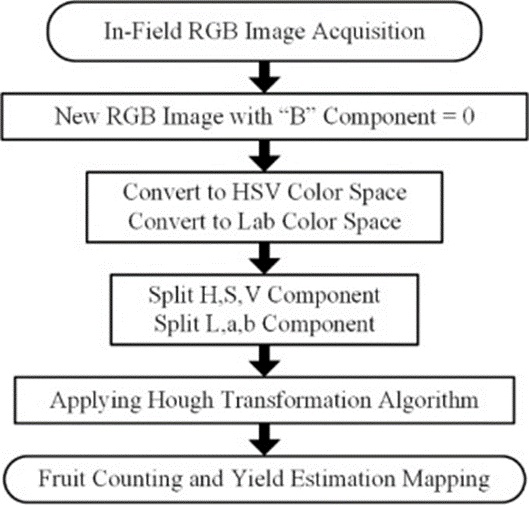
Figure 1. Flowchart of the image processing algorithm.
Securing an enhanced fruit detection rate requires judicious selection of a color space for color image segmentation. A pronounced contrast appears among the gray levels of various color components when an identical image is processed in different color spaces. Segmenting fruit becomes simpler once the gray-level disparity between the target and background becomes more pronounced. Pinpointing a color component that can demarcate the target from the natural background is therefore essential. RGB, HSV, and CIE Lab (lightness, green-red, and blue-yellow, abbreviated as Lab going forward) are among the color spaces commonly used in image processing. The best-known color space is based on red (R), green (G), and blue (B), the trio of additive primaries that constitute the RGB color space. That said, the three components in RGB space exhibit strong mutual correlation. Consequently, no single RGB component is well suited to segmentation; in the present study, citrus fruit images are transformed to the HSV and Lab color spaces to pinpoint the component or component blend best suited to distinguishing the fruit from the background.
The pigmentation of mature citrus fruit ranges from yellow to orange, depending on the variety, setting the fruit color apart from the background hue. Accordingly, color-feature segmentation approaches are broadly employed. Given that pictures were taken under natural conditions, image segmentation is vulnerable to changes in external illumination. Hence, an image segmentation algorithm anchored in both color and shape was chosen for the image processing workflow.
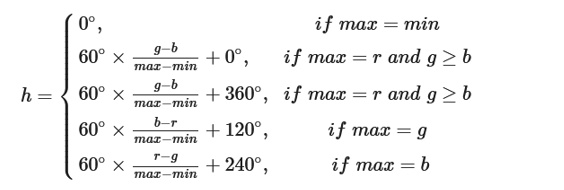
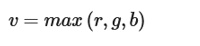
Color vision can be treated using either the RGB or HSV color spaces. The RGB color space represents colors by the amounts of R, G, and B present. HSV color space portrays colors through hue, saturation, and value. By default, a digital camera yields an RGB image in which the intensities of R, G, and B serve as compositional colors laid out on a Cartesian coordinate system. Given its capacity to disentangle color components from intensity, thereby softening the influence of illumination variation and removing shadows, the HSV color space provides a means of isolating color from intensity. The RGB-to-HSV conversion is supplied in Eqs. 1, 2, and 3 [32].
 (1)
(1)
 (2)
(2)
 (3)
(3)
Where r, g, and b signify the coordinates for red, green, and blue, each holding a real number bounded by 0 and 1. ‘max’ matches the largest of r, g, and b; ‘min’ matches the smallest among them. Moreover, h, s, and v denote the coordinates for hue, saturation, and value; h∈[0,360) denotes the hue angle span, and s,v∈[0,1] denote the saturation and value spans. In line with Eqs. 1-3, the proposed algorithm performs RGB-to-HSV image conversion using the MATLAB Image Processing Toolbox.
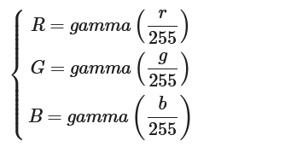
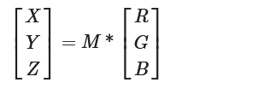
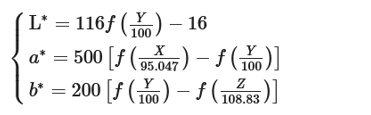
A Lab color space encompasses the entire range of colors discernible by human vision and serves as a device-independent reference model. Within the Lab color space, L denotes pixel lightness on a continuum from 0 to 100, running from absolute black to absolute white; a denotes placement along the red-magenta to green axis, where values span between 127 and -128; and b denotes placement along the blue to yellow axis, where values span between 127 and -128. Because the conversion exhibits non-linear behavior, a direct shift into Lab color space is unworkable; the image first undergoes conversion to XYZ color space, which assumes three primary colors (X, Y, and Z), after which XYZ is transformed into Lab. The transition expression accordingly splits into two parts [33].
1) Conversion of the RGB color space to the XYZ color space:
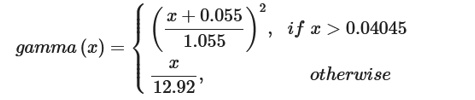
The variables r, g, and b correspond to the trio of distinct components per pixel, with values ranging from 0 to 255. The conversion equations are consequently presented as shown in Eqs. 4-7 [34, 35].
 (4)
(4)
 (5)
(5)
 (6)
(6)
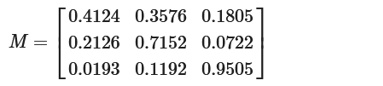 (7)
(7)
2) Conversion of XYZ color space to Lab color space:
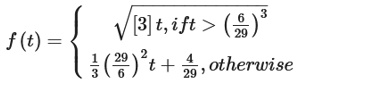
L, a, and b represent the terminal values of the three channels inside the Lab color space. The shift from XYZ color space to Lab color space is accomplished through Eqs. 8 and 9 [36, 37].
 (8)
(8)
 (9)
(9)
Drawing upon the picture produced once the original is shifted into HSV color space and Lab color space, one can determine which standalone component or blend of components—drawn from R, G, and B; H, S, and V; and L, a, and b—delivers the most fitting image and designate it or them for the subsequent step.
After separating the fruit from the background via image processing, the next step is to detect and enumerate the fruit. Bearing in mind that citrus fruit ordinarily assumes a rounded contour, the circle Hough transform (CHT) [38, 39] is brought to bear in pinpointing circles from objects inside the processed images.
The CHT is a foundational tool in digital image processing for detecting circular objects and is a specialized offshoot of the Hough transform. Its purpose is to locate circles in flawed image inputs. The CHT maps a circle residing in two-dimensional image space into a solitary point inside a three-dimensional parameter space governed by the radius and the center’s horizontal and vertical coordinates. Hence, a circle fixed by any trio of points lying on its circumference should correlate to a point within the three-dimensional parameter space once the Hough transformation is applied.
In the MATLAB software environment, “[centers, radii, metric] = imfindcircles (___, Name, Value)” serves as a purpose-built function for the CHT that yields a column vector termed “metric,” capturing the accumulator array peak magnitudes belonging to each circle (sequenced from largest to smallest). Within the imfindcircles function, the parameters “Sensitivity” and “EdgeThreshold” carry particularly critical weight. Boosting the sensitivity setting allows imfindcircles to detect more circular objects, including faint and partially blocked circles. Elevated sensitivity settings likewise amplify the odds of spurious detections. The edge gradient threshold fixes the gradient cutoff for designating edge pixels within the image, supplied as the comma-separated pair “EdgeThreshold” and a nonnegative scalar in the interval [0,1]. A lower threshold value leads to the detection of additional circular objects (with both weak and strong edges). As the threshold figure rises, imfindcircles picks up fewer circles with weak edges.
The gap between the camera and the target object profoundly shapes both the object’s apparent size and the features that remain distinguishable within the captured frame [40]. Moving the camera nearer to the fruit tree magnifies the fruit’s dimensions in the image. On the flip side, pulling the camera further back shrinks the fruit’s appearance. To boost processing throughput, a uniform code is used to handle every picture. Within that program, the function imfindcircles(A, RADIUS_RANGE) demands that the lower and upper thresholds of RADIUS_RANGE be specified. Drawing on standard citrus fruit measurements, the RADIUS_RANGE parameter bracket is fixed at [8 20], while sensitivity stays locked at 0.93. The central program snippet is as follows:
[centersBright,radiiBright,metricBright]=imfindcircles(rgb,[820], ...’ ObjectPolarity’, ‘bright’, ‘Sensitivity’,0.93, ‘EdgeThreshold’,0.1).
To pinpoint the capture distance between the camera and the tree canopy at which fruit can be spotted when its image size falls within [8-20], a pilot run was conducted under controlled conditions. The procedure played out as follows: the camera started at a distance of 0.3 m from the target fruit and stepped backward in 0.3 m increments, totaling 10 shots; this yielded 10 consecutive pictures of the target fruit at distances ranging from 0.3 m to 3 m. The detection results are presented in Table 1, derived from image processing using the fixed MATLAB routine.
Table 1. Result of fruit count by human and computer at different distances
Distance (m) | 3.0 | 2.7 | 2.4 | 2.1 | 1.8 | 1.5 | 1.2 | 0.9 | 0.6 | 0.3 |
Fruit count by human | 62 | 55 | 55 | 55 | 48 | 40 | 32 | 26 | 22 | 22 |
Fruit count by computer | 35 | 38 | 42 | 51 | 45 | 36 | 25 | 18 | 15 | 13 |
Detection accuracy rate (%) | 56.5 | 69.1 | 76 | 92.7 | 91.4 | 90 | 78 | 69.2 | 68.2 | 59.1 |
Eq. 10 provides the formula for the detection accuracy rate [41].
 (10)
(10)
Organizing the data housed in Table 1 reveals the relationship between distance and recognition accuracy, as plotted in Figure 2.
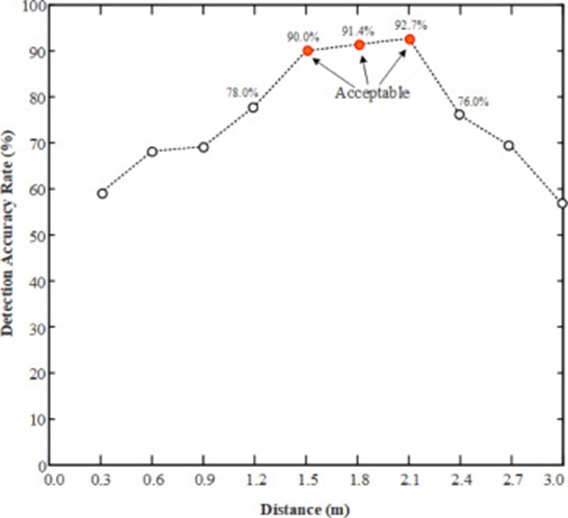
Figure 2. Relationship between distance from the camera to fruit and detection accuracy rate.
Figure 2 makes clear that distance is a decisive variable governing both detection accuracy and the number of correctly identified items. Fruit detection accuracy reached 90%, 91.4%, and 92.7% at distances of 1.5 m, 1.8 m, and 2.1 m, respectively. The peak number of correctly identified fruit materialized at a distance of 2.1 m. Accuracy dropped below 80% whenever the distance shrank under 1.5 m or stretched past 2.1 m.
The tree imagery fueling this experiment originated from Shiraz Ranch in Newman, California. A set of 66 fruit trees, with diverse row and plant spacing, was selected for measurement. These 66 trees sat within the same row spanning latitude: 37°20′42.6″ N, longitude: 121°06′48.4″ W; to latitude: 37°20′53.5″ N, longitude: 121°06′51.3″ W, a choice made to streamline access and maintain a steadier, more precise camera-to-object distance throughout the entire experiment while reducing error. The average row spacing across the fruit trees equaled 5.46 m, and the average plant spacing equaled 4.5 m. Both flanks (east and west) of the 66 fruit trees were photographed, yielding a batch of 132 images destined for the image processing pipeline. Echoing the earlier discussion, pictures snapped between 1.5 m and 2.1 m boasted the highest accuracy rate. Given that the camera might eventually sit aboard an autonomous robotic platform, 2.1 m emerges as a practical camera-to-tree distance. Disparities in canopy architecture and per-tree fruit load across the two sides of each tree furnished an adequate range of varied samples for this experiment. For each side, a sequence of 10 images per tree was captured at spacings ranging from 0.3 to 3 m, stepping by 0.3 m. The fruit visible in each captured image was manually enumerated by a human observer. Those tallies were then stacked against the counts produced by the machine running the newly introduced rapid image processing technique against a natural backdrop. Linear least-squares regression was applied to tease out and contrast the fruit-counting results obtained by the human eye versus the machine on both flanks of the trees. Figure 3 sketches the layout of the tree-image collection arrangement.
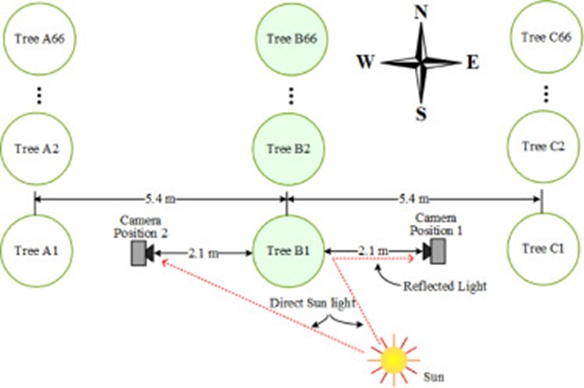
Figure 3. The top view of the configuration of the experiment.
The pair of images shown in Figure 4 serves as representative specimens of high- and low-yield citrus trees, roughly 10 days before harvest.
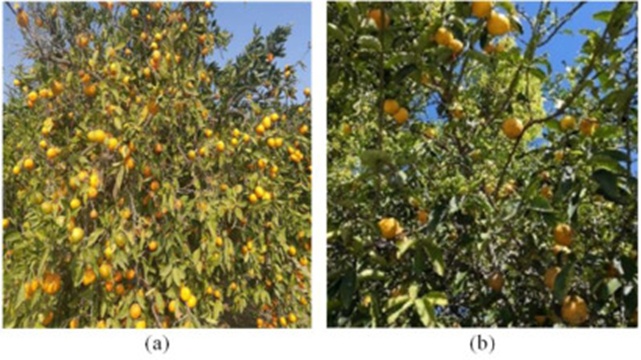
Figure 4. (a) High and (b) low fruit density citrus trees.
In digital image processing, segmenting the feature of interest is the most complex and formidable stage. That difficulty compounds when image capture takes place under uncontrolled, non-standardized conditions [22]. The field-taken pictures contained a wide expanse of background that needed to be stripped away before fruit recognition and counting could commence. This background blended leaves, sky, and branches. Given that natural illumination shifted with the sun’s intensity over the course of the day, the section that follows delves into which color space proves suitable for erasing this background.
The image in Figure 4a lays bare a backdrop woven from blue sky, green leaves, and branches. Before the original RGB image is converted to the “HSV” and “Lab” color spaces, it is first transformed into a new RGB image in which the “B” channel is set to zero. The logic here is that a blue backdrop normally can originate only from the sky. Following that, the RGB image was mapped into HSV and Lab color spaces, and nine individual components (R, G, B, H, S, V, L, a, and b) were teased apart from each image, as laid out in Figure 5.
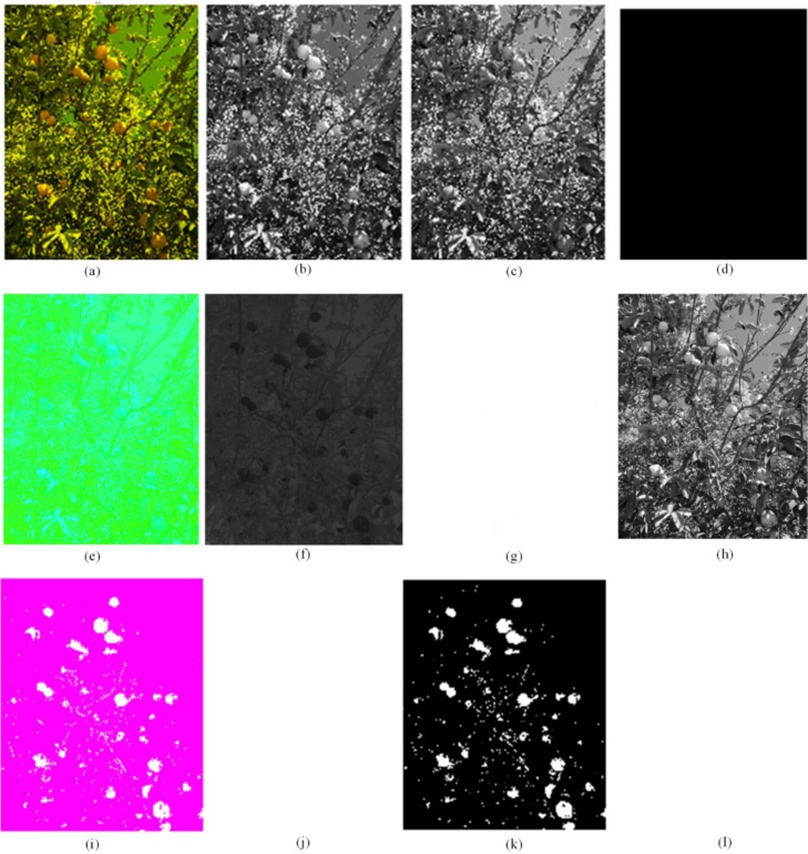
Figure 5. (a) RGB image with B=0, (b) “R” component, (c) “G” component, and (d) “B” component; (e) HSV image converted from original RGB image with B=0, (f) “H” component, (g) “S” components, and (h) “V” component; (i) Lab image converted from original RGB image with B=0, (j) “L” component, (k) “a” component, and (l) “b” component.
Pitting the RGB, HSV, and Lab renditions against one another allowed a judgment on which image lends itself best to automated machine detection, as summarized in Table 2.
Table 2. Process for comparing images for automatic detection across different color spaces.
Color space | Image | Can the human eye count? | Can the machine detect automatically? |
RGB |
| Yes | No |
HSV |
| No | No |
Lab |
| Yes | Yes |
Weighing the imagery from separate color spaces in Table 2 revealed that pictures rooted in the RGB and HSV color spaces resist straightforward machine removal. Only within Lab color space, by contrast, could the background be swept away completely—an action the machine could perform without friction. Lab color space was thus anointed the top choice for background elimination and mature fruit recognition. Observing that the L and b components registered blank in the Lab color space, the a component was singled out for detection and enumeration of mature citrus fruits.
A characteristic image of the specimen snapped during the experiment is shown in Figure 6a. This photo was taken of a citrus tree at 11:05 am on November 21, 2018, with the camera positioned 2.1 m from the tree and set to a high resolution of 4032×3024 pixels. The frame captured virtually every surface of the fruit on the tree’s eastern face (camera stationed in position 1). The scene packs together a multitude of fruit features and a tangled backdrop of sky, soil, and thick branches. One can spot instances of overlapping fruit, fruit partially veiled by foliage, and fruit that registers smaller than the surface specimens, tucked deeper inside the canopy. The result displayed in Figure 6b was obtained by isolating the a component in Lab color space, applying the CHT technique, and restricting the image processing circle radius to [8-20]. This chosen radius band emerged from hands-on experimentation, which verified that citrus can be reliably recognized within this span.
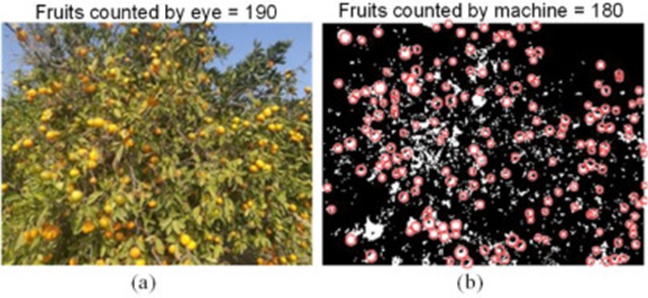
Figure 6. (a) An example of an original image at a distance of 2.1 m, and (b) Result of Citrus detection in a component by CHT image processing.
Using Eq. 10 as the foundation, the metrics for yield estimation accuracy and the false-positive detection proportion are formally expressed in Eqs. 11 and 12.
 (11)
(11)
 (12)
(12)
Within Figure 6a, the quantity of fruit a human observer could visually identify totalled 190, whereas the automated count yielded 180—corresponding to 12 omissions, 2 erroneous inclusions, and 178 correctly assigned identifications. Plugging these figures into Eqs. 11 and 12, the detection accuracy reached 93.7%, the yield estimation accuracy attained 94.7%, and the false-positive proportion settled at 1.1% for the image in Figure 6.
Extrapolating from the above calculation, the citrus identification outcomes produced by the enumeration algorithm across the 66 individual trees were obtained.
The mean identification accuracy was 91.7%, with a mean false-positive proportion of 1.7%. The runtime was recorded throughout the execution of the algorithm for each input image. The maximum processing time was 2.49 s, while the minimum was 0.76 s, with an average processing time of 1.1 s across all 66 images
Accuracy percentages ranged from a floor of 50% to a ceiling of 100% across the full collection of input images. The mean absolute deviation landed at 91.7% across all inputs. The dominant contributors to these deviations were near-total obstruction, signal noise, shadow casting, and solar reflectance from leaf surfaces. The algorithm managed to pinpoint and enumerate across this image set once background interference had been stripped out. A linear least-squares regression was conducted to place machine-generated citrus tallies side by side with those derived from human visual inspection, with the comparative outcomes depicted in Figure 7. Across both camera viewpoints, R² came in at 0.98.
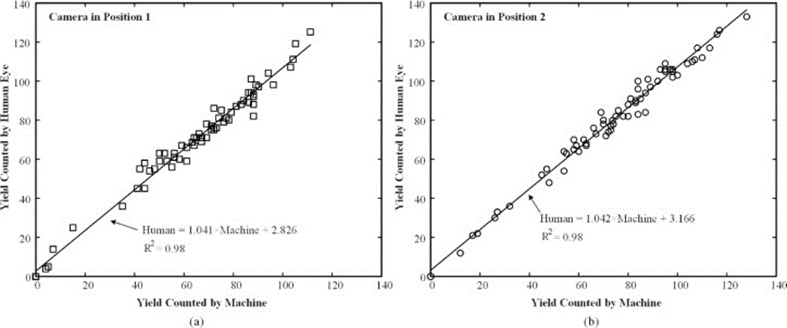
Figure 7. Linear least-squares analysis result of the yield counted by the machine vs. the yield counted by the human eye for all input images where the camera was installed in (a) position 1 and (b) position 2.
The magnitude of ambient light exerts substantial leverage over the output of processed imagery. To investigate the algorithm’s resilience, a pair of images was run through the pipeline under markedly different brightness conditions to locate citrus fruit via the introduced technique. The source photographs contained overlapping fruit and were partially obscured by foliage on both the eastern and western aspects. Illuminance readings adjacent to the fruit hit 27,300 lux in Figure 8a, yet dropped to only 6,700 lux in Figure 8b—a dramatic contrast. The fruit identification and enumeration outputs are presented in Figure 8c and Figure 8d.
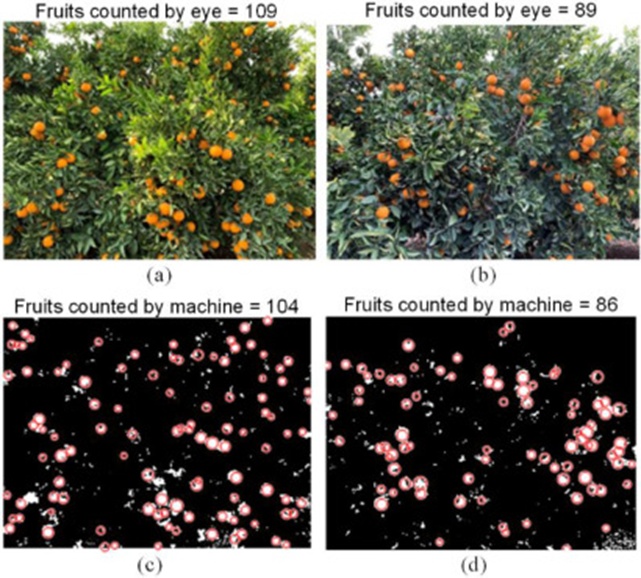
Figure 8. View of (a) the east side of the tree with light illumination of 27,300 lux near leaves and (b) the west side of the tree with light illumination of 6,700 lux near leaves; and the number of counted fruits by using “a” components of the captured image from the (c) East and (d) West sides of the tree.
A detailed breakdown of the detection performance is presented in Table 3.
Table 3. Recognition result analysis.
Figure | False-positive rate (%) | Yield estimation accuracy (%) | Recognition accuracy (%) | False-positive number | Missed number | Fruit count by human | Fruit count by computer | Light illuminance (lux) |
8a | 1.83 | 95.41 | 93.58 | 2 | 7 | 109 | 104 | 27300 |
8b | 2.25 | 96.63 | 94.38 | 2 | 5 | 89 | 86 | 6700 |
An additional observation from Table 3 is that the mean illuminance on the eastern face worked out to 128.2, in contrast to 85.33 on the western face. Despite the eastern side receiving considerably stronger illumination than its western counterpart, the yield identification rate for the eastern orientation equalled 91.92%, whereas the same metric for the western orientation reached 91.5%. This outcome points to the two sides of the tree yielding nearly equivalent identification rates through this algorithm. The most widespread causes of missed fruit identifications broke down as follows:
1) Foliage acted as a screen, hiding fruits from view
2) Fruits were amassed in tight bunches
3) Fruit dimensions appeared diminished as a consequence of being embedded deeper inside the canopy structure.
The upshot, therefore, is that lighting magnitude carries comparatively modest weight in shaping identification accuracy when a channel of the Lab color space is utilized, and that this algorithmic approach can simultaneously strengthen robustness within the image processing pipeline.
This segment compares the current approach with findings from prior research on algorithmic methodology, precision level, R², and average runtime, all collated in Table 4.
Table 4. Comparison of different detection algorithms.
Reference | Algorithm | Average elapsed time (s) | R² | Accuracy (%) |
Annamalai et al. [42] | Utilized hue and saturation channels along with color-plane analysis and histogram-based information to separate fruit from background and foliage | 0.12 | 0.79 | – |
Chinchuluun and Lee [30] | Applied illumination correction, noise filtering, color-based segmentation, morphological processing, and blob separation techniques | – | 0.79 | – |
Chinchuluun et al. [43] | Used Bayesian classification combined with morphological operations and watershed-based segmentation | – | 0.89 | – |
Çakır et al. [44] | Employed color histogram features together with shape-based analysis | – | – | 76.5 |
Thendral et al. [45] | Implemented discrete wavelet transform, RGB-to-YIQ conversion, and used the ‘I’ channel for segmentation | 2.94 | – | 93 |
Malik et al. [46] | Performed shadow reduction, object separation, k-means clustering, orange extraction, blob detection, and fruit counting | – | 0.94–0.99 | 91.3 |
Dorj et al. [15] | Converted RGB images to HSV, followed by thresholding, orange detection, noise removal, watershed segmentation, and counting | – | 0.93 | – |
This work | Converted RGB images to the LAB color space using the ‘a’ channel and applied the circular Hough transform for counting | 1.12 | 0.98 | 91.8 |
Drawing on the comparative summary in Table 4, the technique advanced in the present paper yielded a measurably higher detection accuracy and an elevated R² value for mature fruit.
The spatial arrangement of identified citrus fruits was plotted via MATLAB software and superimposed on the orchard footprint map, as depicted in Figure 9. It deserves mention that the tree specimens utilized in this trial were situated on an elevated parcel of the orchard featuring non-uniform topography. The data make it evident that the higher yields emanated from the lower reaches of the incline, where trees benefited from copious irrigation inflow. In comparison, sparser yields came from trees stationed along the ridge top, which received less moisture than those at lower elevations. One could also clearly observe that the trees rooted in the lower zone had developed larger physical stature relative to those occupying the hill summit, which remained comparatively undersized.
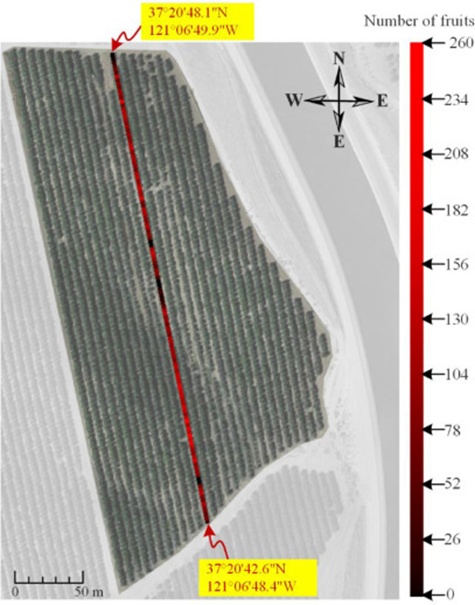
Figure 9. Result of estimated yield mapping after image processing using Lab color space.
An original algorithm was engineered for citrus fruit detection and enumeration. Orchard yield quantities were derived using image-processing workflows. The resulting output was subsequently evaluated against manual human visual tallies conducted under natural illumination. An R² value of 0.98 emerged from the linear regression aligning the citrus counting algorithm with counts obtained through direct human observation spanning 66 sampled trees. Beyond that, an accuracy of 91.8% was achieved, and the mean image-processing runtime was 1.1 s. The investigation established that combining a Lab color-space–based image processing strategy with the Hough circle transform can effectively discriminate citrus fruit within a natural outdoor scene. This method’s strengths center on a rapid recognition cycle and reliable resilience against both lighting variability and fruit concealment caused by leaves, limbs, and adjacent fruit.
This research is co-supported by the Guangdong Innovation Project in Colleges and Universities with Research Grant 2019KTSCX064 and the Guangzhou Rural Science and Technology Commissioner Project with Research Grant GZKTP202003, and also thanks the China Scholarship Council Fund. The authors wish to thank Dr. Barat Bisabri, Dr. Fuxi Shi, Dr. Shanjun Li, and Dr. Weiguo Lin for assisting with field image acquisition.
None
None
None
Open Access The author(s) retain copyright. This article is licensed under the Creative Commons Attribution-NonCommercial-ShareAlike 4.0 International License. It may be shared and adapted for non-commercial purposes with appropriate attribution, an indication of changes, and distribution of adaptations under the same license. Third-party material may be subject to separate terms identified in its credit line. View the license at https://creativecommons.org/licenses/by-nc-sa/4.0/.
 Agro Intelligence Research Press