Precision farming increasingly depends on diverse agricultural data sources, yet these sources are often discussed as isolated technologies rather than as complementary inputs within decision-support systems. This article develops a conceptual taxonomy of agricultural data sources for precision farming by classifying remote sensing, geospatial layers, IoT sensors, machinery-generated records, climate and weather data, soil data, environmental observations, farm-management records, and farmer knowledge. The taxonomy approach is literature-grounded and organized around data-generation mechanism, spatial and temporal scale, resolution, format, uncertainty, interoperability requirements, ownership concerns, farmer usability, decision-support relevance, and analytics readiness. Rather than treating data as automatically useful, the article argues that each source family has distinct strengths, limitations, validation needs, and practical conditions of use. Remote sensing can support spatial monitoring, IoT sensors can provide high-frequency observations, machinery records can document operational activity, climate and soil data can contextualize crop response, and farmer knowledge can support interpretation, feasibility assessment, and local validation. The contribution is an original data-source taxonomy that helps researchers, advisors, farmers, and technology developers evaluate how agricultural data sources can be combined responsibly for precision farming. The taxonomy supports more coherent data integration, more transparent AI-ready agricultural systems, and more farmer-centered decision support.
Precision farming has become increasingly data-intensive as farms, advisors, researchers, and technology providers work with heterogeneous streams of agronomic, spatial, operational, environmental, and managerial information. The precision farming literature shows that agricultural big data is not a single object but an ecosystem of multiple data types, infrastructures, analytical methods, and users, ranging from sensor streams and imagery to farm records and platform-mediated decision outputs [1, 2]. This diversity creates opportunities for more targeted crop monitoring, input management, risk assessment, and advisory support, but it also creates conceptual and practical problems when data sources are treated as interchangeable.
The need for a taxonomy arises because precision farming decision support depends not only on the presence of data but also on the suitability of specific data sources for specific decisions. Machine-learning applications in agriculture illustrate this issue clearly: the usefulness of an algorithm depends on data quality, feature relevance, spatial and temporal representativeness, and the relationship between input variables and decision objectives [3]. A data-source taxonomy therefore needs to classify agricultural data by how it is generated, what it represents, how frequently it is updated, how uncertainty enters the dataset, and how the data can be converted into actionable farm knowledge.
Agricultural data systems are also socio-technical systems rather than purely technical infrastructures. Digital agriculture scholarship emphasizes that smart farming involves farmers, advisors, institutions, commercial platforms, advisory networks, governance arrangements, and shifting forms of expertise [4]. A taxonomy that includes only remote sensing, sensors, and machinery data would therefore be incomplete because it would overlook farm-management context, farmer knowledge, ownership concerns, advisory interpretation, and the practical conditions under which data becomes usable.
The aim of this article is to develop an original conceptual taxonomy of agricultural data sources for precision farming. The article classifies major agricultural data-source families according to scale, temporal frequency, resolution, data format, generation mechanism, decision relevance, uncertainty, interoperability, ownership, farmer usability, and integration potential. The central argument is that precision farming requires integration among technical data streams, environmental context, operational records, and human knowledge, rather than a simple accumulation of digital observations.
Agricultural data sources form the foundation of precision farming because they shape what can be observed, interpreted, modeled, and acted upon. Digital agriculture can support more sustainable agricultural systems when data is connected to agronomic decision-making, resource-use efficiency, and system-level interpretation rather than being valued only for its technological novelty [5]. This means that data sources should be evaluated by their contribution to field diagnosis, input optimization, yield interpretation, risk management, sustainability assessment, and farmer decision confidence.
However, agricultural data sources differ substantially in scale, format, resolution, reliability, and usability. Crop data management scholarship shows that precision farming workflows involve multiple stages, including data acquisition, storage, processing, interpretation, decision prescription, and variable-rate or advisory action [6]. A satellite image, a soil moisture sensor reading, a yield monitor record, a weather forecast, and a farmer’s field observation may all support precision farming, but they enter decision systems through different mechanisms and require different forms of cleaning, calibration, validation, and contextual interpretation.
A credible agricultural data taxonomy must also include ethical and practical dimensions. Smart farming development raises questions about who controls data, who benefits from data-driven systems, how risks are distributed, and whether technologies remain usable and meaningful for farmers and advisors [7]. For this reason, the taxonomy proposed in this article treats data ownership, privacy, interoperability, trust, and farmer usability as classification dimensions rather than external concerns.
The foundation of the taxonomy is therefore not a hierarchy in which one data source is assumed to be superior to another. Instead, the taxonomy is organized around complementarity. Remote sensing can provide spatial crop-status information, IoT sensors can provide high-frequency local measurements, machinery records can document operations, climate and soil data can explain crop responses, farm-management records can connect decisions to practices, and farmer knowledge can validate and contextualize recommendations. Data becomes decision-relevant when these sources are integrated carefully with attention to uncertainty, scale, practical feasibility, and governance.
Table 1 summarises the major agricultural data-source families that form the foundation of precision farming systems.
Table 1. Major Agricultural Data-Source Families in Precision Farming: Remote Sensing, Geospatial Layers, IoT Sensors, Machinery Records, Climate Data, Soil Data, Environmental Observations, Farm-Management Records, and Farmer Knowledge
Data-source family | Typical data examples | Generation mechanism | Spatial scale | Temporal frequency | Primary decision relevance | Key strength | Key limitation | Integration requirement |
Remote sensing data | Multispectral imagery, thermal imagery, vegetation indices, canopy reflectance | Satellite, UAV, aircraft, or proximal optical sensing | Field, within-field, regional, landscape | Revisit-based, campaign-based, or event-based | Crop monitoring, stress detection, biomass estimation, scouting prioritization | Broad spatial visibility and repeat observation | Cloud cover, calibration uncertainty, spectral interpretation limits | Georeferencing, atmospheric correction, ground validation, linkage to field boundaries |
Geospatial data | Field boundaries, topography, slope, elevation, management zones, soil maps | GIS layers, surveys, digital elevation models, spatial databases | Within-field to regional | Usually static or periodically updated | Zoning, traffic planning, erosion risk, variable-rate design | Provides spatial structure for integrating other data | Boundary errors, inconsistent projections, outdated layers | Coordinate standardization, metadata, spatial harmonization |
IoT sensor data | Soil moisture, soil temperature, canopy microclimate, water level, equipment status | Fixed or mobile sensors connected through wired or wireless networks | Point, plot, zone, facility, equipment | High-frequency, near-real-time, or scheduled logging | Irrigation, microclimate management, alerting, monitoring | High temporal resolution | Sensor drift, calibration need, connectivity problems, limited representativeness | Sensor metadata, calibration logs, network reliability, data-quality checks |
Machinery-generated data | Guidance logs, fuel use, implement status, seeding records, spray records, tillage logs | Tractor, harvester, implement, controller, and telematics systems | Pass, row, field, operation | Operation-based or continuous during field work | Operational efficiency, compliance records, input tracking, work planning | Direct record of field operations | Proprietary formats, fragmented platforms, missing metadata | Standardized machine data formats, implement metadata, platform interoperability |
Yield monitor data | Grain yield maps, crop mass flow, harvester location, harvest moisture | Harvester-mounted sensing and positioning systems | Within-field, pass, grid, management zone | Harvest-time operation-based | Yield variability analysis, zone evaluation, post-season diagnosis | Direct link to production outcomes | Calibration error, lag effects, edge effects, crop-specific limitations | Cleaning protocols, calibration records, spatial filtering, linkage to management history |
Variable-rate application data | Seeding rate, fertilizer rate, spray rate, irrigation rate, prescription maps | Controller logs, applicator systems, prescription software | Within-field, zone, pass | Operation-based | Input optimization, prescription evaluation, compliance documentation | Connects data interpretation to management action | May not capture actual delivered rate accurately without validation | Prescription–as-applied comparison, controller compatibility, timestamp synchronization |
Climate and weather data | Rainfall, temperature, humidity, evapotranspiration, wind, seasonal forecasts | Weather stations, gridded datasets, forecasting systems, climate services | Point, farm, regional, national | Hourly, daily, seasonal, or long-term | Planting, irrigation, disease risk, harvest timing, climate-risk planning | Essential temporal context for crop response | Forecast uncertainty, sparse station density, local mismatch | Bias correction, station metadata, forecast uncertainty communication |
Soil data | Texture, organic matter, pH, nutrients, salinity, compaction, soil moisture, biological indicators | Laboratory tests, field sampling, proximal sensing, soil sensors, digital soil mapping | Point, zone, field, landscape | Static, seasonal, campaign-based, or continuous for sensors | Fertility, irrigation, trafficability, soil health, yield interpretation | Explains important constraints on crop response | Spatial heterogeneity, sampling error, method differences | Sampling design, laboratory metadata, sensor calibration, spatial interpolation |
Environmental observations | Pest pressure, disease presence, weed distribution, waterlogging, erosion, biodiversity indicators | Field scouting, sensors, remote observations, advisory reports | Point, patch, field, landscape | Event-based, seasonal, or monitoring-based | Risk management, crop protection, sustainability assessment | Connects crop management to external pressures | Often episodic, qualitative, or difficult to standardize | Observation protocols, location tagging, integration with weather and field history |
Farm-management records | Crop rotation, planting dates, input purchases, irrigation events, labor logs, machinery availability | Farmer records, farm-management information systems, advisory platforms | Farm, enterprise, field, operation | Event-based, seasonal, annual | Planning, compliance, cost analysis, decision traceability | Connects data to actual management decisions | Incomplete records, inconsistent formats, manual-entry burden | Common data models, record-cleaning routines, linkage to spatial and temporal data |
Farmer knowledge | Field history, local pest patterns, practical constraints, experiential observations, risk preferences | Experiential learning, observation, advisory interaction, local practice | Field, farm, community, landscape | Continuous, seasonal, historical, event-based | Interpretation, feasibility assessment, validation, trust-building | Provides context unavailable in automated data streams | Difficult to formalize, digitize, and standardize | Participatory design, structured elicitation, advisory translation, feedback loops |
Remote sensing and geospatial data occupy a central position in precision farming because they provide spatially explicit representations of crop and field conditions. Agricultural remote sensing can support crop monitoring, vegetation assessment, stress detection, and field-scale interpretation, while thermal remote sensing can contribute to water-status and stress-related decision contexts when its biophysical meaning is carefully interpreted [8, 9]. These data are especially valuable when field variability cannot be captured adequately through sparse point measurements alone.
Satellite imagery is particularly useful for broad and repeated monitoring, but its value depends on revisit frequency, spatial resolution, spectral characteristics, atmospheric correction, and the relationship between image timing and the target decision. Cloud cover, sensor saturation, mixed pixels, and uncertainty in vegetation-index interpretation can limit decision usefulness, especially where management decisions require fine spatial detail or rapid intervention. For this reason, satellite data should be classified not only as imagery but also by temporal availability, spectral content, resolution, preprocessing requirement, and compatibility with field boundaries.
UAV imagery forms a distinct remote sensing family because it can provide very high spatial resolution and flexible acquisition timing, but it introduces its own workflow and quality-control requirements. UAV-based precision agriculture applications require attention to flight planning, image overlap, radiometric correction, georeferencing, mosaicking, sensor payload, and data-processing procedures [10]. Unlike satellite data, UAV data can be collected at farmer- or advisor-selected times, but this flexibility is accompanied by operational costs, regulatory constraints, processing complexity, and the need for technical expertise.
Geospatial layers such as field boundaries, topography, elevation, slope, soil maps, drainage patterns, and management zones provide the spatial framework into which imagery, sensor data, machinery records, and farmer observations can be integrated. UAV systems can be valuable for precision agriculture, but their usefulness depends on calibration, interpretation, and practical feasibility rather than spatial resolution alone [11]. A taxonomy of agricultural data sources should therefore distinguish between raw imagery, derived geospatial products, interpreted agronomic indicators, and decision-ready spatial layers.
IoT sensor data support precision farming by enabling frequent or near-real-time observation of soil, crop, equipment, livestock, water, and microclimatic conditions. IoT applications in agriculture can connect field sensors, communication systems, data platforms, and decision tools, but implementation depends on connectivity, system architecture, sensor maintenance, energy supply, and usable data interfaces [12]. This makes IoT data different from remote sensing data: IoT observations are often temporally dense and locally specific, but their spatial representativeness may be limited.
Wireless sensor networks illustrate the technical dependencies that shape sensor-generated data quality. Energy efficiency, communication reliability, node placement, signal range, and network design influence whether field sensors can provide consistent observations for irrigation, microclimate monitoring, or environmental alerting [13]. A soil moisture sensor that logs frequent readings is not automatically decision-ready unless the sensor is calibrated, the installation depth is agronomically meaningful, the data stream is checked for gaps or drift, and the readings are interpreted in relation to soil type and crop growth stage.
In arable farming, IoT systems are embedded within complex operational environments involving mobile machinery, variable field conditions, multiple platforms, and changing management tasks. IoT implementation in arable systems requires integration across devices, field operations, management information systems, and decision processes, while also addressing interoperability and farmer-facing usability [14]. Sensor-generated data should therefore be classified by the object observed, sensing mechanism, temporal frequency, communication pathway, maintenance requirement, spatial representativeness, and decision domain.
Machinery-generated data and yield data extend precision farming from observation to operational traceability. Yield sensing technologies can support yield mapping and post-season diagnosis, but their usefulness depends on crop type, sensing method, calibration, data cleaning, and spatial interpretation [15]. Similarly, variable-rate application records, guidance logs, machinery telemetry, and as-applied maps can document what was done in the field, but these records may be fragmented across proprietary platforms and may require standardization before they can be integrated with imagery, soil data, weather data, or farmer knowledge.
Climate and weather data are essential for interpreting crop conditions because many precision farming decisions depend on temporal risk, seasonal variability, and short-term operational windows. Climate services scholarship shows that agricultural decision-making requires weather and climate information to be matched to the timing, uncertainty, and decision context of users rather than delivered as generic forecasts [16]. In a precision farming taxonomy, this means that hourly weather observations, daily forecasts, seasonal climate outlooks, and long-term climate indicators should be classified separately because they support different decisions, including irrigation scheduling, disease-risk assessment, planting timing, harvest planning, and climate-risk adaptation.
Soil moisture, soil temperature, and related field measurements provide important links between environmental conditions and crop response. Low-cost soil water-content sensors can provide useful observations for irrigation and water-management decisions, but their effective use depends on calibration, sensor type, installation conditions, and interpretation of measurement error [17]. Soil sensor data should therefore be classified by sensing depth, soil type, calibration status, sampling location, communication reliability, and agronomic decision relevance rather than treated as universally representative of field conditions.
Soil data also include physical, chemical, and biological indicators that cannot be reduced to a single fertility value. Soil quality assessment depends on indicators such as texture, organic matter, structure, nutrient status, pH, biological activity, and soil-function relationships, and these indicators require interpretation in relation to management objectives and environmental constraints [18]. Within the proposed taxonomy, soil physical data, soil chemical data, and soil biological data are treated as related but distinct source families because they differ in measurement method, temporal stability, sampling density, uncertainty, and relevance to crop production, soil health, and sustainability assessment.
Environmental data extend the interpretation of crop and soil status by incorporating pest pressure, disease risk, weed distribution, salinity, compaction, waterlogging, erosion, and landscape-level conditions. Soil analytics and machine-learning applications can support data-driven interpretation, but they also depend on sampling density, data quality, model assumptions, and the representativeness of training information [19]. For this reason, climate, soil, and environmental data should be classified not only by measured variable but also by uncertainty source, calibration need, spatial density, temporal stability, and suitability for integration with remote sensing, IoT, machinery records, and farmer observations.
Table 2 compares technical and agronomic quality dimensions across remote sensing, IoT, machinery, climate, soil, environmental, and farmer-generated data sources.
Table 2. Technical and Agronomic Quality Dimensions of Agricultural Data Sources for Precision Farming: Resolution, Frequency, Accuracy, Calibration, Representativeness, Uncertainty, Interoperability, Ownership, and Decision-Readiness
Data-source category | Resolution or granularity | Update frequency | Main uncertainty source | Calibration or validation need | Interoperability challenge | Ownership or governance concern | Decision-support readiness | Recommended quality-control action |
Remote sensing data | Pixel, field, management zone, landscape | Revisit-based or campaign-based | Cloud cover, atmospheric effects, mixed pixels, spectral ambiguity | Atmospheric correction, radiometric calibration, ground validation | Different sensors, projections, formats, and vegetation-index conventions | Platform access, derived-product ownership, service-provider control | Moderate to high when corrected and linked to agronomic context | Validate imagery with field observations and document preprocessing steps |
UAV imagery | Centimeter-scale imagery, plot, row, canopy | User-scheduled or campaign-based | Flight conditions, mosaicking error, sensor calibration, illumination variation | Radiometric panels, ground control, image-quality checks | Large files, proprietary processing workflows, inconsistent metadata | Operator control, data storage, privacy over farm imagery | High for scouting and mapping when processing is rigorous | Standardize flight plans, metadata, and image-processing protocols |
Geospatial layers | Boundary, polygon, raster, elevation surface, management zone | Static or periodically updated | Boundary errors, outdated maps, projection mismatch | Boundary verification, coordinate-system checks | Spatial reference mismatch and inconsistent layer structure | Control over farm boundary and land-use data | High when used as spatial framework for integration | Maintain versioned geospatial layers and harmonized coordinate systems |
IoT sensor data | Point, depth-specific, node-specific, facility-specific | High-frequency, scheduled, or near-real-time | Sensor drift, placement bias, connectivity gaps, battery failure | Sensor calibration, installation checks, maintenance logs | Device protocols, data-stream formats, missing metadata | Platform dependency, continuous monitoring visibility | High for alerts and monitoring when calibrated | Use automated anomaly detection and periodic field validation |
Machinery-generated data | Pass, row, implement, operation, field | Continuous during operation or event-based | GPS error, implement lag, controller mismatch, missing metadata | Controller checks, equipment calibration, operation-log validation | Proprietary machinery formats and fragmented platforms | Manufacturer control, platform lock-in, data access rights | Moderate to high when cleaned and linked to field context | Compare planned, applied, and recorded operations |
Yield data | Pass, grid, crop unit, management zone, field | Harvest operation-based | Flow delay, moisture correction, edge effects, crop-specific sensor limits | Yield monitor calibration and post-harvest data cleaning | Inconsistent yield-map formats and harvester-platform differences | Ownership of production records and sharing with service providers | High for retrospective diagnosis when cleaned | Remove outliers, correct lag, and document calibration procedures |
Climate and weather data | Station point, gridded cell, farm region, forecast zone | Hourly, daily, seasonal, or long-term | Forecast uncertainty, sparse station density, local mismatch | Station maintenance, bias correction, forecast verification | Different time steps, data formats, and forecast products | Access to commercial forecast services and data reuse terms | High for risk management when uncertainty is communicated | Match forecast horizon to decision type and communicate uncertainty |
Soil data | Sample point, depth interval, zone, field, digital map unit | Static, seasonal, campaign-based, or continuous for sensors | Sampling error, laboratory method differences, soil heterogeneity | Sampling design, laboratory method documentation, sensor calibration | Different units, depths, test methods, and spatial interpolation approaches | Ownership of soil fertility and land-quality data | High when sampled and interpreted by decision domain | Document sampling depth, laboratory method, and spatial interpolation assumptions |
Environmental observations | Point, patch, field, landscape, advisory zone | Event-based, seasonal, or monitoring-based | Observer variability, episodic occurrence, inconsistent reporting | Protocol-based scouting, cross-checking with weather or imagery | Qualitative formats, inconsistent terminology, weak location tagging | Sharing of pest, disease, or environmental-risk information | Moderate; high when structured and georeferenced | Use structured observation forms and location-specific records |
Farmer-generated contextual data | Field history, constraint, preference, observation, advisory note | Continuous, historical, seasonal, or event-based | Recall bias, informal format, difficult standardization | Participatory validation, triangulation with records and observations | Conversion of tacit knowledge into structured decision inputs | Trust, transparency, benefit sharing, and control over knowledge use | High for feasibility and interpretation when respectfully integrated | Use structured elicitation, feedback loops, and farmer review of recommendations |
Farmer knowledge is a necessary data source in precision farming because it provides contextual information that automated systems often cannot observe directly. People-centered Agriculture 4.0 scholarship argues that digital agriculture must work for people, production, and the planet, while agricultural knowledge research shows that digitalisation changes but does not eliminate the importance of knowledge exchange, advisory interpretation, and experiential expertise [20, 21]. A taxonomy of agricultural data sources should therefore include farmer knowledge, advisory knowledge, and extension knowledge alongside technical data streams.
Farmer knowledge includes field history, past crop performance, local pest and disease patterns, drainage problems, soil behavior during wet or dry periods, equipment constraints, labor availability, input-access limitations, and risk preferences. Farmer engagement with precision agriculture technologies is shaped by material practice, knowledge, and the practical meaning of data within everyday farm work [22]. This means that farmer knowledge should not be treated as inferior to sensor or imagery data; rather, it should be understood as a contextual data source that helps determine whether a recommendation is feasible, timely, trustworthy, and locally meaningful.
The difficulty is that farmer knowledge is often tacit, narrative, experiential, and situated. It may not fit neatly into standardized data tables, machine-readable ontologies, or platform dashboards. Trust, transparency, and benefit-sharing are central to whether farmers are willing to provide data and engage with smart-farming systems, especially when they are uncertain about how their data will be used or who will benefit from it [23]. The taxonomy therefore classifies farmer knowledge according to source, format, validation pathway, privacy sensitivity, usability, and role in decision interpretation.
Contextual data also includes advisory interpretation, extension knowledge, historical field experience, local observations, and constraints that shape the real-world implementation of precision farming. For example, an algorithmic irrigation recommendation may be technically plausible but practically unsuitable if water access, labor timing, equipment availability, or farmer risk tolerance is ignored. Farmer knowledge can help validate sensor readings, explain unexpected yield patterns, prioritize scouting, refine management zones, and identify when a data-driven recommendation conflicts with local experience. In this taxonomy, contextual data acts as both an input layer and a feedback mechanism for decision-support systems.
The proposed agricultural data taxonomy classifies data-source families according to their generation mechanism, scale, temporal frequency, resolution, format, uncertainty, interoperability needs, privacy concerns, farmer usability, and decision-support relevance. Agri-food digitalisation scholarship shows that farm-level technologies increasingly connect to wider data ecosystems involving supply chains, platforms, analytics, and digital infrastructures [24]. The taxonomy therefore treats agricultural data not as isolated observations but as linked inputs that move through quality assessment, integration, analytics, interpretation, and decision-support processes.
The first layer of the taxonomy is the data-source layer, which includes remote sensing, geospatial data, IoT sensors, machinery records, climate data, soil data, environmental observations, farm-management records, and farmer knowledge. Digital twin scholarship in smart farming illustrates why this layer must be connected to physical farm objects, real-time data streams, models, and decision functions rather than represented as a disconnected list of technologies [25]. This layer answers the question of where the data comes from and what kind of farm reality it claims to represent.
The second layer is the data-property layer, which classifies each source by spatial scale, temporal scale, resolution, data format, uncertainty, representativeness, and validation need. Agricultural systems scholarship on data, models, and knowledge products highlights the need to distinguish raw data from model-ready data, integrated datasets, model outputs, and decision-oriented knowledge products [26]. This distinction is crucial because a raw sensor reading, a processed vegetation index, a calibrated yield map, and a farmer-validated recommendation have different levels of decision readiness.
The third layer is the integration and analytics layer. Agricultural big-data research emphasizes that data value depends on characteristics such as variety, velocity, veracity, ownership, and analytical usefulness rather than volume alone [27]. In the taxonomy, integration requirements include metadata completeness, geospatial alignment, temporal synchronization, data cleaning, format standardization, uncertainty documentation, and compatibility with advisory or AI systems. Analytics readiness is therefore treated as a property that must be produced through validation and integration rather than assumed from data availability.
The fourth layer is the farmer-centered decision layer. Governance research shows that smart-farming data systems are shaped by risk perception, legitimacy, trust, transparency, and control over data use [28]. Legal and governance scholarship on farm data sharing further indicates that privacy, ownership, and data-access arrangements affect farmer willingness to share and use data within smart-farming systems [29]. The proposed taxonomy therefore classifies each data family by farmer usability, interpretability, ownership sensitivity, feedback capacity, and relevance to crop monitoring, input optimization, risk management, and farm decision support.
Table 3 presents the proposed agricultural data taxonomy for precision farming by linking data sources to decision functions, integration requirements, and farmer usability.
Table 3. Proposed Agricultural Data Taxonomy for Precision Farming: Data-Source Families, Data Properties, Decision Functions, Integration Requirements, Farmer Usability, Analytics Readiness, and Sustainability Relevance
Taxonomy layer | Data-source family | Core data properties | Primary decision function | Analytics or AI-readiness | Farmer usability consideration | Interoperability requirement | Sustainability relevance | Example precision farming use |
Spatial observation layer | Remote sensing data | Raster imagery, spectral bands, vegetation indices, thermal indicators, spatially explicit crop signals | Crop monitoring, stress detection, scouting prioritization | Moderate to high after correction, feature extraction, and ground validation | Requires interpretable maps and agronomic explanation | Georeferencing, image preprocessing metadata, field-boundary alignment | Supports targeted scouting and input-use efficiency | Identifying zones for field inspection after abnormal canopy patterns |
Spatial structure layer | Geospatial data | Field boundaries, topography, elevation, slope, management zones, spatial reference layers | Zoning, spatial integration, erosion-risk interpretation, traffic planning | High when layers are current and harmonized | Must reflect actual field layout and farmer-recognized boundaries | Common coordinate systems, boundary verification, layer versioning | Supports site-specific management and landscape-sensitive planning | Combining elevation and yield maps to refine management zones |
Continuous monitoring layer | IoT sensor data | Time-stamped point or node readings, high-frequency environmental or equipment measurements | Irrigation scheduling, alerting, facility monitoring, microclimate tracking | High when calibrated and checked for drift, gaps, and representativeness | Must be reliable, low-burden, and easy to interpret | Sensor metadata, communication protocols, timestamp consistency | Supports resource-efficient water and environmental management | Triggering irrigation review using calibrated soil moisture readings |
Operational record layer | Machinery-generated data | Operation logs, guidance tracks, controller records, implement status, telemetry | Work planning, input tracking, operational efficiency, compliance documentation | Moderate to high after cleaning and linkage to fields and operations | Must be accessible across machinery brands and platforms | Machine-data standards, implement metadata, controller compatibility | Supports reduction of overlaps, waste, and unnecessary passes | Comparing planned and actual fertilizer application paths |
Production outcome layer | Yield data | Harvest-time production records, yield maps, moisture-adjusted outputs, spatial yield variability | Post-season diagnosis, management-zone evaluation, prescription refinement | High after calibration, lag correction, and outlier removal | Requires clear explanation of cleaned versus raw yield maps | Spatial filtering, harvest metadata, crop-specific calibration records | Supports learning from yield variability and improving input efficiency | Evaluating whether previous variable-rate fertilizer zones improved crop response |
Risk timing layer | Climate and weather data | Station observations, gridded data, forecasts, climate indicators, temporal risk signals | Planting, irrigation, spraying, harvest timing, climate-risk planning | Moderate to high when uncertainty and forecast horizon are matched to decisions | Must communicate uncertainty and timing relevance clearly | Time-step harmonization, station metadata, forecast-product documentation | Supports climate adaptation and risk-aware resource use | Adjusting spray timing based on wind, rainfall, and disease-risk outlook |
Biophysical constraint layer | Soil data | Physical, chemical, biological, moisture, temperature, nutrient, salinity, and compaction indicators | Fertility management, irrigation interpretation, soil-health assessment, trafficability planning | Moderate to high when sampling design and analytical method are documented | Must be connected to practical field actions and known soil behavior | Sampling metadata, unit harmonization, depth alignment, spatial interpolation | Supports soil conservation, nutrient-use efficiency, and long-term productivity | Designing lime or nutrient prescriptions from zone-based soil test results |
Environmental pressure layer | Environmental observations | Pest, disease, weed, erosion, waterlogging, salinity, biodiversity, and landscape observations | Risk management, crop protection, sustainability assessment | Moderate; higher when structured, georeferenced, and linked to weather or imagery | Must be easy to record during scouting or advisory visits | Standard observation categories, location tagging, temporal records | Supports reduced pesticide use and ecosystem-aware management | Prioritizing scouting where imagery and local disease observations coincide |
Management history layer | Farm-management records | Crop rotation, input use, planting dates, irrigation events, labor and equipment records | Planning, cost analysis, traceability, recommendation interpretation | Moderate to high when complete, structured, and linked to spatial units | Must minimize manual-entry burden and reflect farmer workflows | Common data models, event timestamps, field identifiers | Supports accountable input use and adaptive management | Explaining yield variability using planting date and input-history records |
Contextual interpretation layer | Farmer knowledge | Field history, local observations, practical constraints, risk preferences, experiential judgment | Validation, feasibility assessment, trust-building, decision prioritization | Variable; improves when elicited and structured without losing context | Must respect farmer expertise, control, and practical knowledge | Participatory elicitation, feedback loops, advisory translation | Supports locally appropriate, trusted, and feasible sustainability decisions | Farmer reviewing whether a variable-rate prescription fits equipment and field conditions |
Figure 1 illustrates the proposed agricultural data taxonomy by showing how multiple data-source families connect to data-quality dimensions, integration processes, decision-support functions, and farmer-centered interpretation.
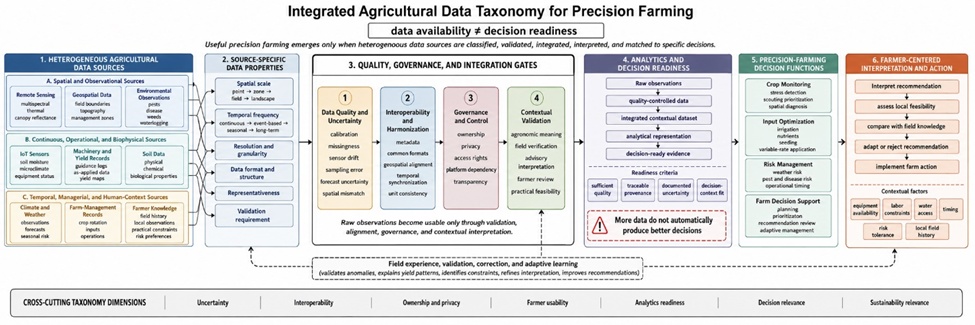
Figure 1. Integrated Agricultural Data Taxonomy for Precision Farming.
The figure conceptualizes agricultural data sources as interconnected layers, including remote sensing, geospatial data, IoT sensors, machinery records, climate data, soil data, environmental observations, farm-management records, and farmer knowledge. These layers are linked to data-quality dimensions, interoperability processes, analytics readiness, decision-support functions, and farmer-centered interpretation.
Alt-text description: A conceptual taxonomy diagram showing multiple agricultural data-source families arranged as layered inputs. Remote sensing, geospatial data, IoT sensors, machinery data, climate data, soil data, environmental data, farm-management records, and farmer knowledge feed into data-quality assessment, interoperability, analytics readiness, decision-support functions, and farmer-centered interpretation for precision farming.
For research, the proposed taxonomy clarifies that agricultural data integration should begin with explicit classification of data-source properties. Remote sensing, sensors, machinery records, soil tests, weather forecasts, and farmer knowledge should not be merged without documenting scale, frequency, uncertainty, ownership, and decision purpose. This has implications for AI-ready agriculture because model development requires more than large datasets; it requires validated, contextually meaningful, interoperable, and ethically governed data streams [3, 26, 27].
For practice, the taxonomy can help advisors, farmers, technology developers, and platform providers evaluate whether a data source is decision-ready. A remote sensing layer may be useful for scouting but insufficient for input prescription without soil and management context; a soil moisture sensor may support irrigation but require calibration and farmer interpretation; a machinery log may document an operation but need standardization before it can be compared with yield or climate records [8, 12, 15, 17]. Practical decision support should therefore communicate data quality, uncertainty, and recommended validation actions rather than presenting data-derived outputs as self-evident recommendations.
The taxonomy also has implications for governance, extension, and participatory design. Farmer-centered precision farming requires systems that respect data ownership, clarify benefits, support transparency, and incorporate farmer and advisory knowledge into interpretation and feedback loops [4, 7, 20, 23, 28, 29]. Digital extension and advisory services can use the taxonomy to translate technical data layers into decision-relevant guidance while avoiding techno-deterministic assumptions about automation, AI, or data abundance.
This article contributes a structured taxonomy of agricultural data sources for precision farming by classifying remote sensing, geospatial layers, IoT sensors, machinery records, yield data, climate and weather data, soil data, environmental observations, farm-management records, and farmer knowledge according to their generation mechanisms, spatial and temporal properties, uncertainty, interoperability needs, ownership concerns, farmer usability, analytics readiness, and decision relevance. The central conclusion is that high-quality precision farming depends not only on advanced data streams but also on validation, integration, contextual interpretation, governance, and practical usability. Agricultural data becomes valuable when it is matched to the decision problem, interpreted through agronomic expertise, integrated across compatible systems, and reviewed in relation to farmer knowledge and field realities.
None
None
None
None
Open Access The author(s) retain copyright. This article is licensed under the Creative Commons Attribution-NonCommercial-ShareAlike 4.0 International License. It may be shared and adapted for non-commercial purposes with appropriate attribution, an indication of changes, and distribution of adaptations under the same license. Third-party material may be subject to separate terms identified in its credit line. View the license at https://creativecommons.org/licenses/by-nc-sa/4.0/.
 Agro Intelligence Research Press