Precise forecasting of watermelon harvest volumes is vital within the agricultural supply chain, since it informs the deployment of farming inputs and streamlines stock and logistical scheduling. Conventional harvest assessment depends predominantly on human effort, rendering it both labour-intensive and slow. To tackle this issue, the present study proposes an algorithmic workflow that leverages unmanned aerial vehicle (UAV) video to identify and count watermelons. The workflow combines You Only Look Once version 8s (YOLOv8s) with image mosaicking and overlapping region division, which supports whole-field watermelon quantity estimation. The detection model, built on YOLOv8s and refined via transfer learning, achieved 99.20% detection accuracy, underscoring its suitability for crop forecasting. The counting strategy, which employs image mosaicking and overlapping region division, accepts stitched panoramas as input and significantly reduces double counting compared to the video-tracking-based detection and counting method. Counting accuracy exceeded 96.61%, indicating strong promise for yield forecasting applications. This elevated accuracy attests to the practicability of deploying the proposed approach for total harvest estimation across expansive watermelon cultivations.
Forecasting harvest volume is essential in watermelon farming, shaping post-harvest choices around input distribution and go-to-market plans [1]. Dependable yield predictions greatly assist producers by enabling them to gauge the supply on hand for buyers [2]. Notwithstanding its critical role, watermelon yield forecasting is predominantly performed manually owing to a shortage of automated, reliable estimation tools [3]. Hence, there is a pressing need for an automated watermelon enumeration system that can serve as a viable replacement for hand counting.
Unmanned aerial vehicles (UAVs) represent a practical platform for data capture across broad watermelon plantings, given their agility and extensive coverage reach. Gathering imagery for a complete field can be accomplished within a condensed time window [4, 5]. In addition, the near-ground aerial vantage point of UAVs provides richer data than satellite imagery, enabling swift, effective surveillance of large watermelon plots [6, 7]. What is more, images captured by UAVs equipped with RGB sensors often deliver high resolution, faithfully rendering the subtle characteristics of watermelon fields [8-10]. UAV images captured from varying positions also provide multiple observation angles, helping counter information gaps caused by foliage blockage [11]. Additionally, geospatial coordinates are embedded in UAV imagery, aiding follow-on procedures such as positioning and orthomosaic construction [12].
Trustworthy in-field watermelon identification is a precondition for UAV-based harvest estimation [13]. Yet, the melons appear comparatively tiny within the extensive field backdrop, which itself mirrors the fruits’ textures and hues, making detection difficult. Over recent years, investigators have pursued multiple lines of research on fruit recognition. Various techniques, among them K-means clustering [14], Bayesian classifiers, and mathematical morphology [15], have been deployed for on-site fruit identification. These classical strategies rely heavily on colour, form, or texture and often require fixed thresholds for recognition [16]. Accordingly, such methods are typically designed for uncluttered settings and struggle to deliver robust detection in complex environmental conditions [17].
Contemporary breakthroughs in deep learning have yielded impressive gains in object recognition, bolstering both exactness and sturdiness [18, 19]. This class of techniques permits self-directed extraction of both shallow and intricate features, affording superior detection flexibility. One deep learning-driven recognition framework is You Only Look Once (YOLO), which trades off precision against processing speed [16]. YOLO reformulates object detection as a regression problem and adopts a single-pass architecture to deliver efficient recognition with exact outputs [20]. In farming contexts, [17] developed an apple recognition approach centred on YOLOv4 Tiny, achieving a mean average precision (mAP) of 99.35%. [21] engineered a novel WGB-YOLO architecture based on YOLO, boosting mAP for multi-tier pitaya recognition to 86.00% within the target harvesting row. YOLO operates effectively in natural field environments and can reliably spot fruits [22]. Adopting YOLO for watermelon recognition could improve accuracy.
Enumeration is an essential phase for UAV-driven watermelon harvest estimation following detection. Two principal strategies exist for fruit tallying. The first is a video-tracking-based detection and counting method (VTDCM), which relies on correlating identical objects across sequential video frames [17]. [23] developed a mango tallying system based on the Kalman filter to track all recognised fruits and obtained an R² of 0.88 compared with the actual tally. While the VTDCM has produced passable results, it calls for considerable computational capacity. Simultaneously, its high fidelity relies heavily on detection accuracy. However, the minute-scale watermelon objects captured from an overhead view yield suboptimal tracking performance [24]. Certain alternate investigations have realised favourable results by substituting fruits with different field indicators for detection and pursuit. Yet, watermelon plantings offer no analogous markers, precluding the use of this tactic [17]. The second method draws on the You Only Look Twice paradigm [25] and frames watermelon object recognition as the task of pinpointing small entities within an expansive context. This procedure adopts image mosaicking and overlapping region division to enumerate watermelons. This paper introduces a panorama stitching and overlap partitioning-based detection and counting method (PSOPDCM) and compares it with VTDCM.
This study aims to develop an on-site watermelon recognition and counting methodology leveraging YOLOv8, image mosaicking, and overlapping region division. The balance of the paper proceeds as follows: the materials and methods for the proposed technique are outlined, followed by the presentation and discussion of the findings. Lastly, the conclusions drawn from this investigation are summarised.
Field measurements for watermelons were gathered in Fufeng County, Baoji City, Shaanxi Province, China (34°25′25″N, 107°58′18″E) throughout the 2022 harvest season. The cultivated strip extends over a sizable tract, spanning nearly 15 m in breadth and 150 m lengthwise. Since the onboard camera’s viewing cone cannot capture the entire plot within one exposure, deriving a total harvest figure from a solitary photograph is not feasible. To circumvent this restriction and obtain a comprehensive yield appraisal, moving imagery covering the complete field was gathered. A rotary-wing platform, specifically a DJI Mavic 2 Pro (SZ DJI Technology Co., Ltd., Shenzhen, China), carrying a Hasselblad L1D-20c RGB sensor, was flown at a steady altitude of 10 m. Throughout the recording, the sensor faced straight downward. To preserve coherence and enable cross-comparison, every video stream was standardized to a spatial grid of 3840 × 2160 picture elements at a temporal sampling rate of 30 frames per second. For the three melon cultivation zones shown in Figure 1, three separate video recordings were collected and labelled A, B, and C, respectively. Recording A contributed to compiling the detection dataset and gauging detection performance, while recordings B and C were set aside for judging the enumeration strategies. All imaging was conducted under natural sunlight conditions, including realistic occlusions and environmental interference.
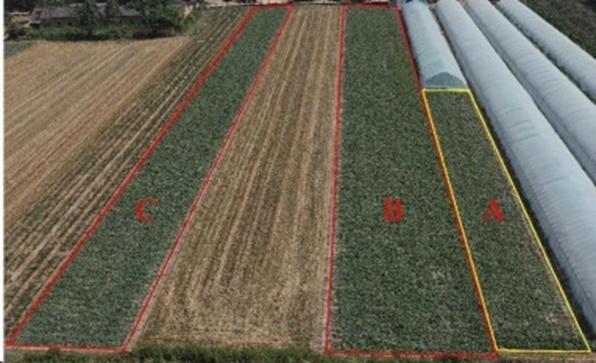
Figure 1. The scene of the watermelon fields. The yellow area represents the shooting area for video A, used for dataset construction. The two red areas represent the shooting areas of videos B and C, which are utilized for counting evaluation (For interpretation of the references to colour in this figure legend, the reader is referred to the web version of this article).
The annotated image collection serves as the bedrock on which the detection pipeline rests. Stills were sampled from watermelon recording A (1 min 22 s) using embedded timestamps, at a rate of one still every 1.5 s. This process outputs 55 original frames, encoded as JPEG files with dimensions 3840 × 2160 pixels.
Given that a watermelon occupies a mere patch of roughly 30 × 40 pixels, distinguishing these targets within native-resolution frames becomes extremely difficult. To address the scale mismatch, an overlapping crop scheme was applied to the dataset, aiming to increase the share of image real estate occupied by each melon. Every source was still subdivided into 45 overlapping tiling sub-windows, each measuring 640 × 640 pixels, with a 20% mutual overlap (Figure 2). The labelling routine was performed in labelImg (https://github.com/tzutalin/labelImg). Every discernible watermelon instance in the sub-windows was manually annotated as “watermelon,” enclosed within an upright rectangular bounding contour (Figure 3). The resulting label records were stored in XML format. After labelling concluded, a repository containing 2475 annotated sub-windows, combining image data with paired label descriptors, stood ready.
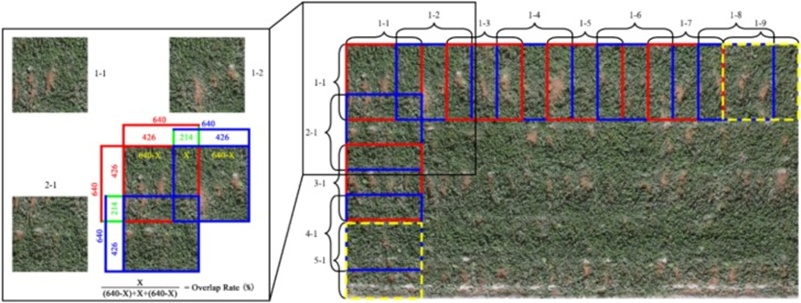
Figure 2. Schematic diagram of the overlap partitioning algorithm. The right side shows an example of the patches arranged in rows and columns of the initial image. The process of dividing a 3840 × 2160 image into 45 sub-images of 640 × 640 is shown. The patch with red borders overlaps the patch with blue borders by 20%. When the cropping pixels do not align precisely with the image edge, the cropping box will be shifted forward by the corresponding number of pixels, as illustrated by the yellow box. The left side shows an enlarged view of the cropping position with an overlap rate of 20%, along with examples of cropped subimages (For interpretation of the references to colour in this figure legend, the reader is referred to the web version of this article).
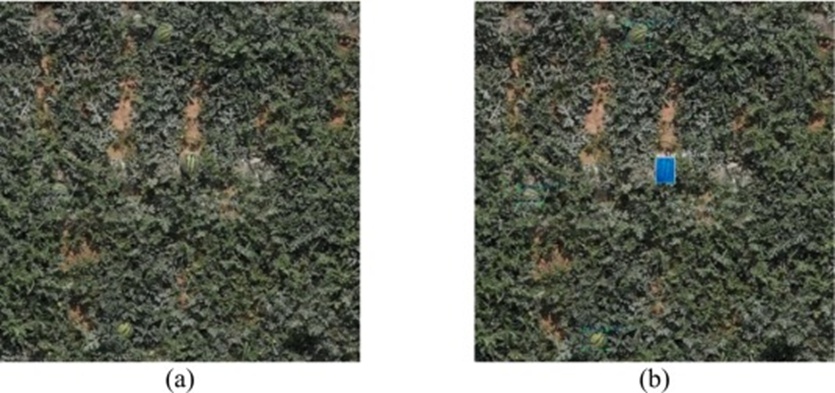
Figure 3. Examples of annotated watermelons: (a) The original image, and (b) The annotated image. The blue box represents the bounding box of the watermelon target, fully enclosing it and closely adhering to its edges (For interpretation of the references to colour in this figure legend, the reader is referred to the web version of this article).
Training a detector on a meagre set of samples can induce memorization of the training data or stall the learning process entirely [26]. To expand the watermelon repository, artificial diversification operations were applied. The suite of transformations comprised photometric shifts scaling luminance by coefficients of 0.8 and 1.2 (Figures 4b and 4c), reflection about the vertical axis (Figure 4d), reflection about the horizontal axis (Figure 4e), and convolution with a Gaussian kernel for softening (Figure 4f). By means of these generative alterations, an enhanced corpus totalling 14,850 watermelon sub-windows was assembled. To evaluate model fidelity, the full collection was split into a calibration partition and a holdout verification partition at a 4:1 ratio.
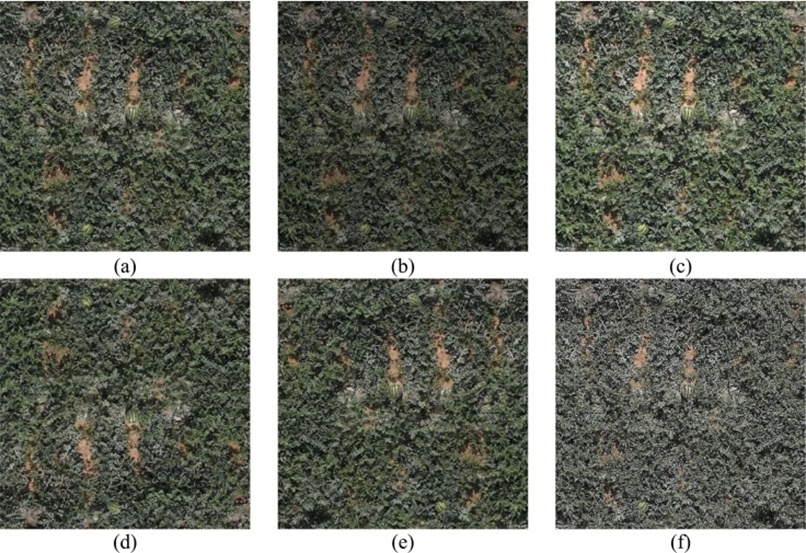
Figure 4. Data augmentation: (a) Original image, (b) Brightness 0.8, (c) Brightness 1.2, (d) Vertical mirroring, (e) Horizontal mirroring, and (f) Gaussian blur.
The YOLO paradigm recasts object localization as a regression objective, unifying speed and exactness by concurrently estimating spatial enclosures and categorical likelihoods. Throughout this investigation, the YOLOv8 detector variant (https://github.com/ultralytics/ultralytics) was selected, centred on a Cross Stage Partial Network (CSPNet) feature extractor. This architectural choice trims superfluous gradient duplication and reduces floating-point operations per second (FLOPS). The intermediary fusion component in YOLOv8 combines principles from the Feature Pyramid Network (FPN) and the Path Aggregation Network (PAN), forming a combined FPN + PAN topology [27, 28]. Information first traverses this fusion block, which broadens the effective receptive field, and then passes into the feature consolidation module. The terminal prediction assembly of YOLOv8 embodies a Decoupled-Head philosophy that separates the categorization and spatial regression pathways, and it draws on the Distributional Focal Loss for optimization [29]. An illustrative schema of the YOLOv8 structure appears in Figure 5. The YOLOv8 offering spans a spectrum of scales—YOLOv8s, YOLOv8n, YOLOv8m, YOLOv8l, and YOLOv8x—distinguished by tunable dimensions including depth_multiple and width_multiple. Bulkier configurations can improve precision, yet they exact penalties of slower throughput and greater storage demands [30, 31].
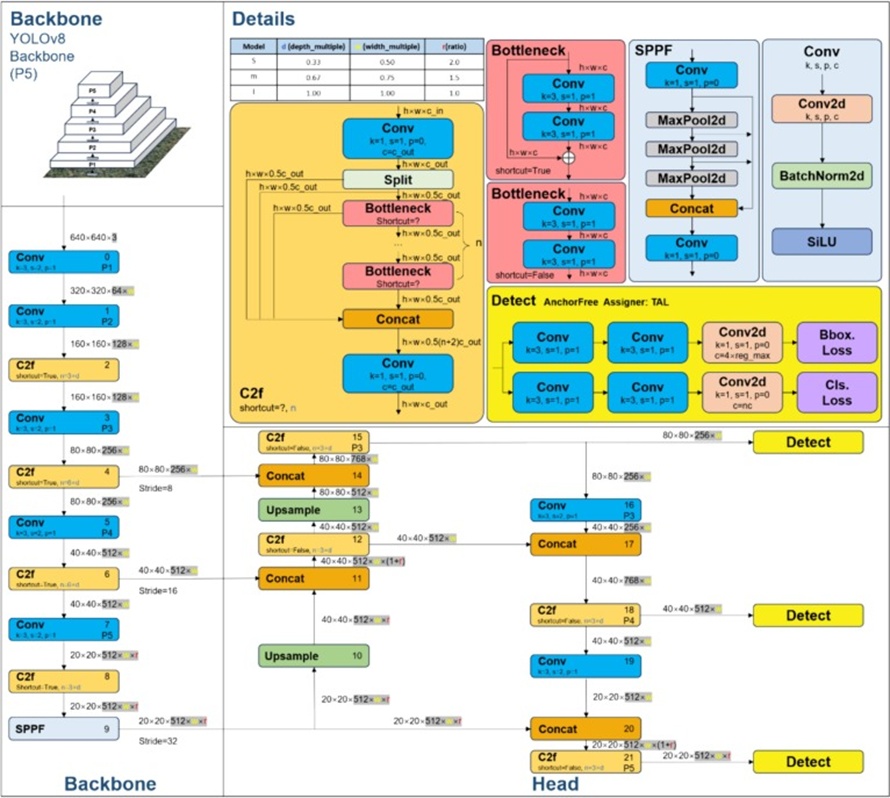
Figure 5. Network architecture diagram of YOLOv8 (https://github.com/RangeKing).
All optimization runs and subsequent evaluations were executed on a computing node equipped with an AMD Ryzen 7 5800X central processor, an NVIDIA GeForce RTX 3080 Ti graphics accelerator with 12 GB of onboard memory, and 64 GB of host RAM. The supporting software environment included CUDA 11.7 and cuDNN 8.2.2. The YOLOv8 architecture was instantiated in the PyTorch deep learning framework, leveraging transfer learning for melon recognition. Transfer learning is a machine learning practice in which knowledge encoded in a model originally optimized for one task is redeployed and fine-tuned for a related but distinct task. Parameter fitting proceeded with input tiles locked at 640 × 640 pixels and examples grouped into mini-batches of size 16. The step-size coefficient governing parameter updates was initialized to 0.01, and the iterative fitting procedure continued across 300 complete passes through the data.
To perform enumeration anchored in video data, multi-object tracking constitutes the core mechanism. DeepSORT (Simple Online and Real-time Tracking with a Deep Association Metric) builds upon the earlier SORT (Simple Online and Real-time Tracking) formulation by embedding appearance features learned through deep networks, thereby boosting association robustness [32, 33]
Within the present framework, a coupled YOLOv8–DeepSORT pipeline assumes responsibility for the tallying phase. Initially, YOLOv8 scans every incoming frame, pinpointing objects and returning their bounding extents along with semantic class assignments. Following detection, DeepSORT ingests the extracted target descriptors and performs temporal linking, leveraging a synergy of Kalman prediction and Hungarian-algorithm matching. As tracking proceeds, an exclusive numeric identifier gets attached to each distinct object instance. Operating side by side in this manner, YOLOv8 and DeepSORT jointly accomplish detection and sustained identity preservation across video sequences, associating each object with its counterparts in neighbouring frames. The detection backbone deployed within the VTDCM workflow has been tuned using the raw stills drawn from recording A.
To maintain precision in identification and avoid tallying the same fruit multiple times within zones where adjacent aerial frames intersect, a mosaic synthesis operation is performed on UAV captures, reconstructing a seamless, all-encompassing view of the cultivation area. The Pix4Dmapper application suite (Pix4D S.A., Prilly, Switzerland) is tasked with computing georectified orthomosaics for the melon plots. Such a procedure helps suppress any geometrical warping of individual melon appearances that might otherwise stem from the stitching computation.
Deriving an orthomosaic entails successive stages: spatial triangulation of camera poses, detection and correspondence of salient features, image warping to correct geometric distortions, and final multi-band blending into a unified canvas (Figure 6). Aerial triangulation is carried out first, a phase in which the exact three-dimensional location and angular attitude of every acquired photograph are recovered, furnishing the geometric foundation for precise overlap alignment. Subsequently, distinctive keypoints scattered throughout the image set are located and matched. Such keypoints constitute recognisable texture anchors—abrupt intensity transitions, edge segments, corner-like structures, and other patterns that can be reliably re-identified. With shared keypoints paired between images, pixel-level alignment is reached. Thereafter, the matched photographs undergo geometric rectification, an operation that flattens deviations caused by varying camera tilts and terrain relief, yielding a spatially faithful representation. In the concluding step, the warped, co-registered photographs are merged to form the orthomosaic product. By capitalizing on UAV-driven orthomosaic generation, snapshots taken from varied headings or positions are stitched together without visible seams, forming a panoramic, distortion-minimized depiction of the watermelon field.

Figure 6. Orthomosaic image generation steps.
Panoramic imagery contains far too many pixels to be fed straight into the detection architecture. To identify melons in such large composites, a 20% overlap tiling scheme is employed. The workflow begins by slicing the panorama into mutually overlapping tiles. Detections are run on each tile separately, yielding the spatial positions of all melons within that tile. Finally, the tile-level outputs are fused and projected back to assemble a panorama-wide set of detections.
(1) Image partitioning:
The full panorama is carved into rows and columns of tiles measuring 640 × 640 pixels each. Upon reading the panorama, its width and height are inspected, and the number of division steps in each direction is determined by dividing the panorama dimensions by the 640 × 640 tile footprint. When the slicing lattice does not land flush against the image border, an offset correction is applied: the cropping window is nudged forward by the number of pixels needed to maintain full coverage. Anchoring at the top-left pixel, the crop boundaries for the current tile index are worked out. The corresponding rectangular patch is excised via array slicing and persisted to the designated output location (Figure 2).
Passing every tile through the YOLOv8-driven melon detector generates XML annotation files containing the particulars of each recognised watermelon. These files store, for each detection, the bounding rectangle coordinates expressed in tile-local pixels, along with a confidence value. To obtain a full tally across the entire panorama, all per-tile XML outputs must be joined. This fusion operation reconstructs a unified annotation layer, enabling accurate counting.
(2) Sub-image stitching:
The composite XML file covering the complete panorama, which collates all watermelon bounding rectangles, is built by merging the XML records from each tile. A global coordinate reference sharing the exact dimensions of the panorama is instantiated first. Afterwards, using the recorded slicing metadata, the local coordinates within each tile are transformed into their corresponding positions in the global panorama frame. The merging loop commences at the top-left corner of the panorama and processes the XML data tile by tile.
The routine must also identify and suppress duplicate detections arising within overlap corridors; the associated decision flow is depicted in Figure 7. Within the 20 % overlap band, the same physical melon may appear in two adjacent tiles. A criterion, termed Bounding box Overlap Percentage (BOP), is formulated to address such redundancy. The BOP value follows from Eq. 1, with Bounding Box A and Bounding Box B standing for the two rectangular extents being examined.
 (1)
(1)
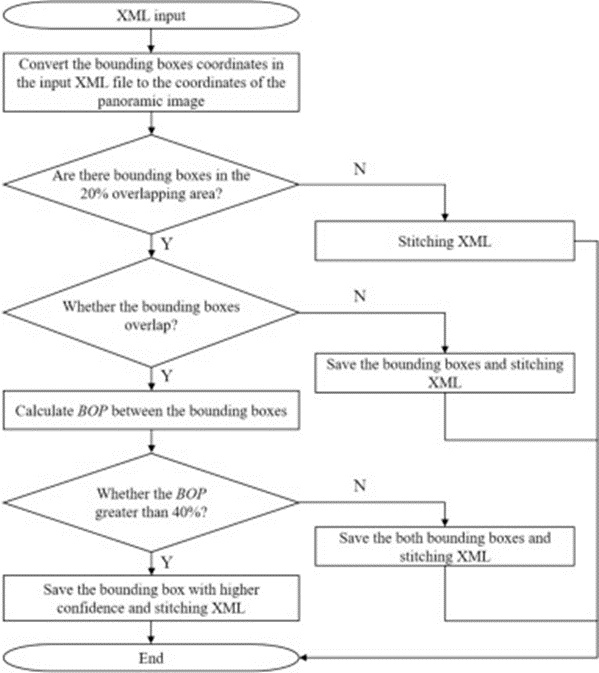
Figure 7. The process of XML file stitching. The rectangular boxes represent the processing steps, and the diamonds represent the judgment steps.
Each time a new XML file enters the pipeline, a preliminary check is performed to determine whether any bounding rectangles overlap by 20%. If none do, every other bounding rectangle from that incoming XML is transferred directly into the panoramic accumulation. If the overlap margin contains rectangles, a further check determines whether there are spatial intersections between them. When rectangles are disjoint, the XML files are stitched without filtering. Upon detecting an intersection, the pair’s BOP is computed. A BOP reading above 40% signals that both rectangles correspond to the same underlying melon; accordingly, the rectangle with the superior confidence score is kept and the other discarded. Should the BOP measure below 40%, both rectangles are preserved and written into the panoramic XML.
Detection model quality was assessed using IoU, Precision (P), Recall (R), Average Precision (AP), and mAP.
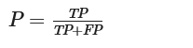
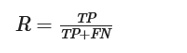
For measuring how tightly the algorithm’s predicted bounding shape matches the human-annotated reference, this study adopts IoU, defined in Eq. 2. Every prediction is assigned to one of four buckets based on whether it aligns with the ground truth: True Positive (TP), False Positive (FP), True Negative (TN), or False Negative (FN). From this categorization, P and R of the detection network are formalized in Eq. 3 and Eq. 4. AP condenses the detector’s overall behaviour into a single figure, computed from P and R per Eq. 5.
 (2)
(2)
 (3)
(3)
 (4)
(4)
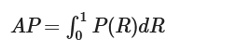 (5)
(5)
The mAP quantity averages AP across all object classes present. Changing the IoU comparison threshold modifies the resulting mAP. The symbol [email protected] denotes the mAP computed across all images per class, with the IoU threshold fixed at 0.5. In contrast, [email protected]:0.95 denotes the mAP averaged across ten IoU thresholds evenly spaced from 0.5 to 0.95, with a step size of 0.05. In the melon detection scenario, because a single object class is involved, mAP and AP for the watermelon class are identical.
To provide a fair assessment of enumeration quality, counting performance was measured through Counting Accuracy (CA). CA for a given counting method is specified in Eq. 6 as a function of Real Quantity (RQ) and Counting Number (CN). RQ captures the actual melon count present in the video material, whereas CN represents the tally delivered by the automated procedure.
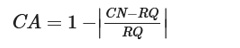 (6)
(6)
In the following part, P, R, AP, and mAP values are tabulated for the YOLOv8s, YOLOv8m, and YOLOv8l configurations to compare their melon detection proficiency. After that, evaluations of both the PSOPDCM and the VTDCM are reported.
Melon detection models were trained using the established hyperparameter recipe on the curated watermelon image collection. As training unfolded, the loss traces descended smoothly and monotonically until levelling off near zero, behaviour indicative of stable convergence (Figure 8). Inspecting the fitted YOLOv8s, YOLOv8m, and YOLOv8l models (Figure 9) shows that all three achieve similarly high accuracy, with little separation among them.
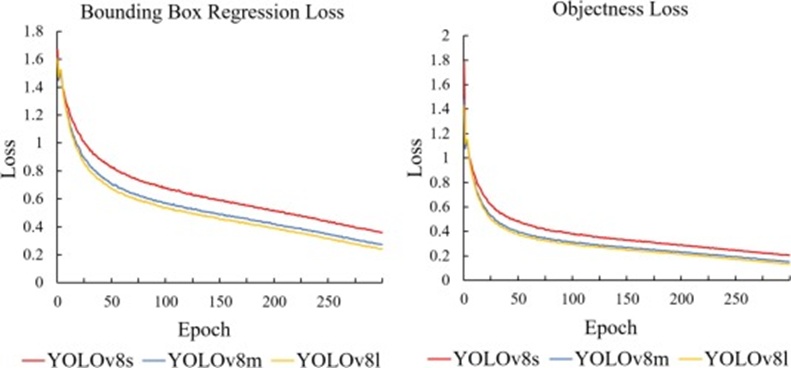
Figure 8. Comparison of loss curves of watermelon object detection models. Bounding Box Regression loss represents the error between the predicted box and the ground truth box. Objectness loss indicates the model’s confidence that a target actually exists in a given region.
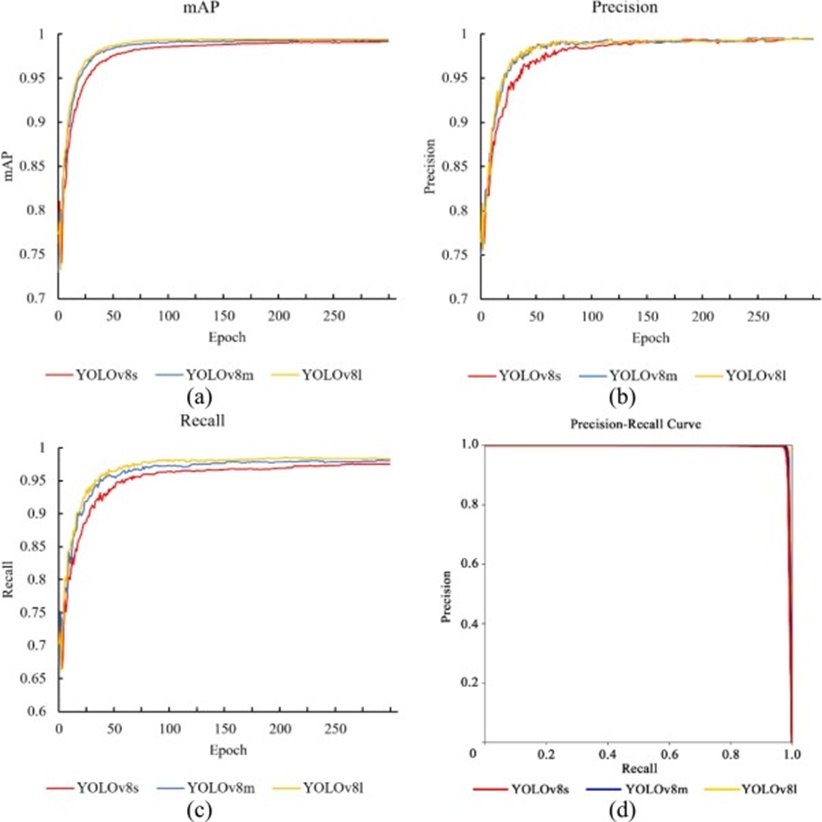
Figure 9. Comparison of mAP curves, Precision, Recall, and Precision-Recall curves of watermelon object detection models: (a) mAP curves, (b) Precision curves, (c) Recall curves, and (d) Precision-Recall curves.
The trio of detection architectures, YOLOv8s, YOLOv8m, and YOLOv8l, was put through their paces on the held-out test partition (Table 1). The YOLOv8s variant performs admirably on melon detection, posting P above 0.99 and R above 0.97, with [email protected] hitting 0.992 and [email protected]:0.95 reaching 0.947. The YOLOv8m- and YOLOv8l-based counterparts offer marginally improved indicator values, yet the YOLOv8s model consumes a mere 28.6 FLOPs and occupies just 11.2 M Params. Because the targeted use case involves wide-area detection, where large batches of imagery must be processed in a single pass, model slimness and inference throughput become the overriding selection criteria. YOLOv8s therefore emerges as the preferred backbone for melon detection owing to its compact size and rapid execution.
Table 1. Comparison of testing effects of watermelon object detection models.
Models | P | R | mAP | mAP | FLOPs | Params | Model size (MB) | Speed (ms) |
YOLOv8s | 0.994 | 0.974 | 0.992 | 0.947 | 28.6 | 11.2 | 21.5 | 137.0 |
YOLOv8m | 0.994 | 0.980 | 0.992 | 0.972 | 78.9 | 25.9 | 49.7 | 253.2 |
YOLOv8l | 0.994 | 0.982 | 0.994 | 0.980 | 165.2 | 43.7 | 83.7 | 405.8 |
With the YOLOv8s-based detector in place, every tile is scanned, and corresponding annotation files are written (Figure 10a). Tile-level annotations are then stitched to yield a panorama-scale detection visualisation (Figure 10b). The YOLOv8s detector has produced satisfactory results when deployed on panoramic imagery.
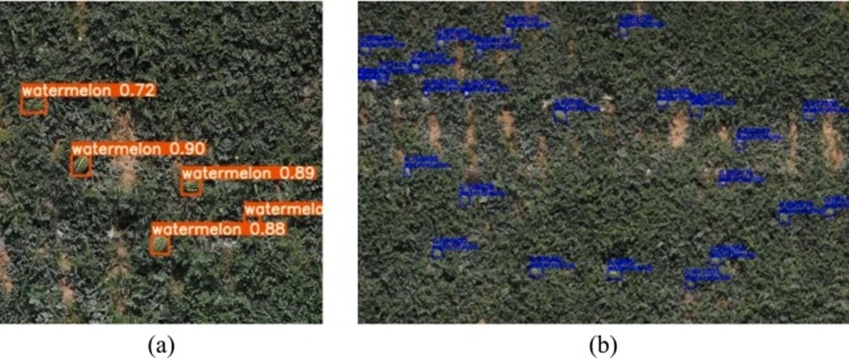
Figure 10. The detection results of sub-images and the panoramic image. The detection results were obtained by drawing bounding boxes on the image using the XML files. Each target watermelon is enclosed in a bounding box, and the text above shows the recognized category and its confidence score.
The fidelity of the two enumeration strategies was gauged against videos B and C using CA as the yardstick. The true melon populations (RQ) in videos B and C amount to 637 and 502, respectively. When the VTDCM was applied, the CN climbed to 1478 for video B and 1232 for video C (Table 2). These estimates exhibit extreme skew, directly traceable to the pattern of erroneous positives and overlooked instances characteristic of the VTDCM (Figure 11). Under the PSOPDCM, video B returned a CN of 623, corresponding to a CA of 97.80%. In contrast, video C yielded a CN of 485, corresponding to a CA of 96.61% (Table 2). Pooling the outcomes from both test recordings, the PSOPDCM achieved a mean counting accuracy of over 96%.
Table 2. Performance evaluation of counting algorithms.
Method | Test video | RQ | CN | CA (%) |
VTDCM | B | 637 | 1478 | – |
C | 502 | 1232 | – | |
PSOPDCM | B | 637 | 623 | 97.80 |
C | 502 | 485 | 96.61 |
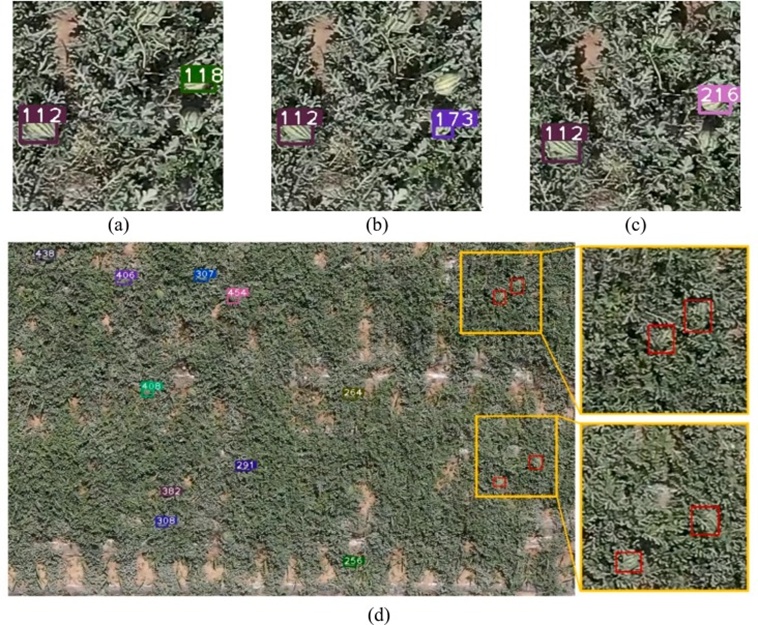
Figure 11. False and missed detections in the VTDCM: (a), (b), and (c) show false detections, such as the same target object being assigned different IDs, and (d) shows the overall scene of the watermelon field during the tracking process, with a magnified view on the right showing the missed detection of the watermelon target caused by vine occlusion (red box) (For interpretation of the references to colour in this figure legend, the reader is referred to the web version of this article).
Superficially, the VTDCM offers a more straightforward processing route—it operates straight on UAV video streams to detect and track melons—yet its results fall short. The fundamental difficulty is that the input video’s high pixel count renders melon detection a problem of isolating small objects from a vast background. This mismatch leads to frequent reassignments of track identities and outright tracker dropouts (Figures 11a, 11b, and 11c). Making matters worse, the VTDCM’s success rests squarely on detection consistency from one frame to the next; however, the near-identical appearance of separate melons undermines this very requirement. In the field environment, melons sit on bare earth among vine rows organized in linear patterns, and the fruit is readily concealed by surrounding vegetation (Figure 11d). Additionally, the colour palette and surface patterns of melons closely echo those of the field itself, introducing a further source of tracking confusion.
By contrast, the PSOPDCM accepts a stitched panoramic composite as its starting point, enabling evaluation of the entire plot in a single view. The overlapping crop strategy markedly improves detection hit rates across wide-area scenes, raises enumeration reliability, and delivers convincing results on the experimental recordings (Figures 11 and 12).
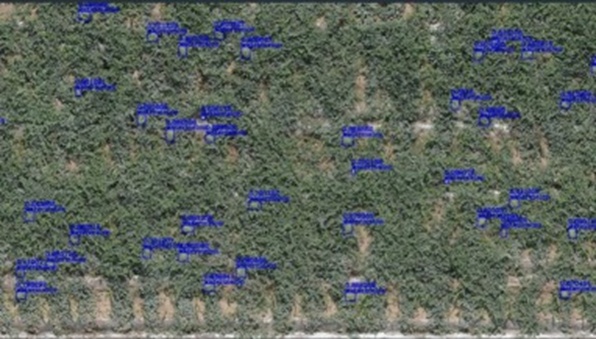
Figure 12. Detection result of the PSOPDCM.
Even though the PSOPDCM substantially outperforms the VTDCM in accuracy, in-field melon spotting still contends with inevitable missed fruit and false positives. Contributing factors range from foliage obstruction within the image frame to geometric artefacts or blur that creep in during either the aerial collection flight or the subsequent mosaicking step. One countermeasure is to capture data from several different vantage points, thereby reducing occlusions. Meanwhile, the processing workflow could be made faster by reworking the logic that fuses per-tile annotation files. Presently, the merging routine may require bounding rectangles located within the four separate overlap regions marked A, B, C, and D in Figure 13 to be screened one zone at a time. Implementing these four overlap zones as a single unified input block for deduplication would significantly simplify the pipeline.
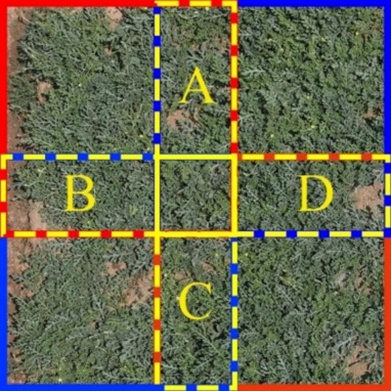
Figure 13. Stitching strategy of annotated files. The red and blue solid line boxes in the figure represent the input sub-images, and the yellow dashed line boxes A, B, C, and D represent the overlapping area (For interpretation of the references to colour in this figure legend, the reader is referred to the web version of this article).
An algorithmic framework operating on UAV footage was designed for watermelon localisation and enumeration. Counting individual items in the field demands the capability to discriminate one instance from another. Prior investigations into in-field object recognition mostly focused on still-image datasets and employed either conventional computer vision methods or deep neural networks [1, 19]. Such methods take batches of narrowly framed pictures as input, which leads them to register the same object repeatedly across multiple frames—a property that obstructs accurate totalling. A subset of research efforts addressing counting in expansive agricultural landscapes has turned to the VTDCM [7]. Nonetheless, the complex visual context surrounding watermelons limits the extent to which tracking-based solutions can succeed with this crop. Image stitching technology enables the fusion of video sequences into panoramas that capture the entire scene, thereby enabling a global examination of the growing area [34]. Adopting such panoramas as the detection input eliminates the recurrent counting pitfall associated with image-set-based strategies. Furthermore, an overlapping tile detection technique was introduced to strengthen detection quality when processing panoramic imagery. Through the combined use of the PSOPDCM and YOLOv8, reliable detection and counting performance for watermelons was realised (Table 3).
By integrating a deep-learning-driven object detector with the PSOPDCM, a UAV-video-based algorithmic chain for melon detection and counting was established. This processing chain consists of three core stages: panoramic image construction, melon localisation, and melon enumeration. Employing a panoramic composite as input provides a holistic perspective of the cultivated plot, enabling field-scale yield estimation. The detection component, founded on YOLOv8s and fine-tuned through transfer learning, achieved a detection accuracy of 99.20%. The PSOPDCM achieved a counting accuracy of at least 96.61%, thereby reducing redundant counts by a considerable margin compared to the VTDCM.
Notwithstanding these advances in detection and counting precision, opportunities remain to improve the pipeline’s computational efficiency. One avenue for future work is to refine the annotation file merging procedure to reduce processing time. Furthermore, collecting watermelon field data across multiple developmental phases would enable the training of a multi-class detection model, yielding richer insights into the progression of watermelon growth.
This work was partially supported by the National Natural Science Foundation of China (32371999); Science and Technology Program of Yulin City, China (2023-CXY-183); Open Project of Key Laboratory of Agricultural Equipment for Hilly and Mountainous Areas in Southeastern China (Co-construction by Ministry and Province), Ministry of Agriculture and Rural Affairs, China (QSKF2023002); National Foreign Expert Project, Ministry of Science and Technology, China (QN2022172006L, DL2022172003L).
None
None
None
Open Access The author(s) retain copyright. This article is licensed under the Creative Commons Attribution-NonCommercial-ShareAlike 4.0 International License. It may be shared and adapted for non-commercial purposes with appropriate attribution, an indication of changes, and distribution of adaptations under the same license. Third-party material may be subject to separate terms identified in its credit line. View the license at https://creativecommons.org/licenses/by-nc-sa/4.0/.
 Agro Intelligence Research Press