Forest health is under mounting pressure from diseases driven by invasive pathogens, and the ability to detect these diseases early and precisely is vital for targeted, prompt forest management. Breakthroughs in spectral imaging and artificial intelligence have paved the way for novel approaches to plant disease identification in both crop and tree species. The present study employed the Dutch elm disease (DED; caused by Ophiostoma novo-ulmi) and American elm (Ulmus americana) pathosystem as a model to test the efficacy of two custom-fabricated, high-precision, portable hyper- and multispectral leaf scanners, paired with machine learning, as innovative instruments for forest disease surveillance. Hyper- and multispectral imagery was collected from leaves of American elm genotypes with varying degrees of disease susceptibility following mock inoculation and inoculation with O. novo-ulmi in controlled greenhouse conditions. Both classical machine learning and cutting-edge deep learning architectures were trained on extracted spectra and directly on spectral image volumes. Deep learning frameworks that leverage combined spectral and spatial information from high-definition spectral leaf images surpass classical machine learning approaches that rely exclusively on spectral data for DED identification. Within the deep learning framework, leaf margins and symptomatic lesions were accentuated as discriminative spatial cues for separating leaves originating from inoculated versus mock-inoculated specimens. Furthermore, the spectral and spatial signature profiles uncovered by the machine learning-based models corresponded to the DED susceptibility levels of the elm genotypes. While supplementary investigations are warranted to gauge transferability across other pathosystems, hyper- and multispectral leaf scanners integrated with machine learning show considerable promise as emerging tools for disease phenotyping in tree species.
Forest ecosystems deliver indispensable ecological, economic, social, and cultural functions [1]. Nonetheless, maladies caused by non-native pathogens pose a growing threat to forest vitality [2, 3]. Containment strategies may prove constrained and financially burdensome depending on the degree of pathogen dispersal and colonization, so prompt and reliable identification is paramount, particularly for invasive organisms that remain locally restricted or concealed. Present-day diagnostic protocols rely on visual inspection of symptoms, supplemented by molecular assays when circumstances demand. Yet, manual visual scoring of disease manifestations is time-consuming and susceptible to inaccuracies [4, 5]. Although early-stage molecular diagnostic tools can be devised, they often entail burdensome workflows, elevated costs, and practical constraints [6, 7].
Contemporary technological innovations have enabled new instrumentality, most notably spectral imaging coupled with artificial intelligence, facilitating rapid and precise plant phenotyping, including pre-symptomatic disease diagnosis across crop and tree systems [5, 8]. By fusing classical imaging with spectroscopic principles, spectral imaging records both spatial and spectral attributes of a target, encompassing healthy as well as afflicted vegetation, thereby permitting the discernment of nuanced shifts tied to pathogenesis ahead of observable symptom expression [8-12]. Artificial intelligence has been applied to the intricate, high-dimensional datasets generated by spectral imaging platforms. Classical machine learning techniques, exemplified by support vector machine (SVM) and partial least squares discriminant analysis (PLS-DA), are routinely deployed in spectral analytics with adequate outcomes for disease diagnosis in crop and tree settings [13-15]. State-of-the-art deep learning architectures, such as convolutional neural networks (CNNs), are inherently better suited to image-centric analytical tasks, including spectral image analysis for plant phenotyping and disease classification [16-18]. The convergence of spectral imaging with machine learning methodologies has unlocked fresh opportunities for pre-symptomatic plant disease recognition. That said, numerous significant forest pathologies remain unexamined through the lens of these technological developments, and further research is required to isolate and verify disease-specific spectral signatures [19].
Spectral imaging can be classified by the number of spectral wavelengths or bands into hyperspectral imaging (HSI) and multispectral imaging (MSI). Hyperspectral imaging acquires and processes information across an extensive range of narrow spectral channels, yielding more granular spectral discrimination and, consequently, enabling the identification of subtle spectral perturbations correlated with plant maladies [20]. Multispectral imaging collects information across a confined set of spectral channels, conventionally spanning 3 to 10 bands. While affording diminished spectral granularity relative to HSI, MSI nonetheless provides valuable information for plant disease identification, particularly when paired with higher spatial resolutions to resolve fine-scale details of symptom progression [21]. Both hyper- and multispectral imaging modalities have undergone assessment for plant disease diagnosis, albeit largely within the context of remote sensing platforms [1, 11, 22, 23]. Spectral imaging datasets obtained through remote sensing arrangements deliver substantial throughput but limited spatial resolution, so disease classification models primarily depend on aggregate canopy chromatic shifts [1]. Incipient disease indicators, however, frequently manifest as minute, localized lesions well before discernible canopy-level chromatic transitions. Moreover, the signal-to-noise ratio (SNR) characterizing remote sensing observations is hampered by various interference sources, including ambient solar variability, inconsistent leaf orientation, and shadowing effects [24, 25]. Hence, the scarcity of high-SNR imaging sensors capable of capturing disease indicators with high spectral and spatial fidelity, together with sophisticated algorithms for reliable disease detection and classification, persists as a critical impediment to early-stage plant disease diagnostics, including forest disease identification.
The recent engineering of high-fidelity leaf spectral imagers, marketed under the name LeafSpec, supplies high-definition imagery across both spectral and spatial axes for rigorous plant health surveillance [26-29]. The economical handheld leaf-scanning instrument was purpose-built to circumvent limitations of conventional spectral imaging setups—uneven illumination and variable leaf inclination among them—through a bespoke scanning enclosure equipped with integrated light emitters and a contact-based acquisition modality. The device can capture hyper- or multispectral images of an entire leaf under field conditions in a non-invasive, expeditious manner. LeafSpec has also been validated, demonstrating enhanced capability to diagnose nutrient deficiencies and distinguish among genotypes in both maize and soybean [27-30]. Still, the preponderance of prior LeafSpec deployments has focused on agricultural row-crop contexts, and the high-fidelity hyper- and multispectral leaf scanners have yet to be evaluated for tree phenotyping applications, including disease detection and resistance profiling.
In the present work, Dutch elm disease (DED) in American elm was selected as a model pathosystem to test LeafSpec’s capacity to identify diseases in forest trees. Elicited by the fungi Ophiostoma ulmi and O. novo-ulmi, DED stands as one of the most catastrophic and far-reaching exotic maladies impacting forests within the United States [3, 31]. First documented in the opening decades of the 1900s, the affliction has since decimated populations of American elm (Ulmus americana) in cityscapes and woodland expanses nationwide [32, 33]. Present-day activities focus on identifying and propagating elm genotypes that exhibit resistance, with an eye toward restoration plantings [34, 35] Consequently, tools that permit rapid phenotyping of specimens for susceptibility are urgently needed to support these undertakings. Earlier investigations established that Fourier transform-infrared (FT-IR) spectroscopy offers the sensitivity required to register shifts in the chemical profile of elm wood after O. novo-ulmi challenge [36, 37] and to separate trees possessing contrasting degrees of DED vulnerability [38, 39]. Crucially, however, those prior efforts examined only destructively harvested xylem tissues, and the authors themselves cautioned that deploying FT-IR for broad-scale, field-based tree assessment remains uncertain in practice [39]. The high-precision, portable LeafSpec device holds considerable promise for broadening automated, in situ plant phenotyping workflows when mated with robotic delivery systems [40, 41].
The central purpose of the research reported here is to assess the fidelity of high-precision LeafSpec instrumentation, paired with machine learning, for disease phenotyping in tree species. The discrete aims were to establish 1) whether high-definition spectral imagery obtained via LeafSpec in conjunction with machine learning can successfully pinpoint DED; 2) whether a performance gap exists between high spectral resolution HSI and high spatial resolution MSI when applied to DED identification; 3) whether elm genotypes spanning a spectrum of DED susceptibility can be teased apart through machine learning-driven interrogation of high-resolution leaf images within both spectral and spatial feature spaces.
American elm genotypes with documented responses to DED were vegetatively propagated in 2021, transferred to containers, and maintained under glasshouse conditions at the U.S. Department of Agriculture Forest Service Northern Research Station located in Delaware, OH. A single containerized clonal tree constituted the experimental unit. The layout adopted a resolvable incomplete block configuration incorporating three sampling occasions, four elm genotypes, and two inoculation regimes, with 4 to 12 replicate plants per genotype per regime per sampling occasion (Table 1). The suite of four elm genotypes encompassed NA 57845, Princeton, RV 141, and RV 467. The clone NA 57845 is known for its pronounced susceptibility to DED and has historically been used as a susceptible benchmark in elm breeding pipelines [42]. Princeton is a commercially marketed American elm cultivar known for its robust tolerance to DED [34, 42]. The genotypes RV 141 and RV 467 represent unique clonal selections originating from seed harvested after controlled hybridization among verified DED-resistant parent trees. Preliminary, unpublished field data point to intermediate-to-low tolerance in RV 141 clones and high tolerance in RV 467 clones (C. Flower, personal communication). Two pathogen challenge treatments were administered: a mock inoculation using sterile water and a live inoculation using O. novi-ulmi. The inoculation procedure adhered to the methodology described by [35]. In brief, a sanitized grafting blade was employed to introduce a minor wound extending into the vascular stream, akin to a cleft graft, sited approximately 10 cm above the substrate surface of each potted tree. A 5 μl aliquot of either water or a spore suspension calibrated to 5 × 10³ spores/μl was introduced into the incision to serve as the mock-inoculation or inoculation treatment, respectively. All inoculations were carried out over the interval of May 10–12, 2022.
Table 1. The number of trees and leaves imaged for each genotype and inoculation treatment.
Elm genotypes | Treatment | 15 WPI |
| 4 WPIb |
| 96 HPIa | |
Trees | Leaves | Trees | Leaves | Trees | Leaves | ||
NA 57845 | Mock-inoculated | 6 | 21 | 7 | 20 | 6 | 18 |
Inoculated | 11 | 32 | 12 | 24 | 10 | 30 | |
Princeton | Mock-inoculated | 4 | 26 | 5 | 15 | 6 | 18 |
Inoculated | 7 | 33 | 12 | 24 | 10 | 30 | |
RV 141 | Mock-inoculated | 4 | 19 | 6 | 18 | 6 | 18 |
Inoculated | 8 | 28 | 12 | 24 | 10 | 30 | |
RV 467 | Mock-inoculated | 5 | 24 | 6 | 18 | 6 | 18 |
Inoculated | 5 | 20 | 12 | 24 | 10 | 29 | |
Genotype combined | Mock-inoculated | 19 | 63 | 24 | 52 | 24 | 58 |
Inoculated | 31 | 140 | 48 | 115 | 40 | 133 | |
a HPI = hour(s) post inoculation; Leaves imaged at 96 HPI were sampled from a different group of trees as compared to those in the last two sampling time points.
b WPI = week(s) post inoculation; The same group of trees was sampled at 4 and 15 WPI.
Foliar symptoms at the canopy level triggered by DED infection, namely wilting, chlorosis, and necrosis, were estimated as a percentage of the total canopy (using 5% decrement categories) at weekly intervals throughout the experimental period (Figure 1C). At the conclusion of the study, approximately 18 weeks post-inoculation (WPI), all trees were destructively sampled to verify pathogen establishment via staining of xylem tissues. Disease progression curves were constructed for each elm genotype. Visual DED severity scores collected near the termination of the trial (∼14 WPI) were compared across elm genotypes by means of a one-way Analysis of Variance (ANOVA) followed by Tukey’s honestly significant difference test (HSD; α = 0.05) to evaluate differences in disease severity ratings among the elm genotypes.
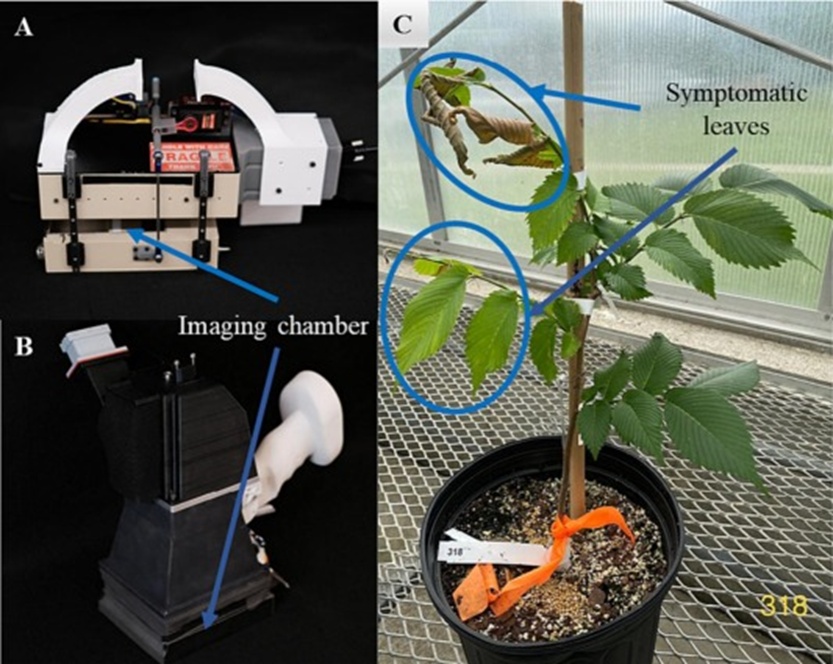
Figure 1. Handheld LeafSpec: (A) the hyperspectral leaf imager; and (B) the multispectral leaf imager. (C) A potted elm tree showing foliar symptoms of Dutch elm disease (DED) ∼4 weeks post-inoculation with Ophiostoma novo-ulmi, the causal agent of DED.
Leaf reflectance imagery spanning hyper- and multispectral domains was captured by the LeafSpec platform at three distinct post-inoculation intervals: 96 h (HPI; before any outward manifestation of DED foliar symptoms), 4 weeks (WPI; coinciding with the earliest visible symptom onset), and 15 weeks (WPI; near study termination, when foliar signs were pronounced). Across all genotype–treatment combinations, 15–33 leaves were scanned at each time point (Table 1). Because trees measured at 96 HPI were subsequently sacrificed for a separate investigation, the leaves scanned at this initial interval belonged to a different set of individuals than those followed at 4 and 15 WPI. Leaves sampled at the first two intervals (96 HPI and 4 WPI) showed no macroscopic DED symptoms regardless of treatment assignment (asymptomatic). In marked contrast, leaves harvested from inoculated trees at 15 WPI bore clear disease indicators such as necrotic leaf tips and chlorosis (Figure 1C). Imaging followed a detached-leaf protocol: each leaf was excised and promptly scanned with both hyper- and multispectral LeafSpec units in succession (Figures 1A and 1B). Instrument specifications are detailed in Table 2. Logistical realities meant that leaves collected at 96 HPI and 4 WPI were held on wet ice and imaged 6 and 24 h after excision, respectively. In contrast, those sampled at 15 WPI were scanned immediately upon detachment. Over the three collection periods, 561 leaves were imaged in total, generating a matched set of 561 hyperspectral and 561 multispectral image cube records.
Table 2. Configurations of hyper- and multispectral LeafSpec imaging devices.
Configurations | Hyperspectral LeafSpec Imager | Multispectral LeafSpec Imager |
Imaging method | Push-broom scanning system | Snapshot-based system |
Built-in illumination | Halogen lighting | LED panel illumination |
Spectral bands | 368 distinct bands | 6 bands |
Wavelength coverage | 446–929 nm | 400, 473, 560, 595, 660, 880 nm |
Spectral resolution | 1–2 nm | Not specified (–) |
Spatial resolution | ~0.5 mm per pixel | ~0.04 mm per pixel |
The analytical sequence applied to hyper- and multispectral LeafSpec data is summarized in Figure 2. Raw imagery was first corrected using a white Reflon flat-strip reference [27]. Leaf-containing pixels were then isolated from the background by thresholding normalized difference vegetation index (NDVI) heatmaps derived from the calibrated cubes [29, 30]. Spectral data were modeled with classical algorithms—SVM and PLS-DA—while the spectral image cubes themselves were fed into a modern deep learning architecture, ResNet18. For each elm genotype, the data (spectra or cubes) were partitioned into training (70%) and test (30%) subsets with a fixed random seed, enabling consistent evaluation of each model’s classification accuracy for DED presence. The procedures that follow elaborate on each analytical stage.

Figure 2. The flow chart of hyper- and multispectral LeafSpec image analysis for Dutch elm disease detection and resistant screening.
A representative spectrum per leaf was produced by averaging pixel-level spectra across the entire segmented leaf area. For hyperspectral cubes, preprocessing mirrored the pipeline reported by [14]: wavelengths situated outside the 490–900 nm interval were dropped, the remaining signal was smoothed with a Savitzky-Golay filter (second-order polynomial, 11-point window), and dimensionality was halved to 156 bands via an in-house spectral binning algorithm. In the multispectral case, the 6-band averaged spectra were used without further manipulation.
Two widely adopted supervised classifiers—linear support vector machine (SVM) and partial least squares discriminant analysis (PLS-DA)—were trained on these averaged spectra to discriminate mock-inoculated from DED-inoculated samples. The linear SVM formulation identifies a separating hyperplane that maximizes inter-class distance while tolerating minimal misclassification [43]. PLS-DA, by contrast, constructs a latent-variable subspace in which class separation is optimized, naturally accommodating the collinearity typical of spectral measurements [44]. Model tuning was performed via 10-fold cross-validation with a grid search; the configuration yielding the highest training accuracy was retained. For SVM, the regularization parameter C was varied logarithmically from 10⁻³ to 10³ (0.001 to 1000) to jointly optimize margin width and classification fidelity while curbing overfitting. For PLS-DA, the number of latent variables was swept from 2 to 5 with the same intent. Both SVM and PLS-DA models were realized using the SVM and PLSRegression modules, respectively, from Python’s scikit-learn suite [45].
To capitalize on the joint spatial–spectral richness of the imagery, pre-trained convolutional neural network (CNN) models with the ResNet18 backbone were fine-tuned to classify leaves as originating from mock-inoculated or inoculated trees. ResNet-style networks reimagine layers as residual mappings referenced to layer inputs, a formulation that facilitates training substantially deeper models [46]. With its 18 weight layers and identity shortcut connections, ResNet18 is well suited to extract complex spatial and spectral signatures from leaf-scale images. Preprocessing removed bands below 490 nm and above 900 nm and applied a 5-band moving-window binning step to reduce multilinearity. In the multispectral series acquired at 15 WPI, the 560 nm band was discarded as an outlier after visual screening of all channels. Post-preprocessing, hyperspectral ResNet18 models accepted 62-band cubes at all three time points. Multispectral ResNet18 models were trained on 6-band cubes at 96 HPI and 4 WPI, and on 5-band cubes at 15 WPI. Optimization employed the Adam algorithm to minimize cross-entropy loss with a learning rate of 0.001. Training proceeded for 200 epochs, and a callback preserved the best-performing model state. The ResNet-18 architecture was constructed within the PyTorch framework [47].
To enhance interpretability, feature importance patterns were extracted from the top-performing SVM model trained on averaged hyperspectral spectra and from the ResNet18 CNN model trained on multispectral image cubes. Linear SVM coefficients supplied a direct measure of each spectral band’s contribution to the decision boundary. For the ResNet18 CNN, class-discriminative spatial heatmaps were generated via Gradient-weighted Class Activation Mapping (Grad-CAM) [48]. Regions illuminated in the resulting Grad-CAM overlays denote image areas that exerted the greatest influence on the model’s prediction—in this setting, potentially corresponding to symptomatic leaf sectors.
Foliar symptom emergence and progression diverged markedly across the four elm genotypes under study (Figure 3). Wilting was first observed as early as 2 WPI. Throughout the experiment, only NA 57845 sustained a mean severity rating above 20%. Between 6 and 9 WPI, a transient decline in visual severity scores was observed (Figure 3A), coinciding with a second vegetative flush from epicormic buds and basal sprouts (data not shown). By 14 WPI, NA 57845 displayed significantly elevated severity relative to the other three genotypes (P < 0.0001), followed in rank order by RV 141, Princeton, and RV 467 (Figure 3B). These visual assessments reaffirm prior reports [31, 35] identifying NA 57845 as susceptible and both Princeton and RV 467 as resistant. Although RV 141 initially exhibits strong tolerance, previous studies document a pronounced increase in symptom expression roughly two years after challenge [31, 35]; Flower, personal communication).
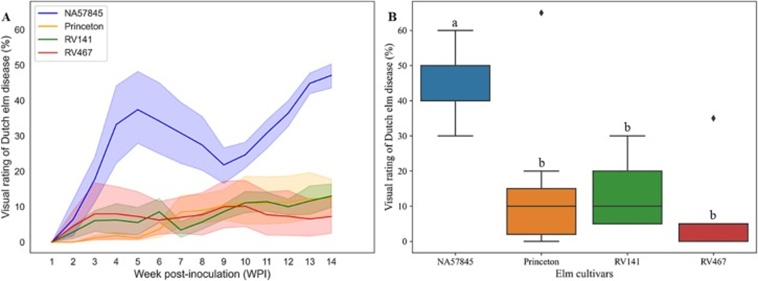
Figure 3. (A) Disease progress curves of elm trees inoculated with Ophiostoma novo-ulmi based on the visual assessment foliar symptoms potentially induced by the infection of Dutch elm diseases (shaped regions were 95% confidence intervals of estimated mean of visual disease rating, n = 4 to 12); (B) Comparison of disease severity among four elm genotypes at 14 weeks post-inoculation using one-way Analysis of Variance (ANOVA) followed by Tukey honestly significant difference (HSD) with α level of 0.05.
At the 14 WPI juncture, roughly 67.6% of O. novi-ulmi–inoculated trees (n = 68) exhibited foliar DED indicators—wilting, chlorosis, or necrosis—and were confirmed infected via sub-bark staining. Notably, nearly 40% of mock-inoculated trees (n = 25) also showed foliar symptoms, including wilting and yellowing, though xylem staining was universally absent in this group, ruling out DED (data not shown). These observations underscore that foliar symptoms can stem from factors beyond DED and reinforce the call for more sensitive diagnostic approaches.
The capacity to separate leaves originating from mock-inoculated and inoculated elm trees—quantified through overall classification accuracy—shifted noticeably across the three post-inoculation assessment periods, and this pattern held irrespective of the spectral imaging modality or the analytical algorithm chosen. Performance peaked at the 15 WPI interval, dropped to an intermediate level at 96 HPI, and reached its lowest point at 4 WPI (Table 3). A plausible driver of the weaker showing at 4 WPI relative to 96 HPI is a renewed burst of vegetative growth following fertilizer inputs delivered after the earliest sampling event. This flush of fresh tissue may have diluted or masked physiological signals associated with DED, rendering them less detectable at 4 WPI than at 96 HPI. The strong results at 15 WPI were foreseeable, given that leaves harvested from inoculated saplings at this late stage showed conspicuous disease lesions. In contrast, the two preceding time points lacked visible symptoms. An additional complicating factor at the earlier intervals was the necessity of holding excised foliage on wet ice for 6 to 24 hours before scanning; such post-harvest storage can modify leaf biochemical constituents (Juneau and Tarasoff, 2012), potentially superimposing artifacts that obscure DED-associated signals and thereby degrade classification fidelity relative to the immediately imaged 15 WPI samples (Table 3).
Table 3. Classification accuracies of machine learning models for the analysis of hyper- and multispectral images to separate leaves from mock-inoculated and inoculated elm trees.
Models | Input | Dataset | 15 WPI |
| 4 WPI |
| 96 HPI | |
Hyper | Multi | Hyper | Multi | Hyper | Multi | |||
SVM | Averaged spectrum | Training | 99.30 | 85.92 | 69.83 | 63.79 | 72.18 | 62.41 |
Testing | 90.16 | 75.81 | 56.86 | 43.14 | 62.07 | 62.07 | ||
PLS-DA | Training | 85.92 | 83.80 | 68.97 | 63.79 | 68.42 | 57.89 | |
Testing | 88.52 | 69.35 | 60.78 | 43.14 | 65.52 | 53.45 | ||
ResNet18 | Cube image | Training | 100.00 | 95.00 | 62.61 | 57.14 | 63.36 | 69.17 |
Testing | 92.06 | 92.19 | 67.31 | 66.67 | 70.00 | 66.67 | ||
Abbreviations: SVM = Linear support vector machine; PLS-DA = Partial least squares discriminant analysis;
ResNet18 = A pretrained 18-layer deep convolutional neural network; Averaged spectrum = spectrum profile calculated by averaging all pixels of a leaf image; Cube image = three-dimensional hyper- or multispectral image cubes; HPI = hour(s) post-inoculation; WPI = week(s) post-inoculation; Hyper = high-spectral resolution hyperspectral LeafSpec image; Multi = high-spatial resolution multispectral LeafSpec image.
A broad trend emerged: hyperspectral data produced models with higher training accuracy. Yet, their testing accuracies were inconsistent compared with those trained on multispectral inputs—whether averaged spectra or full image cubes (Table 3). While training accuracy describes how well a model fits the data it learned from, testing accuracy reveals its robustness on fresh, unseen examples. The greater spectral dimensionality of hyperspectral measurements likely enables finer discrimination of subtle reflectance differences between leaves from mock-inoculated and inoculated trees, thereby boosting performance during training. On novel test splits, however, results varied, hinting at differential model stability. Among approaches that rely on spatially averaged spectra, hyperspectral data yielded superior test metrics. For models that processed whole-image cubes, however, multispectral and hyperspectral pipelines achieved roughly on-par testing results (Table 3).
When contrasting modeling philosophies, deep learning classifiers trained directly on cube images either equaled or surpassed the training accuracies of conventional machine learning algorithms operating on averaged spectra and, without exception, delivered higher testing accuracies (Table 3). Architectures like ResNet18 are known to thrive on abundant training data, often demanding larger corpora than classical methods such as SVM or PLS-DA [49]. The restricted dataset size in the present work may have curbed the training-set performance of the deep networks relative to their simpler counterparts. Critically, though, ResNet18 consistently generalized more effectively to held-out data, indicating robust learning of transferable representations for differentiating mock-inoculated from DED-inoculated leaf samples. A key structural advantage of the CNN approach is its direct use of spectral image cubes, which preserve the intertwined spatial and spectral dimensions of disease expression. By collapsing all spatial variation into a mean spectrum, SVM and PLS-DA models discard potentially informative two-dimensional patterns—such as lesion distribution or margin effects—that can strengthen diagnostic accuracy. On balance, the evidence points to a meaningful benefit conferred by deep learning models that jointly exploit the spatial and spectral information in high-resolution LeafSpec imagery, compared with traditional models confined to spectral averages.
To render model decision-making more transparent, per-leaf spatial attention maps were computed via Grad-CAM for the ResNet18 CNN trained on multispectral cube images. Regions appearing in warm hues within these maps indicate image areas that the network weighted most heavily when generating its prediction. A clear dichotomy in spatial attention patterns was evident between leaves taken from inoculated trees and those from mock-inoculated controls. Specifically, the model consistently emphasized leaf edges and localized symptomatic blemishes as the principal discriminative zones (Figure 4). Disruption of xylem function by DED restricts water delivery, which manifests at the whole-plant level as wilting [32, 33, 50]. Within a single leaf blade, the margins are situated farthest from the major vascular bundles—the midrib and prominent secondary veins—and thus represent the tissues most vulnerable to hydraulic failure. Plants undergoing vascular stress commonly shed or sacrifice marginal tissues first, providing a biologically coherent explanation for why edge features, along with necrotic spots, were preferentially recruited by the model to distinguish inoculated from mock-inoculated foliage.
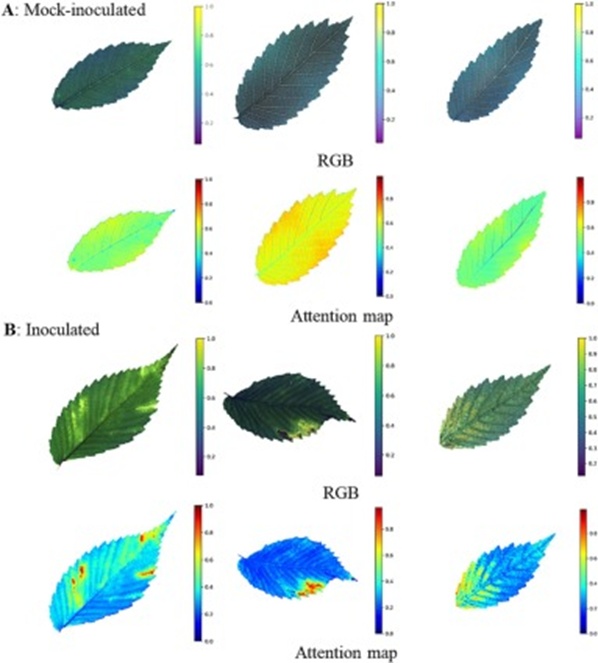
Figure 4. RGB and attention maps of representative leaves from elm trees mock-inoculated and inoculated with O. novo-ulmi, the causal agent of Dutch elm disease (DED). RGB images were derived from multispectral leaf images at 15 weeks post-inoculation. Attention maps representing the spatial feature patterns of the ResNet18 CNN model for DED detection were generated using Gradient-weighted Class Activation Mapping. The highlighted regions in each attention map were the most important parts of the image for predicting DED infection.
The highest-performing models for DED discrimination were subsequently interrogated to assess their potential for classifying elm genotypes by resistance level. Since symptom development proceeded along distinct trajectories in each of the four genetic backgrounds, separate classifiers were built per genotype and subjected to cross-validation using averaged spectra drawn from hyperspectral image cubes (Figure 5A). A telling asymmetry surfaced: the model calibrated on NA 57845 (the susceptible standard) more accurately identified spectra belonging to itself and to RV 141 than those of Princeton or RV 467. Likewise, the RV 141 model outperformed the Princeton and RV 467 models when categorizing the pooled spectral data. A reciprocal trend held on the resistant side, where the Princeton model more reliably classified itself and RV 467 compared with spectra from NA 57845 and RV 141. These asymmetric cross-validation patterns imply that the spectral phenotypes of susceptible and resistant elm genotypes are measurably distinct following pathogen challenge. Such divergence may stem from differential mobilization of defense-related compounds between susceptible and resistant trees in reaction to O. novo-ulmi colonization, a phenomenon documented in earlier biochemical investigations [36-39].
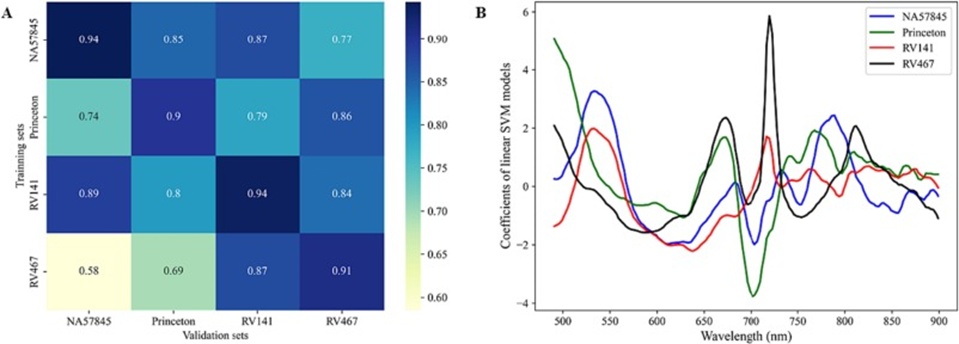
Figure 5. (A) Classification performances of Linear Support Vector Machine (SVM) models of each elm genotype for Dutch elm disease (DED) detection via cross-validation; (B) Coefficient plots of the linear SVM models representing the importance of spectral wavelengths or features in DED classification models for each elm genotype.
Among models operating on averaged spectra, the SVM classifier trained on hyperspectral data from the 15 WPI interval achieved the strongest predictive performance in discriminating leaves from healthy versus DED-affected elms. To determine which spectral bands contributed most to this separation, the coefficient magnitudes of the linear SVM models were extracted and plotted (Figure 5B). A striking correspondence was observed within the visible wavelengths (roughly spanning 490 to 680 nm): the susceptible cultivar NA 57845 and the moderately susceptible RV 141 displayed nearly overlapping coefficient trajectories, while the resistant Princeton and RV 467 formed a second, distinct cluster. Moreover, the coefficient profiles of the two susceptible genotypes diverged clearly from those of the two resistant genotypes across this same range. Shifting to a portion of the red-edge (approximately 700 to 730 nm), RV 141 aligned with RV 467, and NA 57845 grouped with Princeton. Throughout the near-infrared band (around 800 to 900 nm), coefficients remained close to zero, signaling negligible contribution to model decisions (Figure 5B). In sum, the visible segment of the spectrum emerged as the dominant source of discriminative information for separating inoculated and mock-inoculated foliage, corroborating an earlier description of DED spectral reflectance features by [51]. Leaf pigments, particularly chlorophylls, chiefly modulate visible-wavelength reflectance and transmittance. The sequential appearance of wilting, yellowing, and browning provoked by DED likely reflects progressive alterations in pigment pools, which the spectral imaging apparatus successfully registered.
Turning to models constructed directly on spectral image cubes, the multispectral ResNet18 pipeline at 15 WPI achieved the highest accuracy for distinguishing leaves from diseased and healthy elms. To investigate whether the spatial features learned by these networks could contribute to resistance screening, attention maps from ResNet18 models were compared across all four genotypes. The susceptible pair (NA 57845 and RV 141) generated attention distributions that were visually concordant with one another but distinct from those produced by the resistant pair (Princeton and RV 467) (Figure 6). Both inoculated and mock-inoculated treatments were included for each genotype. Close examination of the attention maps revealed that the susceptible lines exhibited activation patterns whose color and spatial distribution resembled those of the inoculated reference group, suggesting a physiological response to the fungal challenge. Conversely, the resistant lines yielded attention profiles more akin to those of the mock-inoculated reference, implying a comparatively subdued or absent response to pathogen exposure (Figures 4 and 6). Collectively, these findings reinforce the conclusion that leaf-level spatial patterns extracted by deep learning architectures can meaningfully partition elm genotypes by DED susceptibility, offering a promising avenue for identifying resistant selections and supporting disease management strategies.
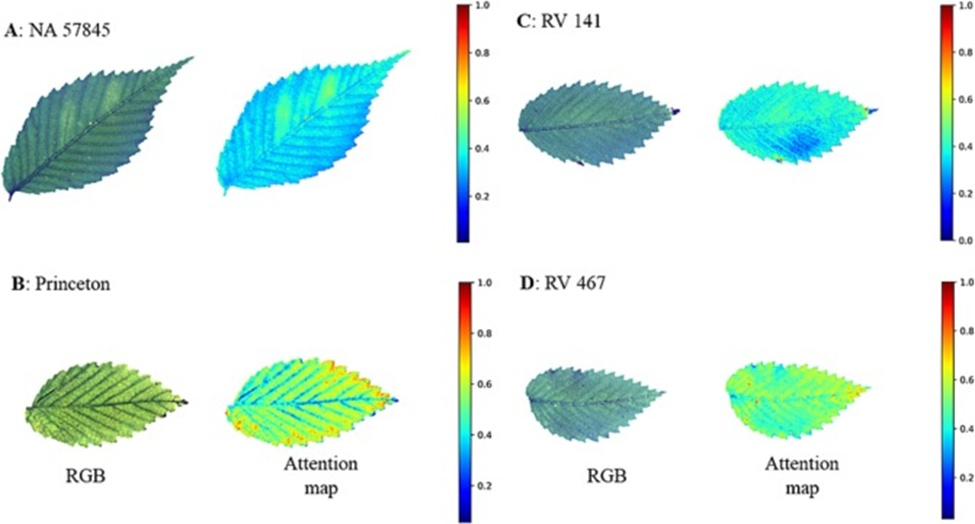
Figure 6. RGB and attention maps of representative leaves for each elm genotype infected with Dutch elm disease (DED). RGB images were derived from multispectral leaf images at 15 weeks post-inoculation. Attention maps representing the spatial feature patterns of the ResNet18 DED detection model were generated using Gradient-weighted Class Activation Mapping. The highlighted regions in each attention map were the most important parts of the image for predicting DED infection.
Two cutting-edge leaf-level imaging modalities—high spectral resolution HSI and high spatial resolution MSI, each combined with machine learning—were evaluated concurrently for the first time in the context of DED detection and resistance screening in American elm. The results revealed that HSI held a distinct advantage at the earliest infection stage, before the appearance of visually discernible symptoms. The wealth of narrowband spectral detail afforded by HSI appears capable of capturing the plant’s incipient physiological responses to pathogen ingress. In parallel, MSI paired with deep learning excelled at pinpointing symptomatic lesions once foliar signs emerged, a benefit attributable to its greater spatial granularity. The novel hardware design embodied in the LeafSpec platform—an enclosed scanning cavity fitted with uniform embedded illumination—delivered consistently high image fidelity and signal-to-noise ratio, providing a dependable substrate for downstream machine learning pipelines.
At the same time, several limitations of the present work merit acknowledgement. First, as a proof-of-concept demonstration, all elm specimens were raised and assessed under regulated greenhouse conditions. Variables encountered in field environments—fluctuating solar illumination, phenological shifts across seasons, or concurrent biotic stresses—may modulate leaf spectral signatures in ways not captured here. Second, logistical constraints confined the study to four American elm genotypes. Broadening the genotypic panel in subsequent investigations will be essential for testing the robustness and transferability of the models reported here. Complementary validation under heterogeneous outdoor settings would further gauge real-world performance. By encompassing a wider array of elm germplasm and spanning diverse environmental contexts, future efforts hold considerable potential to hone and expand the reach of these imaging-based tools, ultimately enabling sophisticated, accurate, and high-throughput DED detection and resistance screening.
This study demonstrates that high-resolution leaf imagery collected with hyper- and multispectral LeafSpec instruments, when analyzed with machine learning, can successfully segregate leaves from DED-infected and non-infected trees, with performance levels modulated by the algorithm and post-inoculation time point. Deep learning architectures that jointly exploit the spectral and spatial dimensions of high-resolution leaf images consistently surpass traditional machine learning models built on spectral averages for detecting DED infection in American elm. Leaves from inoculated and mock-inoculated trees displayed distinctly different spatial feature distributions at the leaf scale. Genotypes sharing comparable DED susceptibility exhibited similar spectral and spatial response patterns following pathogen challenge. Collectively, these findings indicate that machine-learning-driven analysis of high-resolution hyper- and multispectral leaf imagery can detect DED and may be valuable for screening elm genotypes for differential susceptibility. While further research is needed, these portable, high-precision spectral leaf imagers coupled with machine learning have demonstrated considerable promise as tools for accurate disease phenotyping in trees.
This work was supported in part by the United States Department of Agriculture Forest Service (USDA FS) and the Institute for Digital Forestry at Purdue University. We thank the staff and undergraduate interns with the USDA FS Northern Research Station in Delaware, OH, for the maintenance of the elm assay. We thank members of the ABE Plant Senor lab in the Department of Agricultural and Biological Engineering at Purdue University for their help with the data collection. Mention of trade names or commercial products in this article is solely for the purpose of providing specific information. It does not imply recommendation or endorsement by Purdue University or USDA. Purdue and USDA are equal opportunity providers and employers.
None
None
None
Open Access The author(s) retain copyright. This article is licensed under the Creative Commons Attribution-NonCommercial-ShareAlike 4.0 International License. It may be shared and adapted for non-commercial purposes with appropriate attribution, an indication of changes, and distribution of adaptations under the same license. Third-party material may be subject to separate terms identified in its credit line. View the license at https://creativecommons.org/licenses/by-nc-sa/4.0/.
 Agro Intelligence Research Press