The capacity to detect rapeseed with precision and to track the enlargement of its canopy coverage stands among the most telling phenotypic signals of how the crop is developing. When both the individual rapeseed plant and the zone it occupies can be accurately recognized, the resulting data stream provides a powerful foundation for downstream phenotypic exploration and breeding programs. The difficulty, however, is that in genuine field conditions, detection performance continues to face serious obstacles because RGB data alone provides only a limited vocabulary of representable features. Seeking a way around this limitation, the work described here advances a dual-modal instance segmentation framework, MSNet, which builds on YOLOv11n-seg and combines RGB and Near-Infrared (NIR) data streams. The chief innovations embedded in this framework comprise three strategies governing where fusion occurs (at the front end, at an intermediate stage, or at the back end), together with a newly crafted Hierarchical Attention Fusion Block (HAFB) dedicated to blending multi-modal features. Experiments designed to compare these placement choices reveal that conducting fusion at the intermediate stage delivers the strongest compromise between how accurately the model detects and how economical it remains in terms of parameter count. Relative to the baseline, the improvement in mAP50:95 can reach 3.5%. Once the HAFB unit is incorporated, the MSNet-H-HAFB configuration posts a 6.5% lift in mAP50:95 over that baseline, while requiring fewer than 38% extra parameters. A point that deserves emphasis is that mid-stage fusion consistently outperformed the alternatives in every experimental run, supplying a clear blueprint for where future multi-modal architectures should position their fusion operations. In further testing, side-by-side comparisons against a suite of RGB-only instance segmentation alternatives confirmed that all MSNet-HAFB fused variants decisively beat single-modal counterparts on rapeseed count detection, reinforcing the case that multi-spectral fusion holds genuine promise for recognizing agricultural targets. As a concluding step, MSNet was applied in a practical agricultural scenario that included vegetation index analysis and grading of frost-related damage. The data pointed to ZN6–2836 and ZS11 as likely candidate elite lines, while the EVI2 vegetation index registered the strongest classification scores for frost damage in rapeseed.
Across global agriculture, rapeseed—also termed canola (B. napus)—ranks as the second most significant oil-bearing crop and enjoys considerable popularity as a subject of both fundamental inquiry and applied breeding [1, 2]. How many rapeseed plants occupy a given area, and how extensively their combined canopies spread, represent two phenotypic readouts of great importance when forecasting yield. Stands that are too sparse or that develop restricted canopy surfaces each exert a downward pressure on eventual seed harvest [3]. Building a detection algorithm capable of operating with high fidelity on rapeseed is therefore a matter of substantial practical urgency.
Older approaches to detecting rapeseed and outlining canopy boundaries have typically relied on digital image processing workflows that leverage tools such as vegetation indices and wavelet-based decomposition. [4] used the K-Means clustering procedure to segment rapeseed canopy regions and estimated flower loads using vegetation indices, achieving a Root Mean Squared Error of Prediction (RMSEP) of 14.13. [5] formulated the CSRA (color-spectral rapeseed extraction algorithm), a method based on colour-space transforms and spectral response patterns. They achieved provincial-level rapeseed maps with absolute error rates below 20%. Although these conventional pipelines have achieved respectable accuracy, their reliance on manual or iterative parameter search to determine optimal settings [6] places them somewhat at odds with the drive toward fully automated, high-throughput phenotyping workflows.
Instance segmentation methods that learn from RGB images via deep neural network training have become a widely adopted tool for collecting crop-related information, largely because they are inherently robust and can return both per-plant counts and the canopy surface associated with each in a single inference pass. [7] compared YOLOv8 with Mask R-CNN for instance segmentation under orchard conditions, achieving a peak accuracy of 0.93 and recall of 0.97. [8] deployed Mask R-CNN on strawberry imagery for instance-level parsing, achieving an mAP of 83.17 while maintaining 25.46 FPS. [9] described a lightweight architecture for grape peduncle instance segmentation that refines YOLOv8 by channeling heterogeneous subspace features into the backbone to enlarge feature diversity, ultimately achieving 99.3% mAP50 on grapevine segmentation data. The current generation of canopy segmentation algorithms has demonstrated its ability to handle a broad range of agricultural segmentation challenges. The caveat is that when these models are exposed to real field environments—where sunlight varies unpredictably, and crop scales shift substantially—RGB-only formulations repeatedly prove unable to marshal a sufficiently rich feature set, and the result is a heightened rate of both missed targets and false detections [10, 11]. This shortfall places a ceiling on attainable detection quality.
Image fusion algorithms that leverage multi-spectral sensors and can jointly model spectral signatures spanning several wavelength bands have more recently been ported into the computer vision arena to compensate for the known weaknesses of single-band RGB data. [12] introduced CAFF-DINO, a detection architecture combining cross-attention-based feature fusion across RGB and IR streams, and reported gains exceeding 10 % in nighttime pedestrian detection mAP. [13] devised an effective RGB-IR bimodal feature fusion methodology (CFT) built around the YOLOv5 detector and documented marked jumps in multi-spectral detection scores. Findings of this nature provide strong empirical support for the claim that multi-modal fusion networks have an edge over their RGB-only counterparts, as the former can perform both intra-modal and cross-modal fusion to harvest mutually complementary features.
When contemplating how to enhance a multi-modal network, two design dimensions invariably demand attention: the first concerns exactly where in the processing pipeline the disparate spectral streams ought to be brought together, and the second concerns the specific algorithmic mechanism by which cross-spectral features are combined. The landscape of current approaches can be organized as follows:
1) Where to position multi-spectral fusion: The literature recognizes three broad placement strategies. (1) Fusion is executed at the very entrance of the network, where multi-spectral inputs undergo combined feature extraction from the outset. [14] stacked RGB and IR images at this front-facing stage. They fed the resulting inputs into multiple off-the-shelf detection models, consistently achieving gains over RGB-only baselines. (2) Fusion is situated partway along the backbone, such that individual channels are first submitted to separate extraction before being merged partway through. [15] put forward CCIFNet. This design knits RGB-IR streams together while safeguarding the spatial correspondences linking the two modalities throughout the feature extraction chain, thereby achieving state-of-the-art results. (3) Fusion is postponed to the backend, where information from multiple modalities is combined only at the decision stage. [16] engineered a multi-modal CNN-MRI-CT-PET imaging network for lesion segmentation, implementing decision-level combination at the end of the architecture and outperforming any single modality alone. Taken together, these works grapple with the insufficiency of RGB spectral features under specific detection settings. Still, as far as we are aware, a systematic head-to-head comparison of all three placement strategies within the domain of agricultural crop segmentation remains absent from the published record. This gap persists despite multiple studies from the broader computer vision community showing that intermediate fusion is the more advantageous approach [17, 18]. It must be noted, however, that the bulk of those experiments were conducted over pedestrian or vehicle datasets, and whether their conclusions transfer cleanly to agricultural contexts is a question that awaits structured empirical examination.
2) Mechanisms for cross-spectral feature fusion: The practice of routing cross-modal feature fusion through attention mechanisms has been repeatedly shown to deliver sizable boosts to a model’s fluency in interpreting complex cross-modal scenes. [19] constructed a cross-modal multi-stage fusion module (CMFM) designed to interrogate important feature representations during the response phase, and this module proved effective across an array of multi-modal salient object detection (SOD) tasks. [20] proposed the multi-modal mutual attention block (M3Att). This architecture enables modalities to engage in sustained, deep feature-level communication, ultimately surpassing the performance of state-of-the-art reference-based image segmentation techniques. While these existing contributions do advance the extraction and blending of cross-spectral features, their predominant orientation is toward combining modalities at a single, matching scale of feature abstraction. In agricultural use cases, a recurrent issue is that shallow, single-spectral features are vulnerable to progressive erosion over successive rounds of extraction [21, 22]. This reality points to an unmet need for a building block that can simultaneously unite shallow global contextual cues with deeper localized detail while weaving together features from different spectral origins.
To conclude, while practical techniques for bimodal enhancement have been proposed, a gap remains in the rigorous comparison of where fusion should occur within agricultural target segmentation pipelines, and difficulties persist in balancing local detail with global spectral context. [23] noted that YOLOv11, an instance segmentation network known for its architectural simplicity and ease of adaptation, often serves as a foundation for further development. In light of this, the present work carefully designs three separate YOLOv11 fusion topologies that merge two spectral modalities at distinct network stages: the input stage, the feature extraction stage, and the backend stage. An additional contribution is the Hierarchical Attention Fusion Block (HAFB), which adaptively combines local and global spectral representations via a hierarchical attention mechanism, thereby strengthening both the resilience and the task-oriented flexibility of the learned features. When evaluated on the dataset, every proposed model outperforms both the robust YOLOv11 baseline and alternative RGB-only architectures, with MSNet-H-HAFB achieving a 6.5% improvement in mAP50:95 over the baseline YOLOv11. As far as we are aware, this marks the inaugural comprehensive comparative study of multi-spectral fusion detection tailored to agriculture. As a final step, MSNet was deployed in an agricultural case study comprising (1) an analysis of vegetation indices and (2) the classification of frost damage in rapeseed, thus confirming the practical value of the collected data.
A near-ground phenotyping installation and a multi-modal deep learning pipeline form the backbone of this investigation, which targets rapeseed detection and the extraction of vegetation indices. The overall architecture of the experimental method is conveyed in Figure 1: (i) Define the layout and cultivation protocol for the rapeseed; (ii) Determine the data acquisition trajectory for the phenotyping rig, which carries a multi-spectral sensor, to capture RGB and NIR imagery of rapeseed and crops along with labels, and assemble a dedicated rapeseed image repository; (iii) Introduce three RGB-NIR multi-modal fusion instance segmentation networks, encompassing three different fusion configurations and a novel multi-modal feature integration technique, for isolating the rapeseed canopy region; (iv) Quantify the network’s performance and supplement the evaluation with case-based algorithm applications.
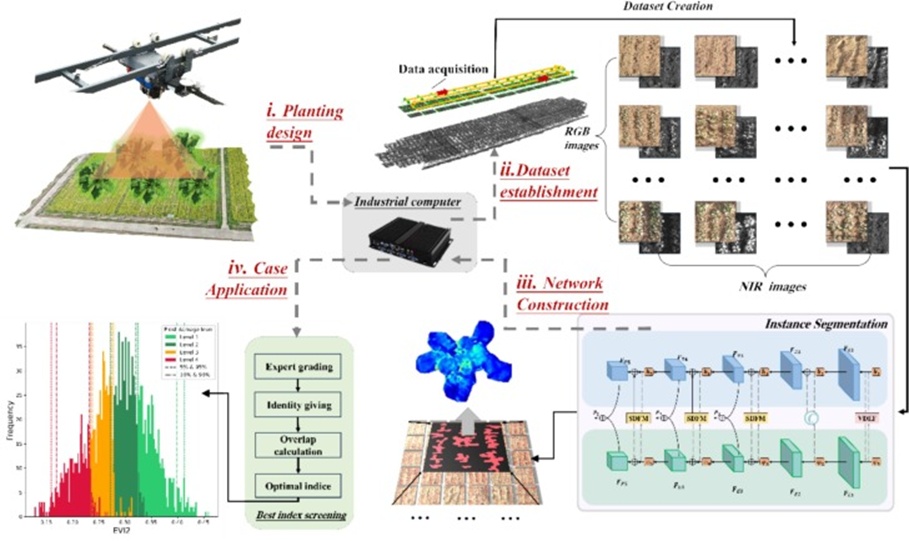
Figure 1. Framework for extracting and applying rapeseed canopy architecture.
The experimental site is located at the Central Anhui Experimental Station of Anhui Agricultural University in Hefei, Anhui, China (latitude: 31°29′4.36″N, longitude: 117°13′23.97″E, elevation: 47 m). This region belongs to the northern subtropical humid monsoon climatic zone. Lujiang County experiences yearly temperatures ranging from roughly 15 °C to 16 °C, a mean relative humidity of 75%, and approximately 2000 hours of sunshine annually. Such conditions are conducive to crop development, rendering the location well-suited to verify the methods presented in this work, as depicted in Figure 2. Seeds from 108 rapeseed varieties—spanning the Chinese cabbage, mustard, and cabbage types—were selected. Each variety occupied a discrete plot measuring 1.2 m in width and 0.5 m in length, with inter-row spacing set at 30 cm and intra-row spacing at 15 cm. Drainage ditches were dug along both sides of the planted area. The spatial arrangement of the plots is illustrated in Figure 2. Throughout the plot establishment phase, marker plates denoting variety identity were inserted at the upper-left corner of each plot. Static geographic coordinates for each marker plate were obtained with a Huace RTKX6 Inertial Navigation receiver (5 satellites, 21 frequency, horizontal static accuracy: ± (2.5 + 0.5 × 10⁻⁶ × D) mm, produced in China), yielding high-precision latitude and longitude for all planting locations. The precision positioning module of the collection platform [24] subsequently performed directed data gathering based on these recorded coordinates. On October 20, 2023, the chosen seeds were sown within the operational range of the rail-based phenotyping platform, with 50 kg of compound fertilizer (N, P, K) and 1 kg of boron fertilizer per mu applied.
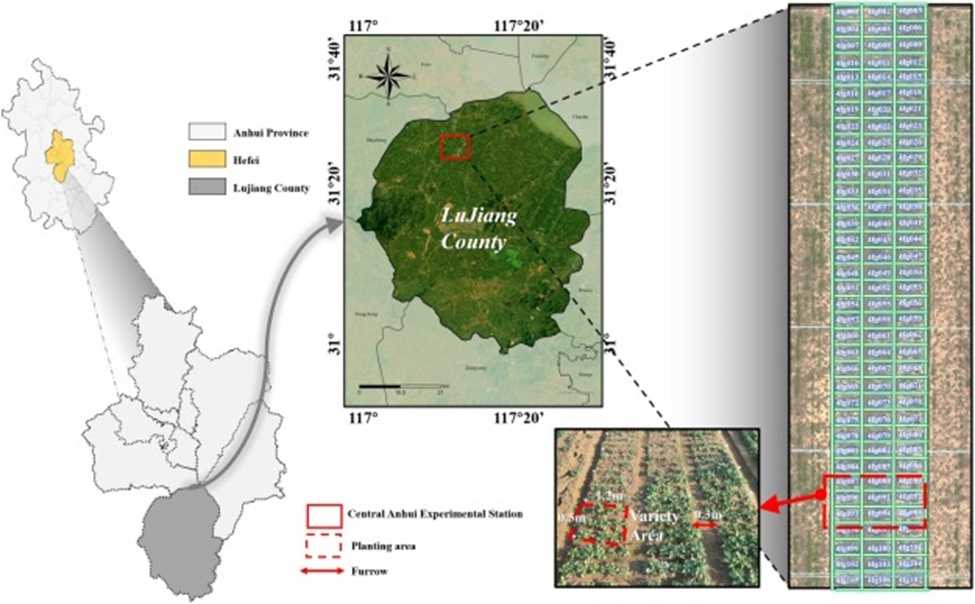
Figure 2. The research area and planting scheme of different varieties of rape. The green rectangles represent the planting areas of a specific variety, and the white text indicates the variety number (For interpretation of the references to color in this figure legend, the reader is referred to the web version of this article).
The segmentation of rapeseed canopies was performed before the onset of flowering. Across 108 rapeseed genotypes, visible-light and NIR imagery was acquired at three phenological windows—the early seedling phase, the late seedling phase, and the budding phase—using an overhead gantry-style, rail-guided high-throughput crop phenotyping facility. The platform, rolling on four wheels and steered via the BeiDou satellite navigation system, proceeds along the field rail to the pre-assigned plots informed by their geographic waypoints. A Parrot Sequoia multi-spectral sensor (RGB: 16 MP; NIR: 1.2 MP) captures reflectance in the visible and near-infrared ranges, providing information on plant vigor. Mounted 3.5 m above the soil surface, the sensor automatically compensates for fluctuations in illumination and logs internally consistent records across diverse lighting environments. A predetermined region of interest (ROI) is applied for image cropping, enabling autonomous data capture during the Seedling, Late-seedling, and budding stages. Data processing workflows are executed via cloud-hosted algorithms.
The meteorological conditions prevailing on each collection date are summarized in Table 1. Cumulative precipitation between the initial and final collection events reached 423.8 mm, total sunshine duration amounted to 512 h, and mean barometric pressure stood at 1002 hpa. An onboard BeiDou positioning receiver ensured the Parrot Sequoia sensor remained vertically aligned over the rapeseed plots throughout data acquisition, guaranteeing accurate framing. The raw photographs were subsequently cropped to the predefined rapeseed planting zones, as shown in Figure 3b, to retain only vegetation belonging to the target varieties, excluding extraneous plants. The ROI definition guaranteed that each recorded image contained the canopy of the designated genotype. Every plot was photographed three times from the same vantage point. Because the imagery originated from separate RGB and NIR sensors, the manufacturer’s application programming interface was employed to geometrically calibrate and co-register the two modalities, thereby minimizing pixel-level misalignments. The final images were resized to 1280 × 720 pixels and archived. A total of 1944 high-grade rapeseed seedling images were selected as the reference set and partitioned into training, validation, and test subsets following a 7:2:1 ratio. The instance segmentation labeling utility provided by the Roboflow web platform was used to annotate the rapeseed photographs. During dataset export, randomized image augmentations—including scaling, rotation, contrast adjustments, random cropping, and noise injection—were applied to expand the dataset volume and improve model generalizability, culminating in 3888 images. Following the steps described, a multi-modal rapeseed seedling database named RNA (RGB-NIRAssist) RapeDataset was compiled, encompassing 3888 paired RGB-NIR images across three growth stages (early seedling, late seedling, and budding). This design enables continuous monitoring of rapeseed throughout each developmental phase and allows real-time tracking of growth dynamics. The dataset’s constitution is provided in Table 1.
Table 1. Dataset structure.
Period | Collection date | Pictures number | Enhanced image | Mean temperature | weather | Acquisition time |
Seedling | December 25, 2023 | 648 | 1296 | 4 °C | Sunny | 14:24–15:38 |
Late seedling | January 11, 2024 | 648 | 1296 | −1 °C | Sunny | 14:46–16:24 |
Budding | February 17, 2024 | 648 | 1296 | 12 °C | Cloudy | 14:34–16:13 |
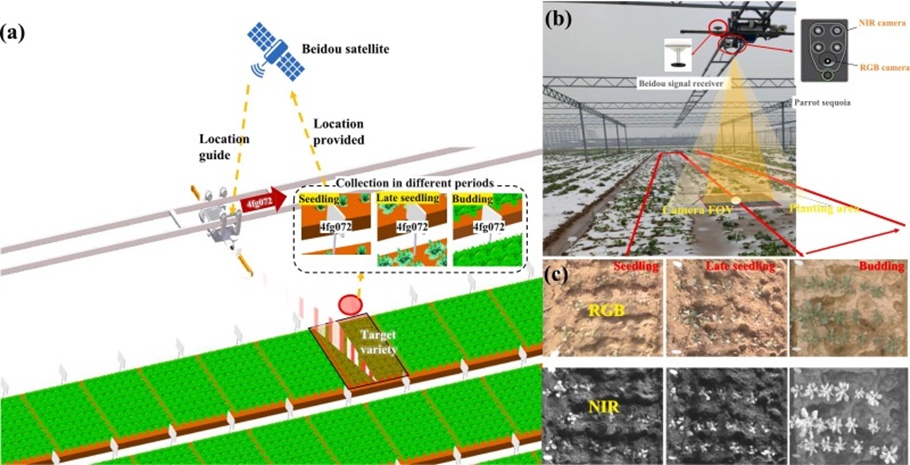
Figure 3. (a) The acquisition platform realizes cell scheduling based on the latitude and longitude coordinates of the guidance sign under the guidance of BeiDou satellites; (b) after arriving at the cell location, the acquisition platform carries out orthophoto acquisition; (c) the platform simultaneously acquires visible light and NIR images.
The YOLO series comprises a set of computationally efficient deep learning frameworks for object detection. YOLOv11, in particular, unifies classification, detection, and segmentation into a single integrated architecture, making it a highly suitable baseline for bimodal improvement efforts; its constituent modules are shown in Figure 4c.
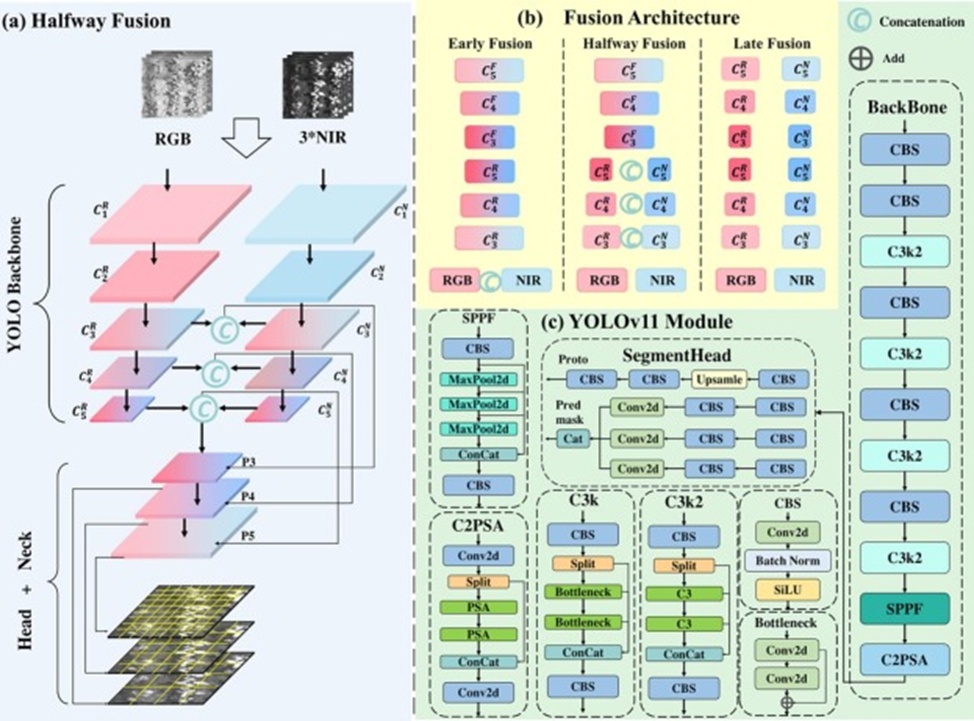
Figure 4. Components of MSNet: (a) shows the more complex fusion method, Halfway Fusion, (b) illustrates the other two fusion strategies, and (c) depicts other components of YOLOv11.
The fundamental obstacle in fusing RGB and NIR data is determining how to effectively merge the representations from the two sensing modalities. Detector architectures derived from the YOLO lineage conventionally split processing into three sequential segments: the input segment, the feature-extraction segment (incorporating both the backbone and neck subnetworks), and the output head segment (the decision-making segment). Within these distinct segments, features encode progressively different levels of semantic abstraction and fine-grained visual cues. In response, three modality-merging strategies built on the YOLO detection framework were introduced. Throughout these strategies, the Concatenate function is applied strictly to join feature maps along the channel dimension, without allowing subsequent extraction of new features from the merged maps, thereby preserving the experimental purity with respect to the location of fusion, as shown in Figure 4.
In effect, the proposed designs are dual-branch architectures with varying merging points: early, halfway, and late fusion, as shown in Figure 4b. The former two strategies combine modalities before reaching the decision segment, whereas the final strategy assembles the RGB- and NIR-branch feature maps at the decision segment.
(1) Early fusion: This tactic concatenates RGB and NIR feature maps at the very beginning, the input segment, before the network performs any feature extraction whatsoever. Concretely, an input image with 6 channels is formed and fed directly into the baseline network for training.
(2) Halfway fusion: Merging occurs partway through the feature extraction segment. Specifically, after each C3K2 layer in the backbone, the RGB and NIR branches are concatenated. It is worth noting that only the set of fused features produced last is subsequently fed into the SPPF layer, allowing the network to continue extracting deeper representations. The earlier fused feature sets, which possess varying spatial dimensions, are concatenated at the neck’s P3, P4, and P5 output layers. This design choice strengthens the model’s capacity to perceive content across scales.
(3) Late fusion: Here, the two branch networks undergo independent feature extraction throughout their pipelines. The feature representations from the P3, P4, and P5 layers of the neck are subsequently fed to the segmentation head, where they are combined. In addition, the detection scores from the two branches are integrated using assigned weighting coefficients.
In the domain of multi-spectral instance segmentation, objects visible across different spectral bands risk being lost during successive rounds of fusion and spatial downsampling. To address this problem, the Hierarchical Attention Fusion Block (HAFB) was developed to replace the standard Concat operation in the network’s neck. The specific substitution point and the reworked neck layout are presented in Figure 5, and the core objective is to more effectively bridge the gap between shallow detail and deep semantic information when fusing multi-spectral imagery.
1) Single-branch multi-level feature extraction strategy: As depicted in Figure 6a, HAFB deploys a single-branch scheme with several parallel processing tiers. Within this scheme, each parallel tier helps mitigate the challenge of unevenly intermixed fused features spanning different spatial granularities and representational depths within a unified branch. Specifically, two parallel sub-branches are constructed inside the single branch: one devoted to global-span representations and the other to localized representations. Starting from an input feature tensor X∈RH′×W′×C, the channel count is first standardized via a pointwise convolution.
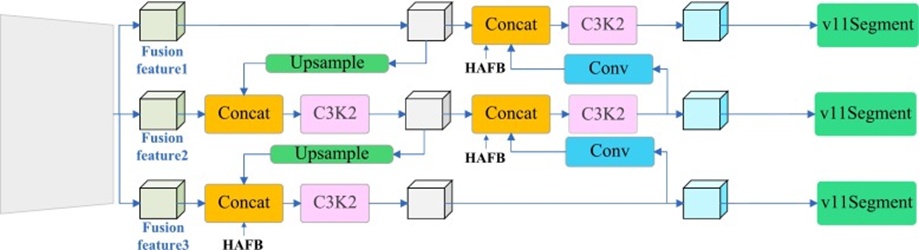
Figure 5. The location where HAFB replaces the Concat operation.
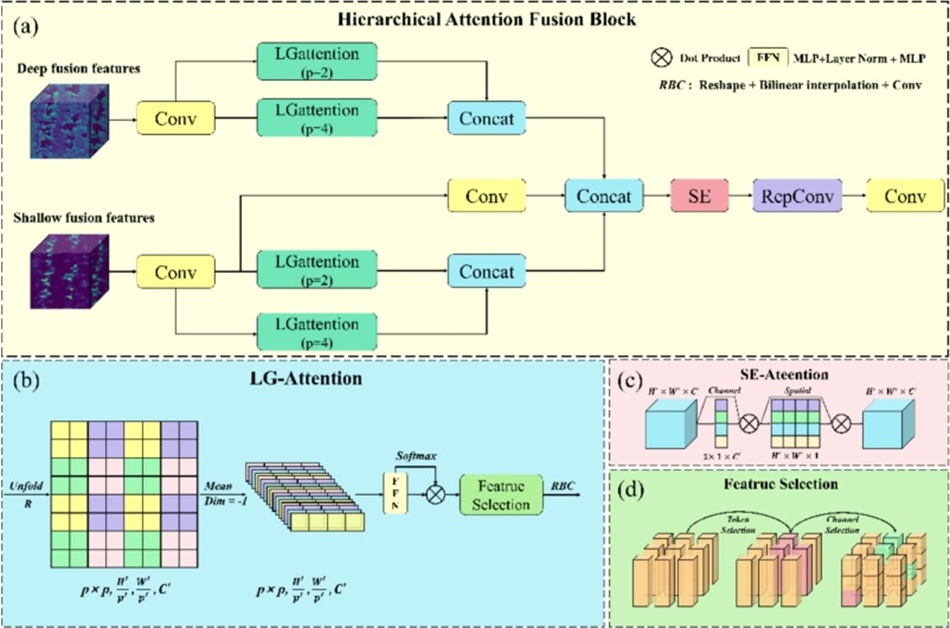
Figure 6. Hierarchical attention fusion block: (a) illustrates the overall functioning principle of HAFB in dual modality, (b) shows the composition of LG-Attention, (c) depicts the principle of the SE attention module, and (d) demonstrates the mechanism of feature selection.
 (1)
(1)
Then, patches are sampled at two separate scales, p1(local) and p2(global), and these patches are unfolded in a non-overlapping fashion following the formulation below:
 (2)
(2)
Within Eq. 3, B corresponds to batch size, N indicates the total number of patches, and C specifies the number of channels. For every patch, average pooling across the channel axis is performed, and the resulting representations are subsequently transformed into tokens via a feed-forward network (FFN), where D represents the embedding dimension:
Softmax normalization is applied to the obtained features to generate the spatial attention weight distributions:
 (3)
(3)
 (4)
(4)
To make the computation more task-adaptive, a learnable prompt vector p∈RD is incorporated, and cosine similarity is evaluated to form the mask:
 (5)
(5)
In the concluding step, the mask-modulated representation is processed through a linear projection and reshaped back to its native spatial configuration:
 (6)
(6)
 (7)
(7)
Through the sequence of steps outlined above, the single branch’s locally focused and globally focused representations, perceived at differing receptive field scales, are retained and prepared for the downstream fusion stage.
2) Feature Fusion and Attention Enhancement Mechanism: Once multi-modal features have been extracted, the HAFB module brings in a dedicated fusion pathway responsible for blending shallow and deep representations that carry both local and global contextual information. At the same time, to safeguard the structural priors encoded in the backbone, an additional convolutional fusion branch is introduced:
 (8)
(8)
The three resultant feature pathways are concatenated via Concat and subsequently squeezed through a 1 × 1 convolutional layer:
 (9)
(9)
After this, the SE attention mechanism is applied to perform channel-wise recalibration:
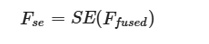 (10)
(10)
To simultaneously raise inference efficiency and strengthen the quality of learned representations, a structurally reparameterized convolutional block, RepConv [25], is integrated for refinement:
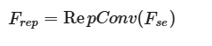 (11)
(11)
Ultimately, a pointwise convolution is employed to restore the original channel dimensionality, yielding the module’s final output features:
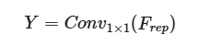 (12)
(12)
To sum up, the HAFB module incorporates a multi-scale, parallelized attention mechanism within a single processing branch, enabling the coordinated modeling of both local detail and global context from multi-spectral inputs. In parallel, it merges cross-hierarchical information integration with lightweight structural redesign, all directed at augmenting the model’s sensitivity to multi-scale fused semantic content and fine structural patterns.
To guarantee an accurate assessment of the rapeseed canopy extraction technique, this investigation employed conventional metrics drawn from the deep learning literature: Precision (P), Recall (R), and Mean Average Precision (mAP). Their computational forms are given in Eqs. 13-15. Each metric is defined by the following expressions:
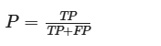 (13)
(13)
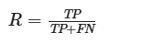 (14)
(14)
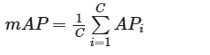 (15)
(15)
Here, TP signals true positives—cases where the model correctly labels a sample as belonging to the positive category; TN stands for true negatives—cases where the model correctly assigns a sample to the negative category; FP denotes false positives—cases erroneously flagged as positive by the model; and FN represents false negatives—cases mistakenly classified as negative by the model. The symbol C denotes the class count, whereas AP denotes the average P. The notation mAP50 specifies the mAP score obtained at an IoU cutoff of 0.5; mAP50:75 denotes the mean across mAP values evaluated at IoU thresholds from 0.5 through 0.75 in increments of 0.05, and mAP50:95 reflects the mean of mAP scores collected over IoU levels spanning 0.5 to 0.95, stepped by 0.05.
Four distinct experimental configurations were devised: (1) A performance comparison confronting the three MSNet fusion topologies against YOLOv11n-seg, with R-YOLOv11n-seg and N-YOLOv11n-seg acting as the unimodal baseline networks handling solely RGB or NIR streams, respectively; (2) An ablation investigation centered on MSNet-HAFB, where, beyond the ablation involving YOLOv11n-seg, HAFB was also matched against five state-of-the-art cross-fusion approaches, namely PSFM, SDFM [26], CAFM [27], CGAF [28], and CFT, to substantiate the preeminence of the hierarchical attention fusion module; (3) A comparative trial placing MSNet-HAFB alongside current best-in-class instance segmentation architectures, all of which are implemented on top of the MMdetection framework and YOLO’s ultralytics library—a combination that offers the field’s most exhaustive collection of instance segmentation networks within a standardized framework. The set of competing architectures comprises: YOLOv11n-seg, YOLOv10n-seg, YOLOv9t-seg, YOLOv8n-seg, YOLOv5n-seg, YOLOACT, Mask-RCNN, Cascade-M-RCNN, RTMDet, and BoxInst. Within this set, YOLOACT, Mask-RCNN, Cascade-M-RCNN, and BoxInst rely on the ResNet50 backbone, whereas RTMDet is built upon the CSPNext backbone. For all the experiments listed, the judging criteria consist of: P(Mask), R(Mask), mAP50, mAP50:75, mAP50:95, parameter volume, and training duration; (4) The rapeseed phenotype extraction fidelity trial compared the trio of MSNet architectures against a range of baseline models on seedling count detection and segmentation precision within the dataset, thereby confirming the fusion model’s elevated segmentation capability.
Every model was implemented in Python 3.9 atop PyTorch 1.18 and trained on an NVIDIA GeForce RTX 4080 SUPER with 16GB of VRAM and 10,240 CUDA cores, running Windows 10. Training used the RNA-RapeDataset, which included all growth phases. Regarding the training hyperparameter configuration, the batch size was fixed at 32, the process spanned 300 epochs, the SGD optimizer was selected, the starting learning rate was set to 0.01, and the weight decay term was set to 0.0005.
The trio of proposed dual-modal architectures was benchmarked against the foundational YOLOv11n-seg model. Figure 7 plots the mAP scores per iteration over the course of training. Across all models, the mAP stabilizes between epoch 275 and epoch 300.
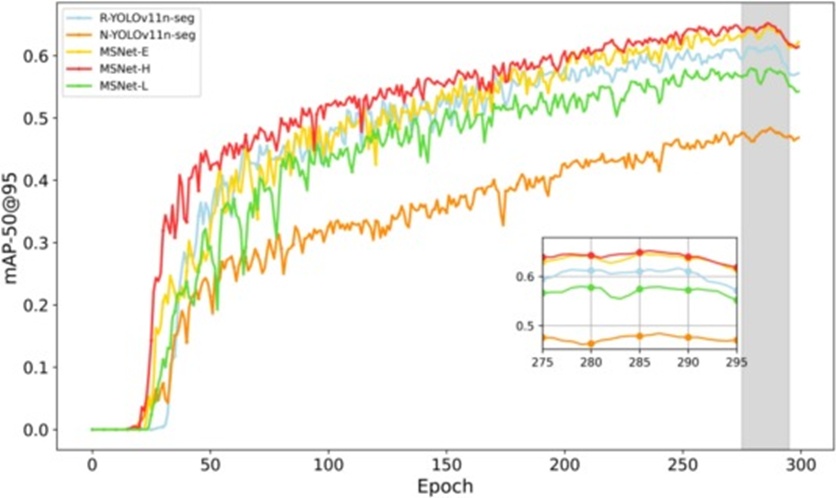
Figure 7. mAP50:95 training curve.
Inspecting the parameter training results reveals that the fused models achieved better detection performance, as shown in the associated training figures in Table 2. MSNet-H registered an mAP50:95 of 0.642, exceeding R-YOLOv11n-seg by 3.5% and N-YOLOv11n-seg by 16.8%. MSNet-E improved upon R-YOLOv11n-seg by 2.5% while trimming the parameter footprint by 8%, a sign that the infusion of near-infrared characteristics tangibly reinforced the segmentation network’s semantic feature recognition. It is worth highlighting that MSNet-L achieved only an mAP50:95 of 0.579, falling 3.8% short of R-YOLOv11n-seg, even as its parameter tally swelled by 22.1%. This pattern implies that, for the task under study, consolidating features at the decision endpoint eroded the model’s aptitude for spotting rapeseed objects, a finding that diverges somewhat from the observations of [16]. One plausible rationale is that rapeseed in this context exhibits broad-scale diversity, accompanied by richer feature sets and denser information, which collectively dilute the impact of the NIR stream and constrain the model’s learning capability in its terminal stages.
Table 2. Ablation experiments performance analysis table.
Modality | Method | mAP50:95 | mAP50:75 | mAP50 | R | P | Para(M) | Time(h) |
RGB | YOLOv11n-seg | 0.617 | 0.753 | 0.978 | 0.923 | 0.964 | 2,84 | 2.77 |
NIR | YOLOv11n-seg | 0.484 | 0.648 | 0.949 | 0.893 | 0.950 | 2,84 | 2.74 |
RGB + NIR | MSNet-E | 0.642 | 0.826 | 0.992 | 0.930 | 0.982 | 2,78 | 2.53 |
RGB + NIR | MSNet-H | 0.652 | 0.843 | 0.987 | 0.952 | 0.985 | 2,03 | 2.12 |
RGB + NIR | MSNet-L | 0.579 | 0.706 | 0.960 | 0.921 | 0.920 | 3,39 | 3.38 |
Beyond the training parameters, Grad-Cam heatmaps offer additional insight into where the model directs its attention. Shadows, zones where leaves from separate plants intersect, and the demarcation of leaf contours are recurrent obstacles in crop segmentation and detection under real-field settings [29]. As depicted in Figure 8, MSNet-H stands out as the most capable configuration for handling the three stated difficulties. It pays scant regard to shadows and handles leaf contours more adeptly than its counterparts. This corroborates the outcomes of [30] and supports the notion that supplying NIR modality input meaningfully sharpens the model’s perception of legitimate targets, without any attendant growth in parameter count. By comparison, MSNet-E and MSNet-L seem to have merely enhanced shadow discrimination, without delivering meaningful gains in rapeseed edge detection. This gap could partly account for their more modest increases in training parameters relative to MSNet-H. Exclusive reliance on the NIR modality produced the weakest outcomes across all evaluated networks, very likely because a single NIR spectral band conveys too little information for the network to assimilate effectively.
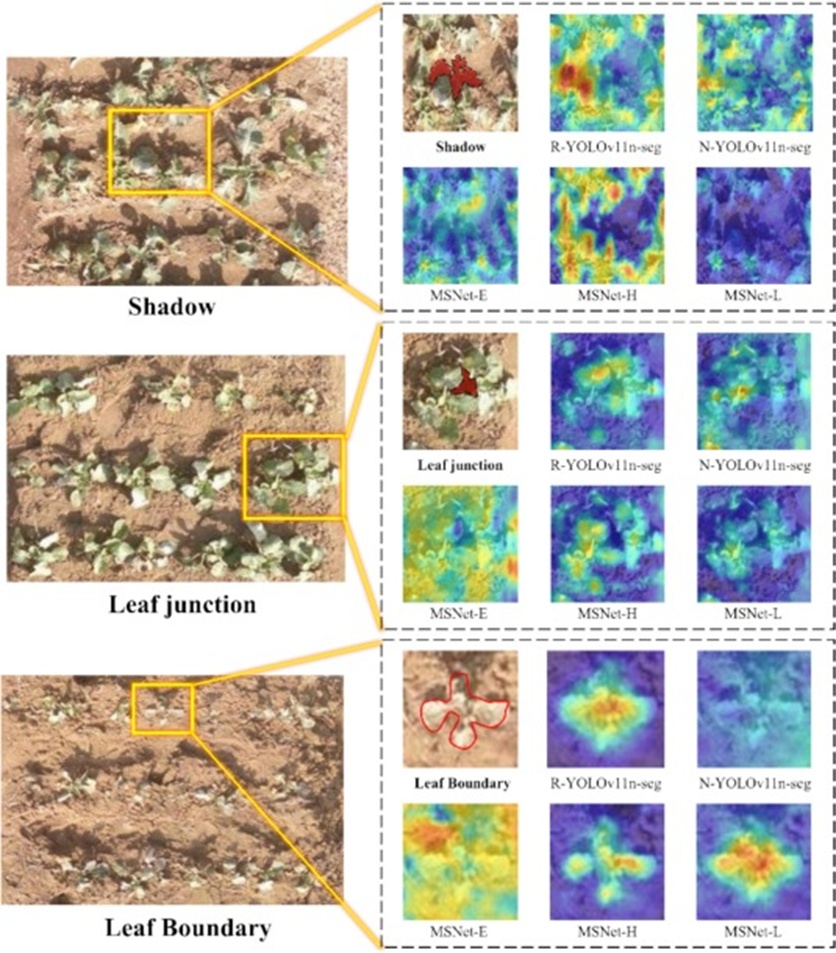
Figure 8. Comparison of Grad-CAM heatmaps for single-modality YOLO and MSNet. The redder areas represent regions that receive more attention from the model.
Viewed collectively, the MSNet-E and MSNet-H variants, which draw upon paired RGB and NIR inputs, eclipse the unimodal baseline networks on both training metrics and attention focus. This validates that injecting NIR data is genuinely advantageous for lifting the crop detection proficiency of a standalone RGB network operating in natural field environments. Within the agricultural research sphere, and building on the evidence from the present study, it is advisable that future investigators adopt mid-level fusion—situated at the feature-extraction stage—for dual-modal detection pipelines. Such a recommendation echoes insights from the computer vision domain, where mid-level fusion is deemed both computationally leaner and better suited to forging substantive links between the two input spectral modalities [16].
A comparative analysis was undertaken to examine the effect of integrating HAFB-based fusion on network behavior under the three separate fusion strategies. Judging by the training outcomes, MSNet-H-HAFB delivered the strongest overall model metrics, lifting mAP50:95 by 6.5% over the baseline YOLOv11n-seg and by 3% over MSNet-H alone. The learning curve is presented in Figure 9. This outcome underscores that a thoughtfully crafted feature fusion strategy can further heighten the effectiveness of multi-spectral deep learning models [31].
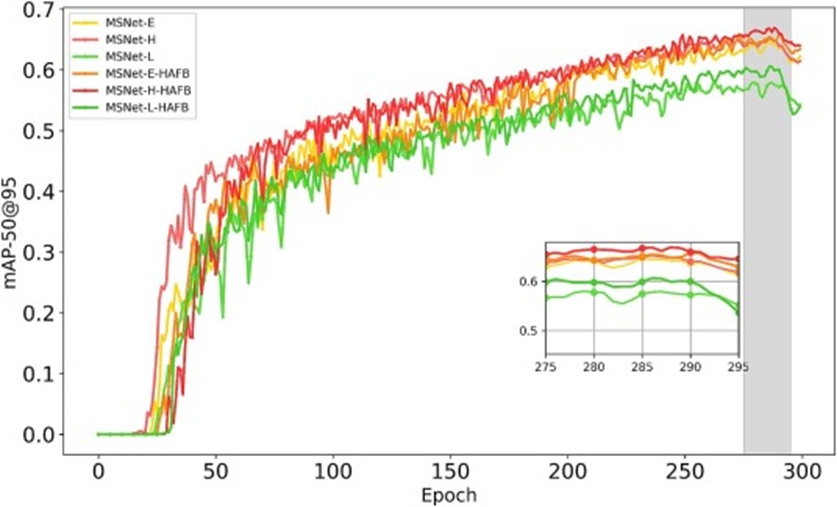
Figure 9. mAP50:95 training curve of MSNet with HAFB compared to MSNet without HAFB.
Moreover, MSNet-E-HAFB and MSNet-L-HAFB achieved gains of 3% and 4%, respectively, as shown in the training statistics in Table 3. Such results point to HAFB’s capacity to remedy the erosion of features that occurs over successive rounds of fusion. This advantage likely stems from HAFB’s feature-extraction paradigm, which follows a single-branch, multi-tiered approach. That design not only safeguards the essential semantics carried through the backbone but also heightens the model’s sensitivity to target-level specifics, ultimately boosting detection scores across multiple metrics.
Table 3. The ablation experiments for the three fusion strategies and HAFB.
Method | mAP50:95 | mAP50:75 | mAP50 | R | P | Para(M) | Time(h) |
MSNet-E | 0.642 | 0.826 | 0.992 | 0.930 | 0.982 | 2,78 | 2.53 |
MSNet-E-HAFB | 0.674 | 0.859 | 0.988 | 0.963 | 0.991 | 4,46 | 4.35 |
MSNet-H | 0.652 | 0.843 | 0.987 | 0.952 | 0.985 | 2,03 | 2.12 |
MSNet-H-HAFB | 0.682 | 0.86 | 0.988 | 0.968 | 0.998 | 3,74 | 3.44 |
MSNet-L | 0.579 | 0.706 | 0.960 | 0.921 | 0.920 | 3,39 | 3.38 |
MSNet-L-HAFB | 0.619 | 0.769 | 0.960 | 0.923 | 0.940 | 6,82 | 6.42 |
An examination of Grad-CAM heatmaps was conducted for rapeseed targets classified as large, medium, and small. It was found that MSNet equipped with the HAFB module further amplified the model’s perceptual grasp of rapeseed targets, as visualized in Figure 10. When dealing with small targets, the enhancement was most striking in MSNet-H, with the model allocating markedly greater attention to the two diminutive rapeseed specimens. This may be attributable to the manner in which the single-modality HAFB conducts feature extraction within shallow feature spaces, thereby retaining the idiosyncratic signatures of small targets in those early layers and averting the feature attrition that commonly occurs during deep-layer fusion in standard RGB architectures [32].
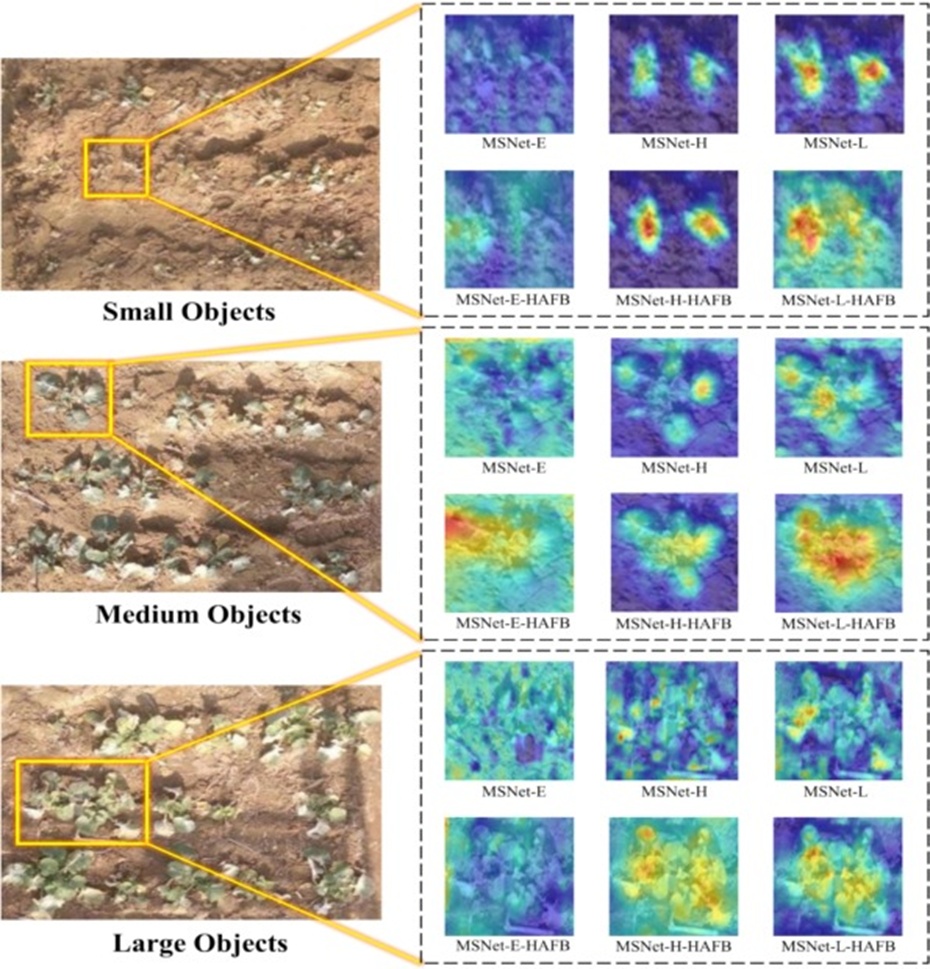
Figure 10. Comparison of Grad-CAM heatmaps between MSNet with the added HAFB module and MSNet without the HAFB module.
In the medium-sized rapeseed regime, all three fusion approaches showed considerable gains. Early fusion steered attention back toward medium-sized rapeseed instances, mid-stage fusion bolstered the model’s boundary discrimination around rapeseed, and late-stage fusion further consolidated the model’s focus on the rapeseed targets themselves. Turning to large target detection, the unmodified MSNet exhibited disorganized attention patterns regarding large-sized rapeseed features. Upon substitution with HAFB, both mid-stage and late-stage fusion substantially refined the positional awareness of rapeseed, and the spurious feature activations present in the early stages were likewise mitigated.
Summing up, HAFB markedly enhances the multi-spectral model’s attentiveness to features at multiple levels, thereby improving target detection performance across a range of object sizes.
Furthermore, HAFB was pitted against cross-attention-driven feature fusion methods operating on features of identical scale to substantiate its advanced suitability for the current task. The experimental data confirm that the HAFB module surpasses the competition at every model scale, as shown in Table 4. Within MSNet-E, HAFB posted the topmost Precision (0.991) and Recall (0.963), while the mAP50:95 figure climbed to 0.674, clearly outperforming the alternative modules. This suggests that an early, shallow fusion configuration can yield enhanced feature representational quality and multi-scale target detection prowess. Within MSNet-H, HAFB again achieved the best precision figures (P = 0.998, R = 0.968), with the mAP50:95 value reaching 0.682, exceeding all other contenders and confirming that this hierarchical structure maintains strong adaptability and representational capacity in mid-level network feature fusion contexts. Within MSNet-L, even with the enlarged model scale, HAFB continued to lead, with an mAP50:95 of 0.619.
Table 4. Comparison of HAFB with other plug-and-play feature fusion modules.
Baseline | Fusion block | Time(h) | Para(M) | mAP50:95 | mAP50:75 | mAP50 | R | P |
MSNet-E | Concat | 2.53 | 2.78 | 0.642 | 0.826 | 0.992 | 0.930 | 0.982 |
SDFM | 2.87 | 2.89 | 0.648 | 0.822 | 0.990 | 0.925 | 0.985 | |
PSFM | 4.88 | 3.49 | 0.651 | 0.827 | 0.987 | 0.932 | 0.976 | |
CFT | 4.64 | 3.09 | 0.658 | 0.840 | 0.986 | 0.944 | 0.988 | |
CAFM | 3.75 | 3.56 | 0.650 | 0.834 | 0.984 | 0.940 | 0.980 | |
CGAF | 3.24 | 2.93 | 0.636 | 0.827 | 0.983 | 0.924 | 0.973 | |
HAFB | 4.35 | 4.46 | 0.674 | 0.859 | 0.988 | 0.963 | 0.991 | |
MSNet-H | Concat | 2.12 | 2.03 | 0.652 | 0.843 | 0.987 | 0.952 | 0.985 |
SDFM | 2.31 | 2.12 | 0.637 | 0.789 | 0.967 | 0.941 | 0.959 | |
PSFM | 5.02 | 3.08 | 0.623 | 0.758 | 0.976 | 0.936 | 0.937 | |
CFT | 5.32 | 2.28 | 0.620 | 0.783 | 0.934 | 0.913 | 0.932 | |
CAFM | 4.62 | 2.64 | 0.654 | 0.834 | 0.972 | 0.928 | 0.982 | |
CGAF | 2.24 | 2.18 | 0.649 | 0.813 | 0.980 | 0.937 | 0.981 | |
HAFB | 3.44 | 3.74 | 0.682 | 0.860 | 0.988 | 0.968 | 0.998 | |
MSNet-L | Concat | 3.38 | 3.39 | 0.579 | 0.706 | 0.960 | 0.921 | 0.920 |
SDFM | 6.34 | 6.68 | 0.603 | 0.712 | 0.955 | 0.923 | 0.937 | |
PSFM | 8.42 | 5.83 | 0.612 | 0.716 | 0.957 | 0.917 | 0.924 | |
CFT | 8.76 | 4.92 | 0.597 | 0.705 | 0.945 | 0.925 | 0.926 | |
CAFM | 5.98 | 5.32 | 0.583 | 0.698 | 0.923 | 0.903 | 0.935 | |
CGAF | 4.33 | 4.68 | 0.610 | 0.703 | 0.938 | 0.919 | 0.932 | |
HAFB | 6.42 | 6.82 | 0.619 | 0.769 | 0.960 | 0.923 | 0.940 |
The described strengths are believed to stem from HAFB’s dual-path, parallel extraction of global and local features. In earlier cross-attention designs, researchers commonly directed separate branches to capture either global context or local detail, then merged the outputs [33]. The suitability of this tactic for multi-modal imagery is, however, open to question, given that feature distributions across different modality branches are frequently dissimilar; indiscriminately sourcing features at disparate scales from separate modality channels risks undermining the model’s capacity to interpret them correctly. Furthermore, the leading results obtained by MSNet-H-HAFB reinforce the notion that, during mid-level fusion, safeguarding the purity of feature extraction within the backbone is likely a more promising route than performing feature extraction directly on fused representations at the backbone stage. Finally, it should be acknowledged that although HAFB increases the parameter budget relative to alternatives like SDFM and CGAF (e.g., reaching 3.74 M parameters in MSNet-H), the associated training time remains well within practical limits (just 3.44 hours), reflecting a well-balanced trade-off between computational outlay and detection performance.
A further round of evaluation was conducted to cement MSNet-HAFB’s multi-modal instance segmentation credentials by comparing it against 10 RGB instance segmentation frameworks that have gained widespread use in recent times. Table 5 collates the resulting figures.
Table 5. Comparison of HAFB with other instance segment networks.
Modality | Method | time(h) | Para(M) | mAP50:95 | mAP50:75 | mAP50 | R | P |
RGB + NIR | MSNet-E-HAFB | 4.35 | 4.465 | 0.674 | 0.859 | 0.988 | 0.963 | 0.991 |
RGB + NIR | MSNet-H-HAFB | 3.44 | 3.744 | 0.682 | 0.86 | 0.988 | 0.968 | 0.998 |
RGB + NIR | MSNet-L-HAFB | 6.42 | 6.825 | 0.619 | 0.769 | 0.960 | 0.923 | 0.940 |
RGB | YOLOv11n-seg | 2.77 | 2.842 | 0.617 | 0.753 | 0.978 | 0.923 | 0.964 |
RGB | YOLOv10n-seg | 2.58 | 2.529 | 0.613 | 0.745 | 0.963 | 0.924 | 0.957 |
RGB | YOLOv9t-seg | 3.31 | 3.128 | 0.612 | 0.734 | 0.976 | 0.918 | 0.954 |
RGB | YOLOv8n-seg | 3.28 | 3.258 | 0.501 | 0.623 | 0.979 | 0.964 | 0.937 |
RGB | YOLOv5n-seg | 2.83 | 2.761 | 0.597 | 0.642 | 0.970 | 0.923 | 0.920 |
RGB | YOLOACT | 4.94 | 3.472 | 0.496 | 0.627 | 0.824 | 0.892 | 0.912 |
RGB | Mask-RCNN | 6.42 | 43.199 | 0.474 | 0.563 | 0.772 | 0.768 | 0.784 |
RGB | Cascade-M-RCNN | 7.84 | 77.012 | 0.535 | 0.639 | 0.863 | 0.855 | 0.849 |
RGB | RTMDet | 3.75 | 27.102 | 0.575 | 0.684 | 0.912 | 0.896 | 0.902 |
RGB | BoxInst | 7.82 | 46.593 | 0.491 | 0.578 | 0.765 | 0.912 | 0.923 |
Glancing at the table reveals that the uppermost Precision (0.998) and Recall (0.968) scores belong to MSNet-H-HAFB, which leaves YOLOv11n-seg (P = 0.964, R = 0.923) considerably behind. This suggests that the introduction of the NIR stream, coupled with the HAFB architecture, enables MSNet to meaningfully augment the disjoint feature signals from the two modalities, thereby heightening sensitivity to object boundaries and semantic regions, a conclusion that echoes the work of [34].
When attention shifts to the mAP50:95 indicator, MSNet-H-HAFB registers a value of 0.682, which is substantially higher than those of YOLOv11n-seg (0.617) and YOLOv10n-seg (0.613), as well as the two-stage pipelines under evaluation, including Mask R-CNN (0.474) and BoxInst (0.491). Especially noteworthy is the mAP50:75 metric, where a score of 0.860 from MSNet-H-HAFB eclipses every RGB-only competitor, signalling enhanced stability across intermediate to high IoU thresholds and reflecting greater detection precision alongside heightened robustness. The parameter load carried by MSNet-H-HAFB (3.744 M) does edge slightly above that of the YOLO family; nonetheless, the scale of the performance advancement fully vindicates the extra cost, and the time required for training sits in the same range as YOLOv9t-seg (3.31 h), evidence of a well-judged trade-off between computational outlay and generalization strength.
Practical verification of the MSNet-HAFB module’s utility in multi-modal object detection was further sought by testing it on illustrative detection instances (small, medium, and large rapeseed), as displayed in Figure 11. The opening image trio depicts rapeseed at an early ontogenetic stage, where individual plants are exceedingly minute and their surface patterns nearly indistinguishable from the adjacent soil. False detections plague the majority of RGB-only methodologies, along with MSNet-E-HAFB and MSNet-L-HAFB; MSNet-H-HAFB, by contrast, sustains dependable individual-level discrimination, producing cleanly outlined boundaries and tightly fitted bounding predictions that demonstrably outperform any approach reliant solely on RGB data. The underlying reason is that rapeseed textures may mimic soil within the RGB channels, yet under NIR illumination, the plant margins become pronouncedly conspicuous. Channeling both modalities into the model helps resolve the ambiguity between rapeseed and soil, a principle reminiscent of the strategy employed by [35] to improve nocturnal pedestrian detection from vehicles by fusing RGB and IR imagery.
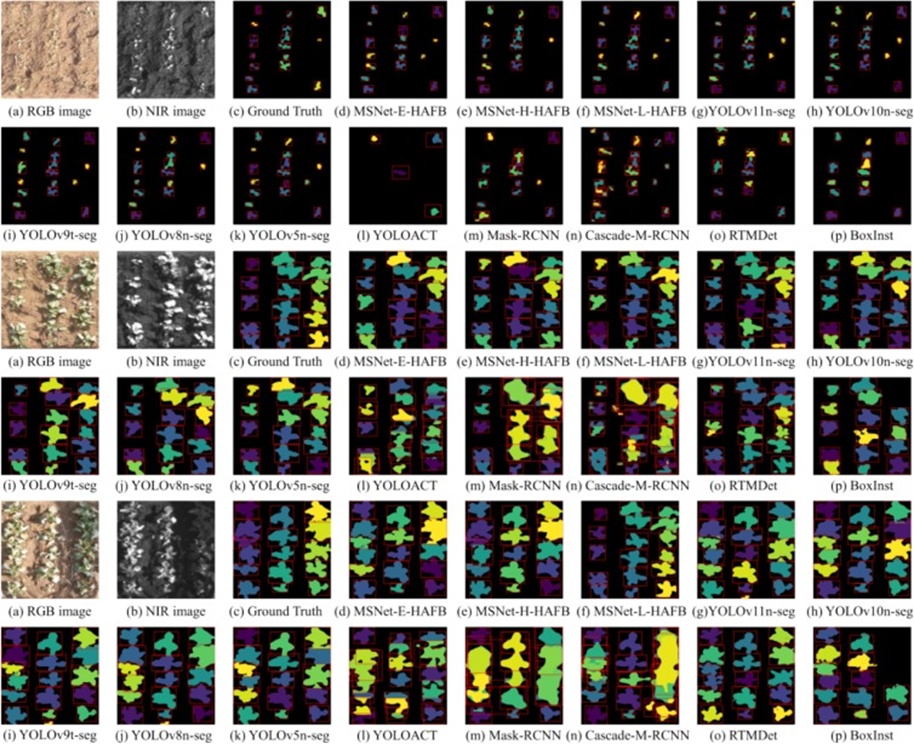
Figure 11. Detection comparison between MSNet and mainstream instance segmentation networks. The three sets of images, from top to bottom, represent small, medium, and large targets. Each set of samples includes the original RGB image, NIR channel image, and segmentation predictions from multiple models.
Where target density climbs and pronounced scale variation and mutual occlusion come into play, a subset of RGB-only methods does deploy counterstrategies. Yet, they remain incapable of consistently isolating every individual, which frequently manifests as expansive regions of colour merging or fractured boundaries [36]. Within the second and third image groupings, those models that assimilate NIR information and adopt the HAFB design, supported by their joint modelling of multi-level global and local cues, converge more precisely upon corresponding salient zones across the two modalities, allowing them to disentangle closely neighbouring targets with greater efficiency. On the whole, the instance-level recognition becomes far more consistent.
To probe further whether MSNet genuinely excels at rapeseed detection, the growth status of rapeseed at the three separate time points was recorded by hand and matched against the detection outputs. Accuracy, as formalised in Eq. 16 is employed to judge the algorithm’s identification fidelity. Within this expression, False corresponds to the number of rapeseed plants incorrectly flagged, Miss refers to the number that went undetected, and Ground truth denotes the manually collated reference dataset.
 (16)
(16)
Accuracy levels across the various networks are plotted in Figure 12. MSNet-HAFB substantially outperforms competing algorithms that rely on RGB-only inputs, and this gap is most pronounced during the later growth windows, where MSNet-HAFB achieves 100% accuracy. A further regularity observable across the three stages is that every network’s accuracy increases as it progresses from the seedling to the budding phase. This trend aligns with the findings of [37] and [38], though the RGB-only networks exhibit more jagged fluctuations. A likely reason lies in the seedling stage, when rapeseed plants are extraordinarily tiny, and most networks are prone to omissions. With leaf expansion, the model gains access to an enriched feature repertoire, which lifts detection quality. It follows that in crop surveillance tasks spanning multiple growth intervals, conventional models anchored solely to RGB information exhibit pronounced performance instability. In contrast, those that fold in near-infrared data alongside potent attention-fusion mechanisms can considerably mitigate the effect of growth-stage transitions on detection reliability, making them the more fitting detection frameworks.
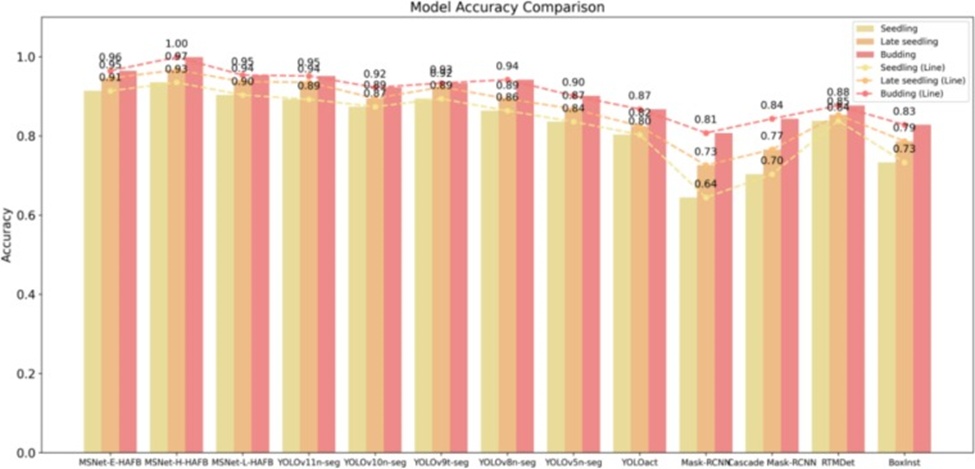
Figure 12. Comparison of rapeseed seedling detection accuracy across three stages for different models.
[39] observed that vegetation indices can act as reliable barometers of rapeseed wellbeing. Aiming to better understand the responses of distinct varieties under a portfolio of vegetation indices, MSNet was harnessed to estimate RGB-NIR rapeseed canopy information gathered throughout the Late Seeding interval. Nine vegetation indices in common usage for rapeseed were derived, and the resultant distributions appear in Figure 13.
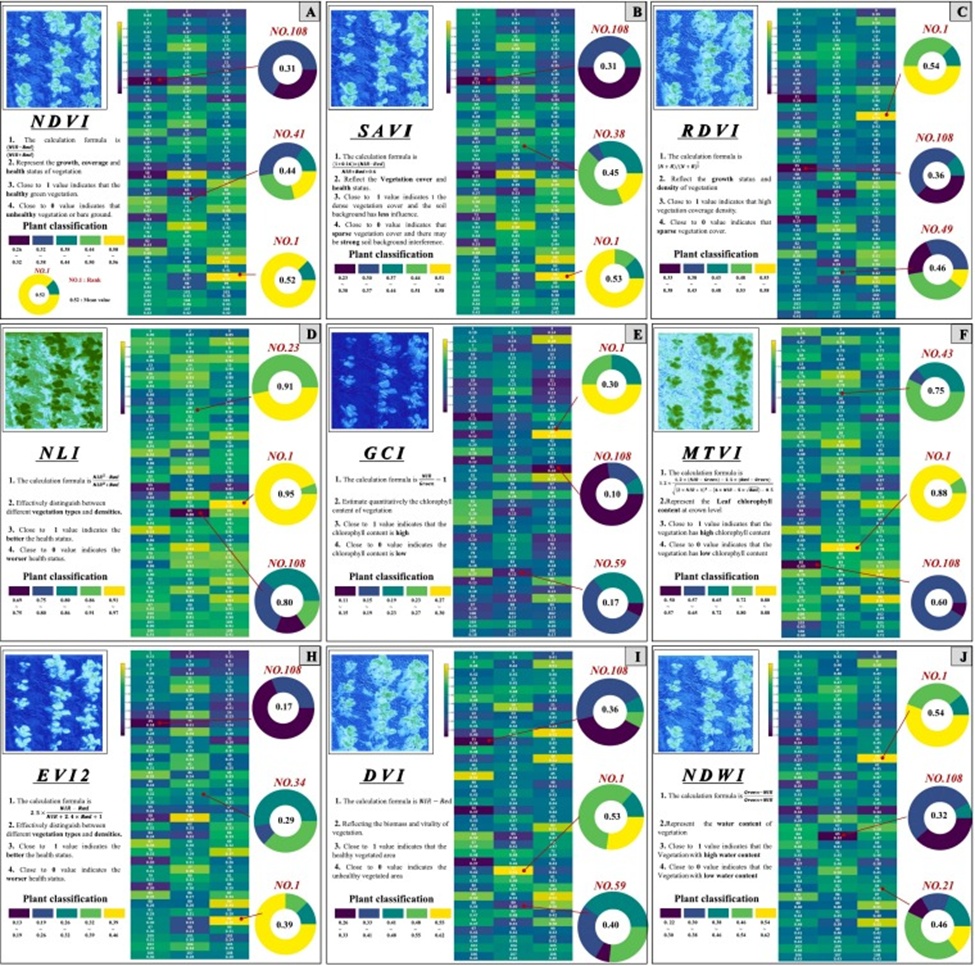
Figure 13. Nine vegetation indices obtained based on MSNet. A-J represent NDVI, SAVI, RDVI, NLI, GCI, MTVI, EVI2, DVI, and NDWI, respectively. In the legend, the indice of each variety is obtained from the average of rapeseed indices within the variety. Rapeseed classification was conducted using an equidistant categorization into five classes to display differences in various indices at the plant level. The rings represent the proportion of rapeseed plants of different grades within the variety under each indice.
Concentrating on the NDVI segment of Figure 13, Variety ZN6–2836 returned the loftiest average, a potential reflection of a more favourable health profile [40], as evidenced in Figure 13.A. The varietal orderings generated by SAVI, EVI2, and NDVI were largely concordant, a result attributable to the kinship among their computational definitions in close-range, near-ground remote sensing conditions, as seen in Figures 13B and 13H. That said, when tasked with sorting individual plants within a given variety, these three indices diverged, and NDVI highlighted the largest contingent of premium-grade individuals, thereby illustrating the discriminatory power that distinct vegetation indices can exert at the single-plant level. For RDVI, NDWI, and GCI, the peak average was attained by Variety Zao-5, implying that under the algebraic logic of these three particular indices, Variety Zao-5 stands apart as an elite cultivar, as portrayed in Figures 13.C and 13.J. This suggests that Variety Zao-5 may harbour the richest chlorophyll pool [41]. NLI and MTVI, two indices esteemed for their precision in LAI retrieval under dense canopy conditions [42], saw Varieties Zouma and ZS11 rise to the top; both were broadly relegated to the topmost class, hinting that these two varieties might bear the largest leaf area indice, as Figures 13.D and 13.F indicate. In summary, extracting vegetation indices with VINet provides a holistic, multi-perspective evaluation of rapeseed varieties, delivers operational guidance for farm-level decisions, and adds substantive value to breeding-related investigations.
As a key winter crop, rapeseed undergoes normal growth and ontogenetic progression while ambient temperatures remain within a 5 °C to 30 °C envelope. A decline below 5 °C arrests aboveground growth, exposing the crop to frost injury, which subsequently depresses yield [1]. Identifying frost-tolerant rapeseed genotypes is therefore a pursuit of considerable consequence. Over the period from January 7 to January 10, 2024, the rapeseed stand endured a freezing low-temperature spell during the overwintering phase, as recorded in the temperature time series in Figure 14A. A comprehensive frost damage inventory was conducted on all varieties on January 11, 2024, with injury severity binned into four classes, as depicted in Figure 14B. The binning criteria are: (1) Very light: Entire plant devoid of yellowing, no frost kill or wilting apparent; (2) Light: Only isolated leaf yellowing and frost kill; (3) Moderate: Leaf yellowing and frost kill are present on some leaves, yet the main axis remains relatively green; (4) Severe: Nearly all leaves display yellowing and frost kill.
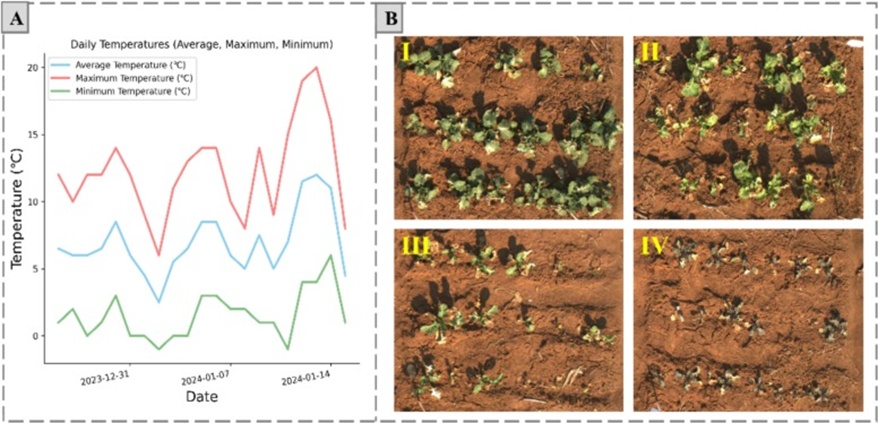
Figure 14. Weather conditions and Rapeseed at four levels of frost damage. I-IV corresponds to frost damage levels (1) to (4).
To explore how different vegetation indices relate to rapeseed cold hardiness, all rapeseed individuals belonging to a single variety were assigned the same rating by expert judgement. The nine vegetation index values for rapeseed were next arranged in increasing order, and the span bounded by the smallest and largest value within a single grade was taken to constitute a classification interval, allowing the positioning of each grade label to be examined. A quantitative overlap rate expression was formulated to accentuate the intersection between two adjacent grades, given in Eq. 17.
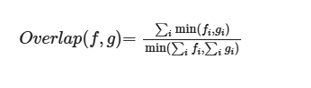 (17)
(17)
Within this formulation, i indexes the frost damage grade interval under consideration; the term in the numerator tallies the concurrent incidence of both grades inside the i‑th interval, capturing their zone of overlap. The denominator sums the overall frequency across the two grades—the smaller the result, the less overlap there is. A lower overlap rate indicates stronger index performance in separating rapeseed frost-damage categories. The overlap rate values computed for the nine vegetation indices are assembled in Table 6.
Table 6. Overlap rate of different indices in frost damage classification.
Vegetation Indices | Overlap3–4 | Overlap2–4 | Overlap2–3 | Overlap1–4 | Overlap1–3 | Overlap1–2 |
NDVI | 23.83% | 5.96% | 30.59% | 0.00% | 3.06% | 27.01% |
SAVI | 23.83% | 5.96% | 30.59% | 0.00% | 3.06% | 27.01% |
RDVI | 57.51% | 37.31% | 67.29% | 14.51% | 32.71% | 49.69% |
NLI | 57.51% | 39.90% | 74.82% | 22.54% | 48.00% | 66.80% |
GCI | 61.92% | 49.74% | 70.12% | 25.65% | 37.65% | 53.20% |
MTVI | 60.10% | 45.08% | 73.41% | 39.38% | 62.82% | 71.75% |
EVI2 | 13.99% | 4.40% | 13.88% | 0.00% | 1.65% | 9.28% |
DVI | 67.36% | 48.19% | 76.24% | 22.80% | 42.35% | 58.76% |
NDWI | 52.59% | 28.50% | 61.88% | 12.18% | 28.24% | 47.84% |
To present with greater immediacy how strongly each vegetation index associates with rapeseed cold tolerance, the study also generated a histogram of frost damage grades, shown in Figure 15. Rapeseed plants with a common frost damage rating are rendered in a single colour. Four percentile landmarks—5%, 10%, 90%, and 95%—are chosen as partitioning thresholds to indicate grade demarcations. A near-ideal vegetation indice would segregate rapeseed across grades with high clarity, and the inter-grade lines would lie in tight proximity.
What Figure 15 makes considerably clearer is that the capacity of EVI2 to capture rapeseed cold tolerance far outstrips that of the remaining vegetation indices. The correct grade was assigned to virtually every rapeseed plant, and the separating thresholds for consecutive grades sat very close to one another. Furthermore, this observation may chime with the findings of [43], who undertook sensitivity trials of vegetation indices for leaf area indice and stem area indice across snow-covered landscapes, hinting that EVI2 yields a more faithful picture of plant physiological status under cold stress conditions. Beyond this, the result provides a candidate quantitative criterion for grading frost injury in rapeseed. In circumstances where distinguishing the frost-damage severity of two plants by eye proves challenging, the EVI2 index could serve as a proxy for physiological measurement instrumentation. Broadly speaking, larger EVI2 readings tend to be linked with lower frost damage severity.
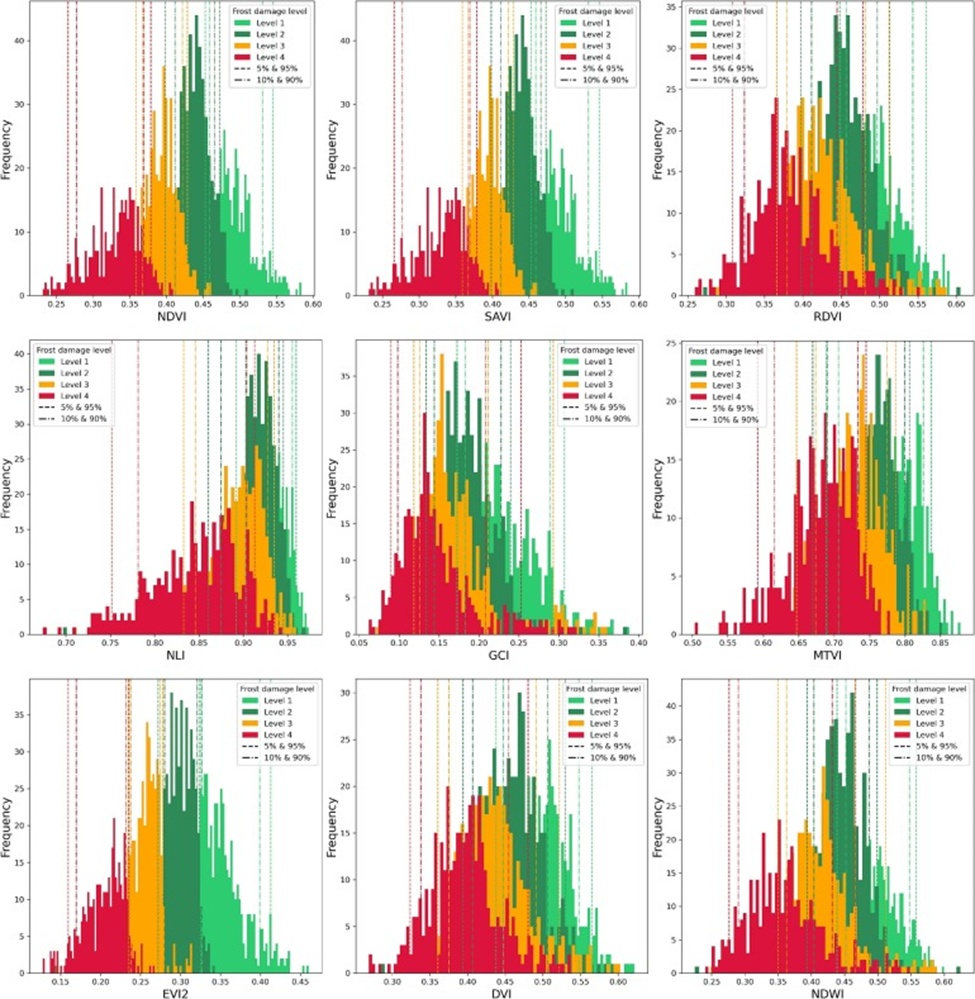
Figure 15. Histogram of frost damage classification for different vegetation indices.
The contribution of the present work lies in formulating an RGB-NIR multi-modal instance segmentation framework that builds upon YOLOv11n-seg, spanning both the straightforward connection-fusion MSNet family and the MSNet-HAFB family that embeds the HAFB module. For each of these two families, a triad of fusion strategies was devised: early, middle, and late merging. Evidence from ablation trials demonstrates that when basic connection fusion is employed, merging at the early or middle stages meaningfully improves model efficacy compared to scenarios that use only RGB or only NIR inputs, while markedly compressing the model’s parameter count. Switching to the MSNet-HAFB configuration, all three fusion strategies surpass the original Concat operation and established multi-modal cross-attention fusion approaches, thereby thoroughly validating the architectural merits and practical utility of the HAFB module in multi-spectral feature fusion settings.
In head-to-head evaluation against a collection of strong RGB-only instance segmentation benchmarks, the trio of fusion strategies within the MSNet-HAFB model consistently occupied either the leading position or the runner-up slot across the evaluation board, further substantiating the inherent promise that RGB-NIR multi-modal spectral detection networks may hold over classic RGB-only image detection networks when it comes to sensing crop targets. Beyond providing empirical grounding for the engineering of multi-modal perception architectures, this outcome also serves as a compelling reference for scholars active in agricultural intelligent sensing.
Through an applied lens, a point worth particular notice is that, in every experiment reported, middle fusion consistently achieved the optimal balance between detection fidelity and parameter thrift, highlighting its even-handed advantage in reconciling representational richness with computational frugality. Consequently, this work advocates that middle fusion be given precedence as the modality-merging blueprint for future natural-field crop multi-modal instance segmentation endeavors to enable sounder crop management decisions.
In the vegetation index case study, it was also observed that the varieties ZN6–2836, Zao‑5, Zouma, and ZS11 stood out as superior across multiple evaluative lenses, signalling their potential as elite cultivars. Starting from a rudimentary manual frost injury classification, a grading exercise centred on winter rapeseed seedlings at advanced growth stages was conducted, drawing on nine vegetation indices. The data revealed that, among the indices examined, EVI2 showed the greatest ability to separate frost-damage levels in rapeseed, with its maximum overlap rate barely exceeding 1.65%, a finding that provides a solid reference for scheduling winter warming operations.
That said, MSNet is not devoid of shortcomings. These include contrast fluctuations affecting NIR or RGB captures due to shifting illumination geometry, as well as the difficulty of distinguishing individual plants as leaf canopy overlap becomes dense in later crop growth stages. Looking ahead, dataset expansion could be pursued by incorporating multi-modal spectral data collected under varied lighting conditions and from later-season crops to harden the trained model against real-world variability. A further limitation is that this inquiry confined itself to a single year’s worth of multi-spectral crop area data and did not venture into advanced mathematical treatment. Future studies could amass multi-season observations and undertake more intricate vegetation phenotyping model computations.
AP: Average precision of object detection model, %
mAP: Mean average precision of the object detection model, %
P: Precision of object detection model, %
R: Recall of object detection model, %
TP: True positive, which means the number of correctly detected objects
FN: A false negative means the number of missed or undetected objects
FP: False positive, which means the number of falsely detected objects
RGB: Red, Green, and Blue
NIR: Near-Infrared
NDVI: Normalized Difference Vegetation Indices
SAVI: Soil-Adjusted Vegetation Indices
RDVI: Renormalized Difference Vegetation Indices
NLI: Normalized Leaf Indices
GCI: Green Chlorophyll Indices
MTVI: Modified Triangular Vegetation Indices
EVI2: Two-Band Enhanced Vegetation Indices
DVI: Difference Vegetation Indices
NDWI: Normalized Difference Water Indices
API: Application Programming Interface
ROI: Region Of Interest
CNi: The I-feature layer of the NIR channel
Cri: The I-feature layer of the RGB channel
YOLO: You Only Look Once
SGD: Stochastic gradient descent
IoU: Intersection over Union
This work was supported by the National Natural Science Foundation of China (32372003); Anhui Provincial University Outstanding Youth Project (2022AH030090); Anhui Agricultural University College Students’ Innovation and Entrepreneurship Training Program (202410364037).
None
None
None
Open Access The author(s) retain copyright. This article is licensed under the Creative Commons Attribution-NonCommercial-ShareAlike 4.0 International License. It may be shared and adapted for non-commercial purposes with appropriate attribution, an indication of changes, and distribution of adaptations under the same license. Third-party material may be subject to separate terms identified in its credit line. View the license at https://creativecommons.org/licenses/by-nc-sa/4.0/.
 Agro Intelligence Research Press