Agricultural output and the assurance of food supplies depend fundamentally on plant breeding. A new chapter in this field has been opened by Genomic Selection, a technology distinguished by its power to exploit variation across the entire genome for predictive purposes. This technique makes it unnecessary to have pre-existing knowledge of the genes controlling particular characteristics. Yet, the enormous scale of genomic information, contrasted with the usually scarce set of phenotypic observations, frequently leads to the “curse of dimensionality,” in which classic statistical approaches, machine learning, and deep learning architectures tend to memorize noise rather than learn patterns, yielding poor predictive performance. To address this barrier, we propose a consolidated Variational auto-encoder-based Multi-task Genomic Prediction model (VMGP) that fuses a self-supervised process of shrinking and rebuilding genomic data with several simultaneous forecasting objectives. This method provides a durable solution, offering a powerful inferential engine that has undergone rigorous verification across publicly available datasets for wheat, rice, and maize. The model we have built displays extraordinary proficiency in forecasting across multiple phenotypes and varying environments, effectively mastering the challenges of genomic selection spanning different populations and highlighting its distinct capabilities and practical importance. In addition, by fusing VMGP with tools for model transparency, we can efficiently sift through and prioritize influential single-nucleotide polymorphisms, thereby boosting prediction accuracy and putting forward avenues for potentially more economical genotyping workflows. The VMGP framework, characterized by its clean design, strong forecasting capabilities, and publicly accessible source code, is well-suited for widespread rollout across plant breeding operations. It proves especially valuable for practitioners whose main focus is phenotypic projection, yet who might not be deeply versed in deep learning methodologies or the intricacies of hyperparameter optimization.
The drive to reinforce global food security has acquired an unprecedented level of urgency, with the looming reality of a swelling human population forecast to reach 9.7 billion by the mid-century mark [1-3].This increase in numbers is exacerbated by a cluster of ecological and societal pressures, including the erosion of arable land, diminishing freshwater reserves, erratic weather patterns, and shifting social fabrics [4, 5]. Within this framework, plant breeding plays a pivotal role, one that must grapple with the layered demands of increased yield, superior quality, and enhanced resistance to environmental stresses [6-8].
Looking back, the exploitation of records concerning observable traits, lineage, and field performance spurred notable progress in crop cultivars over the course of the 1900s [9]. Given that the traits targeted by breeders are often underpinned by quantitative trait loci (QTLs), genomic selection (GS) has emerged as a pioneering approach. This strategy taps into the expansive pool of whole-genome variability to build models for genomic forecasting, sidestepping the need first to pinpoint the genes underlying a trait. It carries the pledge of a revolutionary influence on plant breeding through the compression of selection timelines and the enhancement of selection accuracy [10-19].
The conception of GS can be traced to its adoption in the livestock sector, where it played an essential part in calculating the genetic merit of young bulls that had not yet been phenotypically evaluated [20].This initial breakthrough has since given rise to a rich diversity of statistical and algorithmic instruments customized for GS. The toolkit encompasses genomic best linear unbiased prediction (GBLUP), ridge regression-best linear unbiased prediction (rrBLUP), an array of Bayesian frameworks like BayesA, BayesB, and BayesCπ, alongside machine learning procedures such as random forest (RF), support vector regression (SVR), and the light gradient boosting machine (LightGBM) [14, 20-26]. These techniques have been effectively used in a multitude of plant and animal improvement schemes, delivering meaningful genetic gains.
Deep learning (DL), regarded as the premier solution within the disciplines of human language understanding, machine vision, and the fusion of varied data types [27-30], has been brought into the GS sphere with the ambition of sharpening the predictability of genotype-to-phenotype mappings. DL-oriented GS techniques typically deploy layered neural network components (e.g., dense or convolutional structures) to parse genomic input, paired with nonlinear activation units and other mechanisms to decode additive, dominant, and interactive genetic effects embedded in the data. On a theoretical level, these architectures are poised to outperform the forecasting power of older-style statistical tools such as mixed linear models. Despite this, real-world evidence suggests that DL frameworks have yet to reach parity with the outputs of GBLUP or rrBLUP in applied settings [31-33].
In the archetypal GS workflow, the genetic markers and observable traits of a training cohort are systematically documented, and a GS engine is calibrated on these records to learn the mapping between genetic code and organismal traits within that group. Once trained, the engine then projects the traits of a target cohort (the testing set) by processing their genetic markers as the sole input. The breadth of input attributes is exceptionally wide, spanning tens of thousands to millions of single-nucleotide polymorphisms (SNPs), depending on the genotyping platform used [14]. By comparison, the training population’s headcount is frequently small, ranging from a few hundred to a few thousand, a limitation imposed by the drawn-out cycles and the high costs associated with trait measurement. This “curse of dimensionality” (CoD) constitutes a significant barrier in GS, where legacy statistical or machine learning paradigms, and even DL constructs, are apt to overfit the training data, resulting in weak generalizability and poor forward predictive ability [15].
Auto-encoders (AEs), which leverage the innate capacity for self-supervised learning in genomic sequences, have proven their utility in the clinical setting for addressing the CoD. Particular configurations such as denoising auto-encoders and variational auto-encoders (VAEs) have served as vital tools in the examination of oncological genomic profiles, allowing for the condensation of feature spaces, the discrimination of cancer subtypes, and the estimation of disease trajectories [15, 34-36]. Beyond this, strategies built upon AE architectures have been advanced for the dissection of single-cell multi-omics datasets, targeting a range of operations including latent space projection, cell grouping, technical artifact removal, data gap filling, and graphical depiction [30, 37-39]. AEs possess a clear superiority over classical feature reduction procedures, such as principal component analysis, by virtue of their ability to unearth the intrinsic organization of data without demanding predefined measures of relatedness or metric spaces within the original data domain [15, 37]. The positive outcomes of these explorations emphasize the applicability of AEs for manipulating genomic datasets. The VAE blueprint builds upon basic AE designs by incorporating a stochastic architecture, a latent layer constrained by Gaussian priors, and a reparameterization-based sampling technique. This setup enables competent handling of unfamiliar genetic variants arising in GS settings while simultaneously curbing overfitting by deliberately injecting variability into the compressed representations. It was these defining features that prompted its selection as the central building block for the present work. That said, the deployment of AEs has remained largely within the confines of single-cell multi-omics investigations, with only sparse penetration into organism-level or demographic-scale genetics, most notably within the realm of genomic selection in plants.
The mapping between genotype and phenotype is marked by deep-seated variability, with uneven dispersion patterns across distinct groups. As a direct result, GS frameworks are habitually calibrated within narrowly defined cohorts to target single phenotypic outputs in a disconnected fashion [14, 40]. The undertaking of formulating a generalized model that bridges separate populations and simultaneously addresses a suite of phenotypes is anything but straightforward. The phenomenon of genetic pleiotropy, in which a single genetic locus affects multiple disparate traits by participating in a network of biosynthetic and metabolic circuits, is a common biological reality [41]. Population-spanning genetic congruence stems from retained blocks of linkage disequilibrium, homologous gene architecture and biological roles, parallel regulation of transcription, polygenic underpinnings, and conserved higher-order chromatin organization and epigenomic marks [42- 44]. These elements provide the biological justification for our multitask learning paradigm applied to GS, which constitutes a harmonized modeling construct that jointly accommodates interdependencies among multiple phenotypes, genotype-by-environment interactions, and genetic substructures spanning populations, thereby harnessing overlapping biological signatures through the cooperative fusion of orthogonal data dimensions. A deeply stacked neural network architecture can exploit commonly held network strata to distill generic patterns across diverse objectives, while branches reserved for task specifics can be sculpted to accommodate the singular distributions of different characteristics, the modulation of genetic effects by surroundings, and the variation in gene activity observed between populations.
To directly address these impediments, we have architected a consolidated Variational auto-encoder-based Multi-task Genomic Prediction (VMGP) model, purpose-built for plant genomic selection (GS). The VMGP framework distinguishes itself by its ability to assimilate the compact, low-dimensional signature of genomic inputs effectively. This feat is achieved through self-supervised learning cycles that involve distilling and subsequently restoring the input data, a process orchestrated by the VAE component. Through this operation, the model successfully distills the fundamental informational content woven into the DNA sequences. Drawing upon this compressed genotypic blueprint, coupled with a restricted set of multidimensional phenotypic measurements, the VMGP construct can be conditioned to execute a cohesive, multi-objective phenotype-projection engine. Such an integrated perspective not only facilitates a deep dissection of the convoluted ties binding genotypes to resultant traits but also harmonizes the covariance structures threading through multiple inferential targets. As an added benefit, it increases the effective data volume feeding the communal backbone for each distinct predictive channel, thereby markedly strengthening the system’s overall robustness and reliability.
The VMGP framework has consistently outstripped the performance of contemporary benchmark standards, among them rrBLUP [23], BayesA, RF, deep neural network for genomic prediction (DNNGP) [40], and Cropformer [19], when subjected to a broad cross-section of open-access data resources for maize, rice, and wheat spanning multi-phenotype, multi-environment, and cross-population GS scenarios. This comparative edge is secured within a singular, uniformly parameterized architecture, thereby showcasing the remarkable generality and plasticity of the VMGP model.
The elevated prediction fidelity delivered by VMGP provides validation of its ability to decode the subtle and complex interdependencies between genotype and phenotype. The model’s accessibility-oriented interface and broad-spectrum efficacy are worthy of particular emphasis, as it consistently delivers dependable forecasting outputs without the necessity for structural overhauls and meticulous hyperparameter tuning that are customarily obligatory in traditional deep learning pipelines.
The current investigation drew upon four expansive data compilations covering three distinct organisms and spanning a range of cohort sizes: rice299, wheat599, wheat2000, and maize4505.
The rice299 assembly, sourced from the irrigated rice improvement scheme of the International Rice Research Institute [45], comprises 299 rice accessions delineated by 73,147 SNP loci and a quartet of phenotypic measures, specifically plant height (PH), grain length (GrL), grain width (GrW), and yield (YLD).
The wheat599 assembly is an amalgamation of 599 archival wheat cultivars from the International Maize and Wheat Improvement Center (CIMMYT) Global Wheat Program [40]. Following quality filtering steps, each cultivar was genotyped at 1279 SNP loci and evaluated for yield (YLD) across four distinct agroclimatic environments.
The wheat2000 assembly comprises 2000 Iranian landrace populations of bread wheat from the CIMMYT wheat germplasm repository [40]. These genetic stocks underwent genotyping at 33,709 SNP loci and were appraised against six phenotypic criteria: thousand-grain weight (TGW), test weight (TW), grain length (GrL), grain width (GrW), grain hardness (GrH), and grain protein (GrP).
The maize4505 assembly is a collection of 4505 maize recombinant inbred lines derived from 25 nested subcohorts of the USNAM panel [46]. Each line was genotyped with a high-density panel of 106,944 SNP loci and examined with respect to five phenotypic metrics: days to pollen (DTP), days to silking (DTS), ear height (EH), hundred kernel weight (HGW), and plant height (PH).
The rice299, wheat2000, and maize4505 collections were deployed in multi-phenotype projection experiments, whereas the wheat599 collection was reserved expressly for multi-environment projection experiments. Attributable to the elaborate sub-cohort delineation inherent in the maize4505 collection, it proved uniquely apt for cross-population projection experiments. To successfully navigate this layered scenario, we conducted supplemental interpretable learning procedures to evaluate feature relevance and perform an initial SNP screen for this collection.
In the present study, we put forth the VMGP model, a pioneering architectural paradigm engineered to overcome the obstacles outlined in the Introduction by integrating self-supervised genomic reconstitution with a suite of simultaneous inferential targets. The VMGP blueprint is structurally decomposed into four discrete yet reciprocally reinforcing sub-units: the Encoder, Sampler, Decoder, and Predictor (Figure 1), which operate in concert to supply unmatched inferential performance spanning a multitude of phenotypes, growth settings, and genetic backgrounds.
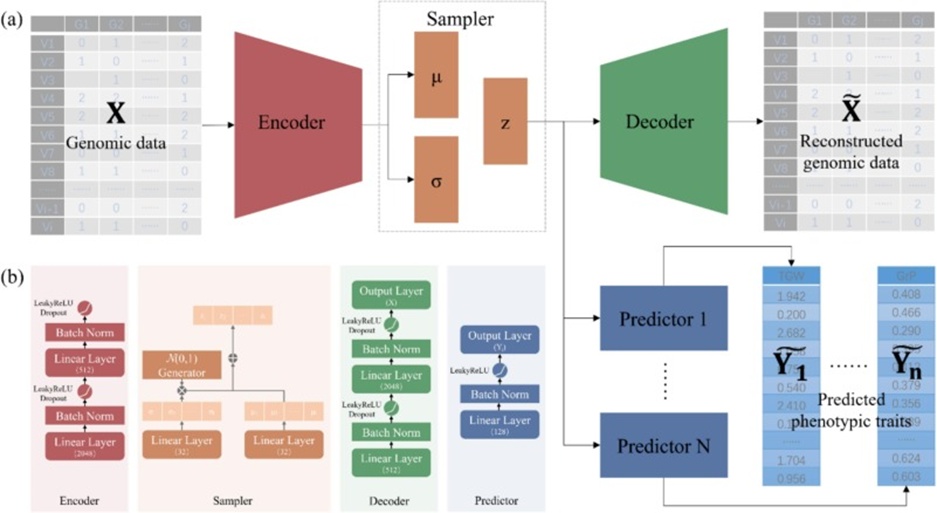
Figure 1. Framework of the proposed variational auto-encoder-based multi-task genomic prediction (VMGP) model: (a) The VMGP model is composed of four subunits: Encoder, Sampler, Decoder, and Predictor. The genomic data X is supplied as input to the model, which is then subjected to condensation and restoration within the Encoder, Sampler, and Decoder sub-units, respectively. The consequent restored genomic data is signified as X∼. The derived latent genotype embeddings emerging from Sampler are thereafter consumed by Predictor to project phenotypic characteristics, which are signified as Y∼. (b) The internal structure diagram of Encoder, Sampler, Decoder, and Predictor.
Encoder and Sampler modules operate as communal processing units that accept the categorically encoded, binary-format genomic input X (denoting SNP genotypes as [0,1,2]) to fulfill the twin objectives of genomic restoration and multiple inferential tasks. Let n signify the quantity of plant specimens, and nX indicate the count of genomic descriptors. The incoming genomic matrix X is consequently arranged as an array in R^ (n×nX) to embody the correspondences between specimens and descriptors.
The purpose of the Encoder unit is to compress the expansive genomic input into a sparser digest, thereby streamlining the effective retention of salient motifs. This boiled-down digest serves as the foundation for both objectives, providing a potent summary of genotypic content. The Encoder integrates two densely wired blocks, with each block housing a dense layer, a normalization layer operating over mini-batches, an activation layer deploying the Leaky ReLU nonlinearity,1 and a stochastic deactivation layer. These strata follow one another sequentially, reshaping the descriptor dimensionality from nX to d1 and thereafter to d2.
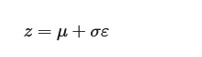
The Sampler fabricates stochastic draws stemming from the digested encoding by employing two narrow passage layers, which squeeze the encoded signal further into a central tendency vector μ alongside a dispersion vector σ. These dual vectors collectively parameterize a Gaussian law N(μ,σ) that dictates the latent stochastic quantity z given an observed instance x. The resulting law, termed q(z|x), represents the approximate variational distribution internalized by the framework. To render the model amenable to gradient-based optimization via backpropagation, the reparameterization trick is invoked, encompassing two sequential moves:
A random perturbation ε is sampled from a canonical Gaussian N(0, I), where I corresponds to the identity array.
The realization is then constructed via:
 (1)
(1)
Reparameterizing the Gaussian law in this manner grants the Sampler the capacity to issue l-dimensional stochastic draws from the digested signal while still permitting gradient flow backward throughout the learning phase. This, in turn, allows the architecture to internalize a semantically coherent representation of the supplied observations and to fortify its capacity for generalization to unseen instances.
Turning to the genomic restoration branch, the output stream leaving the Sampler is routed toward the Decoder unit. The architecture then harnesses the stochastic draws z to synthesize a reconstruction of the genomic array X˜. Such reconstruction ensures that the architecture captures the core scaffold and the regularities permeating genomic observations, providing a robust footing for reliable inference. The Decoder is architected from a pair of densely wired blocks and a concluding linear projection, assembled in an inverse configuration to the Encoder, morphing the dimensionality from l up to d2, then to d1, and lastly to nX.
Running alongside, the inferential pathways branch apart as they source the digested signal emanating from the Sampler to supply their respective specialized Predictors. Each Predictor is individually molded to serve a dedicated inferential target, equipping VMGP to confront a diverse array of predictive problems beginning from a mutually shared, compact genomic imprint. Every Predictor subsumes two core building blocks: densely wired blocks purged of the stochastic deactivation layer, together with a linear projection terminus, architected to remap the dimensionality from l to d3, and onward to the prescribed output domain. The inferential goals pursued in the present investigation center on the regression of continuously varying quantitative characters, for which the output domain typically reduces to a scalar magnitude. In alignment with this, each Predictor is configured to emit a single-valued output corresponding to the projected attribute.
The presented VMGP architecture enforces a streamlined, invariant parameterization (namely, 2048, 512, 128, and 32 assigned to d1, d2, d3, and l, respectively) as it operates across heterogeneous GS scenarios, including multi-phenotype, multi-environment, and cross-population inference. This design philosophy ensures ease of practical deployment while preserving excellent suitability for large-scale dissemination and routine application within plant breeding programs, offering particular benefit to practitioners who emphasize the accuracy of trait forecasts but lack deep specialization in configuring deep learning topologies or fine-tuning hyperparameters.
The aggregate loss formulation underpinning the VMGP architecture, consonant with its holistic design, undergoes a clean bisection into a pair of principal constituents: the penalty arising from the restoration pathway and the penalty arising from the forecasting pathways, as formalized in Eq. 2:
 (2)
(2)
Where α functions as the balancing hyperparameter that governs the relative contribution assigned to the two pathways.
The restoration penalty itself emerges from a combination of two indispensable ingredients:
Matrix discrepancy: This term captures the extent of mismatch between the synthesized array X˜ and the authentic genomic input X. Its role is to drive the reconstructed output as close as possible to the original, thereby enforcing reproduction fidelity.
Kullback-Leibler (KL) divergence: This measure quantifies the dissimilarity between two probability distributions. In the present setting, it contrasts the approximate posterior governing the low-dimensional encoding Z against a prior anchored to the authentic observations. The KL component is critical to ensuring that the approximate posterior mirrors the intrinsic statistical structure of the original observations, even as it collapses dimensionality.
The formal statement of the restoration penalty appears in Eq. 3:
 (3)
(3)
Where MSE denotes the element-wise mean squared discrepancy between arrays, and DKL signals the KL metric computed across distributions. By weaving these two ingredients together, the restoration penalty jointly appraises the verisimilitude of the reconstructed output vis-à-vis the input and the degree to which the low-dimensional encoding preserves the informational content, thereby adjudicating a compromise between reproduction exactness and dimensional compaction.
The forecasting penalty aggregates the individual penalties summed over the complete set of inferential tasks. As a rule, regression-type tasks are supervised via the MSE loss, whereas classification-type tasks draw guidance from the cross-entropy loss. In view of the fact that every inferential task within the present study falls under the regression umbrella, the consolidated forecasting penalty takes the form given in Eq. 4:
 (4)
(4)
Proceeding to the fitting stage for the VMGP architecture, we deployed the aforementioned loss function, adjusting its parameters to the genotypic and phenotypic observations from the training cohort. Once fitting concludes, the genotypic observations from the testing cohort are propagated through the model to determine their imputed phenotypic outcomes. The end-to-end fitting and inference pipeline is concisely captured in Algorithm 1 (VMGP), providing a disciplined, internally consistent procedural flow. Every experimental run adhered to a uniform fitting protocol incorporating 200 epochs, a mini-batch cardinality of 32, and a learning step size of 0.0001. For both multi-phenotype and multi-environment prediction settings, a 5-fold cross-validation procedure was employed. Each assembled dataset was stochastically partitioned into 5 non-overlapping partitions, and each partition was subjected to 5 independent runs. In each run, 4 partitions were used for parameter fitting, and the reserved partition was used for performance evaluation. Regarding cross-population prediction, a structurally analogous 5-fold cross-validation was conducted at the sub-population level. The maize4505 assembly was stratified into 5 folds according to sub-population provenance; in each iterative round, 4 folds were used to fit the model parameters, while the remaining fold was used for evaluation.
SHAP represents an explainable inference methodology for assessing feature importance, anchored in the principles of cooperative Game theory [30, 47]. It yields interpretable narratives, coupled with graphical renderings, by assigning a numerical score to each feature’s contribution to the model’s output predictions, thereby helping uncover the decision mechanisms behind the model’s forecasts. The foundation of SHAP lies in the Shapley value, which is used to allocate contributions in coalitional games. When placed alongside more conventional schemes for gauging feature saliency, SHAP provides richer, more nuanced information, since it accounts not only for the marginal effect of an isolated feature but also for the joint effects arising from feature interactions. Such joint effects carry substantial consequences within intricately structured models, seeing that synergistic relationships spanning multiple attributes can appreciably modulate the resulting predictions. Through the application of the SHAP procedure, the contribution attributable to each SNP in shaping the forecasts of diverse phenotypic characters issuing from VMGP can be decomposed as follows:
 (5)
(5)
Where Shapleyj stands for the Shapley valuation tied to the j-th SNP (j∈1,…,nX), F signifies the full ensemble of SNPs contained within X while S designates a sub-ensemble drawn from F, |⋅| counts the members belonging to the respective ensemble, F\{j} indicates the operation of excluding the j-th feature from the ensemble F, S∪{j} is the combined ensemble formed from S along with j, and f denotes the inferential mapping realized by VMGP. The resulting Shapley valuations are instrumental in acquiring insight into the magnitude of each SNP’s contribution to the final imputed phenotypic values.
Making recourse to a pre-selection data pool (denoted ps), which contains a randomly drawn 10% subset of the specimens comprising the maize4505 compilation, a refined subset of salient SNPs (Gps) can be identified through explainable learning aimed at analyzing feature importance. This pre-selection workflow unfolds across three stages, as elaborated in Algorithm 2, SNPs pre-selection:
Fit the VMGP network drawing upon the pre-selection pool (Xtrain and Ytrain).
Derive Shapley valuations across the full spectrum of specimens and SNPs with respect to each phenotype, and accumulate the Shapley valuations first by specimen and then by phenotype.
Isolate a subset of SNPs ranked by their accumulated Shapley valuations.
This pre-selection pipeline serves not only to reduce the dimensionality of the genomic dataset but also to focus attention on SNPs most relevant to the phenotypes of interest. It has the potential to tangibly improve the quality of subsequent inferential analyses, rendering the extracted SNP subset a meaningful asset for efforts such as gene functional dissection, affordable genotyping strategies, and additional avenues of scientific inquiry.
The present study puts forward the VMGP architecture while deliberately abstaining from elaborate tuning of hyperparameters, relying instead on a fixed, universally applied set of structural choices (that is, 2048, 512, 128, 32 mapped respectively onto d1, d2, d3, and l) together with a single suite of learning configurations (specifically, 200, 32, 0.0001, 0.5 corresponding to the epoch budget, mini-batch size, learning rate, and loss-balancing coefficient, in that order). Despite such a restrained design, VMGP has yielded leading outcomes across a range of crop collections (Figures 2, 3, and 5), surpassing the current generation of top-tier techniques.
The comparative assessment drew from a lineup of five established reference approaches: rrBLUP and BayesA, a pair of prominent statistical formulations shown in numerous contexts to exceed the predictive fidelity of machine learning as well as deep learning alternatives; RF, a flexible machine learning methodology rooted in the logic of ensembling, esteemed for its pliancy and forecasting potency; DNNGP and Cropformer, representing two modern deep learning pipelines tailored for genomic selection that have registered impressive prognostic results across multiple data compilations.
In the interest of a balanced contest, approaches lacking native support for simultaneous multi-target inference underwent independent fitting and scoring for each attribute or growth setting. The quality of the forecasts was subjected to exacting scrutiny through two dependable yardsticks: correspondence strength, expressed via the Pearson correlation linking projected values with empirically recorded measurements (referred to as Accuracy); and deviation magnitude, expressed via the mean absolute departure of projected values from empirically recorded measurements (referred to as MAE), with the entire procedure embedded within the disciplined framework of a 5-fold cross-validation design.
Among the approaches submitted for competition, RF and DNNGP exhibit strong sensitivity to parameter specification; consequently, we performed a structured exploration of their parameter spaces using a grid search. The best-performing parameterizations identified through this process , along with the resulting forecasting metrics, were subsequently used as the reference results against which the comparators were measured in all subsequent analyses.
We conducted a comprehensive evaluation of the VMGP architecture’s capacity for simultaneous multi-phenotype forecasting across three markedly different collections: wheat2000, maize4505, and rice299.
Within the wheat2000 collection, VMGP eclipsed every comparator in both Accuracy and MAE uniformly across the entire trait spectrum. Expressed numerically, VMGP yielded gains in the neighborhood of 4.0%, 2.0%, 147.8%, 9.3%, and 7.8% for Accuracy, together with declines of roughly 3.6%, 2.3%, 26.6%, 15.6%, and 34.4% in MAE when set against rrBLUP, BayesA, RF, DNNGP, and Cropformer, respectively (Figure 2a).
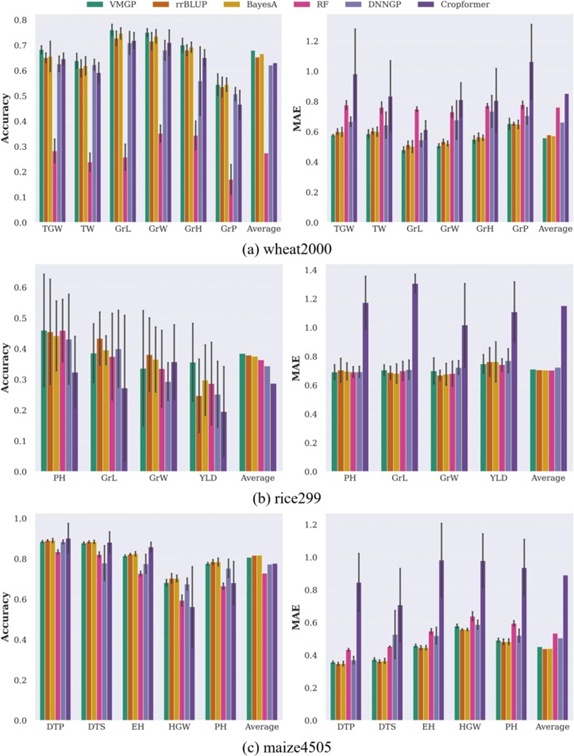
Figure 2. Multi-phenotype prediction accuracy and prediction error of methods built using four different models on three datasets: (a) wheat2000 dataset, (b) Rice299 dataset, and (c) maize4505 dataset. Abbreviations: VMGP = variational auto-encoder-based multi-task genomic prediction; rrBLUP = ridge regression-best linear unbiased prediction; RF = random forest; DNNGP = deep neural network for genomic prediction; TGW = thousand grain weight; TW = test weight; GrW = grain width; GrL= grain length; GrH = grain hardness; GrP = grain protein; PH = plant height; YLD = yield; DTP = days to pollen; DTS = days to silking; EH = ear height; and HGW = hundred grain weight.
Scrutinizing the field of comparators, BayesA occupied the top position in terms of Accuracy for five separate attributes (TGW, GrW, GrL, GrH, and GrP) and additionally led the entire panel in MAE for every attribute measured. DNNGP claimed the premier Accuracy reading for TW, whereas RF failed to reach expected performance levels, with its output ranking substantially below that of the other contenders. This distribution illuminates the heterogeneous predictive aptitudes different algorithms deploy across distinct traits. It is worth observing that DNNGP’s ascendancy for specific attributes depended on trait-by-trait optimization of its hyperparameters. Standing in stark contrast, VMGP’s identical parameter configuration applied uniformly across the entire attribute suite, without any concurrent drop in performance, testifies to the architecture’s stout capacity for generalization. Although Cropformer attained comparatively strong Accuracy among deep learning baselines, it registered markedly inflated MAE readings. This anomaly might trace back to its early-stopping criterion based on accuracy, which could inadvertently promote suboptimal convergence across the model’s loss landscape.
To generate a genuinely equitable comparison with methodologies engineered for single-character inference, we formulated a single-trait counterpart of the proposed architecture, designated VMGP-S, that erects separate forecasting modules for each attribute. The resulting Accuracy and error distributions for VMGP and VMGP-S were essentially superimposable, suggesting that the enhanced character-forecasting ability derives chiefly from the auxiliary regimen of compacting and subsequently restoring the genomic inputs. This operation, mediated through the VAE infrastructure, efficiently surfaces informative reduced-dimensional embeddings of genotype profiles, and parallel fitting across multiple attributes does not materially amplify this process.
To further corroborate this interpretation, we leveraged the VAE backbone to conduct an initial pretraining phase focused solely on extracting low-dimensional representations of the genomic inputs. A brief subsequent stage of only 10 epochs was then used to refine the character forecasting objective alone, leading to the variant termed VMGP-T. The predictive proficiency of VMGP-T remained broadly on par with that of VMGP, with an Accuracy contraction of at most 2.8% and an MAE expansion of 6.6%. These observations collectively indicate that the reduced-dimensional representation emerging from self-supervised fitting to genomic data alone can effectively drive character forecasting, requiring only modest downstream recalibration of phenotype-associated parameters.
Turning to Figure 2b, the results disclosed that VMGP captured the highest mean Accuracy and ranked fourth in mean MAE across the rice299 collection. It is worth noting that rrBLUP outperformed VMGP, specifically in Accuracy, for the characters GrL and GrW. Strikingly, RF—which had fared poorly on the wheat2000 collection—here registered the most favorable mean MAE and placed fourth in mean Accuracy. The rice299 collection shows pronounced hallmarks of the CoD, with an SNP-to-specimen count ratio of 245:1. Reference assessments highlighted that classical statistical frameworks (rrBLUP and BayesA), incorporating domain-aware parametric priors, achieved greater accuracy than conventional deep learning architectures (DNNGP and Cropformer). VMGP constituted a notable departure from this pattern, achieving cutting-edge forecasting performance through its distinct architectural subclass that embeds VAE components. In addition, it yielded MAE metrics that were statistically on par across all five approaches (excluding Cropformer), with the gap between the uppermost and lowermost values amounting to a slender 2.9%. VMGP delivered a material Accuracy boost of 5.7%, 11.8%, and 33.9% vis-à-vis RF, DNNGP, and Cropformer, respectively. When isolating YLD, a trait of overarching significance in the context of plant breeding, the Accuracy achieved by VMGP exceeded that of rrBLUP, BayesA, RF, DNNGP, and Cropformer by margins of 44.2%, 19.5%, 24.3%, 41.4%, and 82.0%, respectively.
The VMGP-T variant underwent a measured Accuracy diminution of 5.2% along with a proportionate MAE swell of 2.4% relative to the base VMGP model. By contrast, the VMGP-S variant achieved an incremental improvement over VMGP, registering a 1.4% accuracy uplift and a 1.1% MAE reduction, thereby distinguishing itself as the top performer across holistic forecasting statistics. These findings suggest that the multitask learning paradigm, fusing VAE-mediated genomic reconstruction with single-phenotype inference, has successfully addressed the GS challenge posed by the rice299 collection. The edge conferred by multi-phenotype collaborative training within VMGP became most evident in PH prediction, where it surpassed VMGP-S, suggesting that joint optimization across multiple phenotypes stands to yield pronounced dividends for select attributes.
Analysis of the maize4505 compilation showed that rrBLUP and BayesA continued to hold the top positions in Accuracy and error for every measured attribute (Figure 2c). VMGP occupied a tight third spot, registering a fractional Accuracy slip of 1.3% and an MAE inflation of 2.8%. The Accuracy attained by VMGP was 10.8%, 4.4%, and 3.9% higher than that of RF, DNNGP, and Cropformer, whereas its MAE was 15.3%, 10.5%, and 49.2% lower than those of the same approaches, respectively.
Both VMGP-S and VMGP-T showed marginally eroded performance relative to VMGP, with Accuracy decrements of 1.0% and 1.3% and MAE increments of 1.2% and 3.3%. Nevertheless, they continued to decisively outperform RF, DNNGP, and Cropformer, further substantiating the potency of the VMGP family of models.
The collective body of evidence derived from these three collections spotlights the inconsistent inferential capacity of various methodologies when navigating distinct traits. It underscores the imperative of aligning methodological choice with the character of interest. The VMGP architecture has demonstrated its advantage in capturing a broad range of characteristics, cementing its role as an adaptable GS tool for breeders intent on charting genotype-to-phenotype linkages across diverse crop types. It provides essential support for forward-looking characterization of diverse attributes across a heterogeneous array of crop genetic resources.
A multi-environment forecasting trial was carried out using the wheat599 compilation, which incorporates harvest records from four distinct agroclimatic settings. The lack of explicit environmental covariates precluded direct parameterization of genotype-by-environment interactions. Even so, the phenotypic footprint left by each setting can be conceptualized as a blend of underlying genetic determinants and latent contextual signals unique to that setting, thereby enabling the problem to be reframed as a particular instance of multi-phenotype forecasting.
Consistent with the multi-phenotype forecasting scheme, VMGP was applied directly to multi-environment forecasting, whereas the comparator approaches were separately fitted and scored for each setting. Forecasting quality was subjected to exacting scrutiny through Accuracy and MAE under a 5-fold cross-validation regimen.
VMGP rose to the top as the leading framework in terms of both forecasting fidelity and deviation (Figure 3). The outputs delivered by rrBLUP and RF remained tightly clustered, exhibiting respective Accuracy erosion of 7.5% and 9.3%, paired with a modest MAE elevation of 3.1% and 4.2% measured against VMGP. The DNNGP approach lagged behind the remaining contenders, while VMGP posted an average Accuracy lift of 15.7% alongside a meaningful 8.5% contraction in error magnitude.
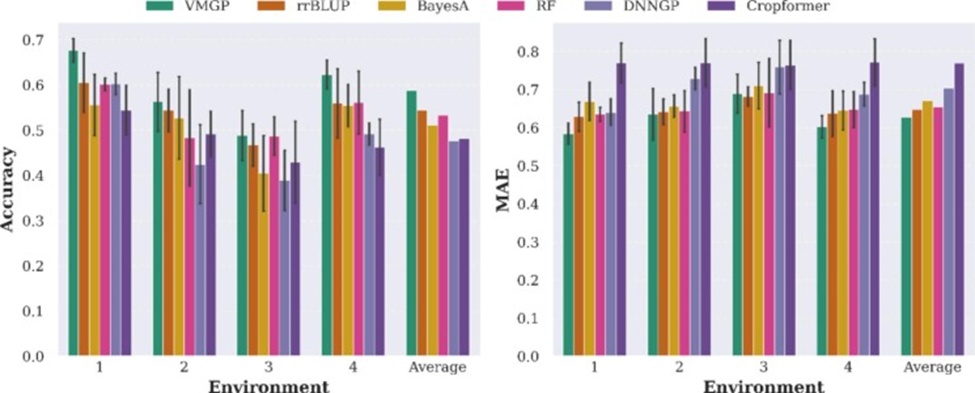
Figure 3. Multi-environment yield prediction accuracy and prediction error of methods built using four different models on the wheat599 dataset. VMGP, variational auto-encoder-based multi-task genomic prediction; rrBLUP, ridge regression-best linear unbiased prediction; RF, random forest; DNNGP, deep neural network for genomic prediction.
The setting-specific variant of the VMGP architecture, labeled VMGP-S, achieved performance on par with rrBLUP, a foremost reference approach. The introduction of cross-setting collaborative fitting within VMGP led to a further Accuracy uplift of 7.9% and an MAE contraction of 4.3% relative to VMGP-S. VMGP-T, even though it was exposed to merely 10 refinement epochs for harvest forecasting, outstripped VMGP-S with respect to average Accuracy and deviation rate. While the stability of VMGP-T’s forecast deviations fell somewhat short of VMGP owing to its compressed fitting schedule for harvest figures, the gains conferred by VAE pretraining and multi-environment assimilation endowed VMGP-T with fortified stability in forecasting fidelity. The body of evidence recited above confirms the potency of the presented integrated VMGP architecture for multi-environment genomic forecasting, further cementing its suitability for broad deployment across the field of plant breeding.
The maize4505 compilation, an amalgam of specimens from 20 separate maize subcohorts, provides a fertile substrate for inquiries into cross-population forecasting. Figure 4a presents a planar rendering of the genomic profiles for these specimens, highlighting the heterogeneous scattering patterns characterizing each sub-cohort. Figure 4b provides a numerical gauge of genetic separation between subcohorts via analysis of the pairwise fixation index (Fst), with magnitudes ranging from 0.230 (Z011 vs. Z024) to 0.345 (Z006 vs. Z010). Beyond this, the phenotypic variability observable across distinct sub-cohorts is shown in Figure 4c, where a tight coupling between DTP and DTS, a pronounced coupling between EH and PH, and a conspicuous decoupling between HGW and the remaining characters are evident.
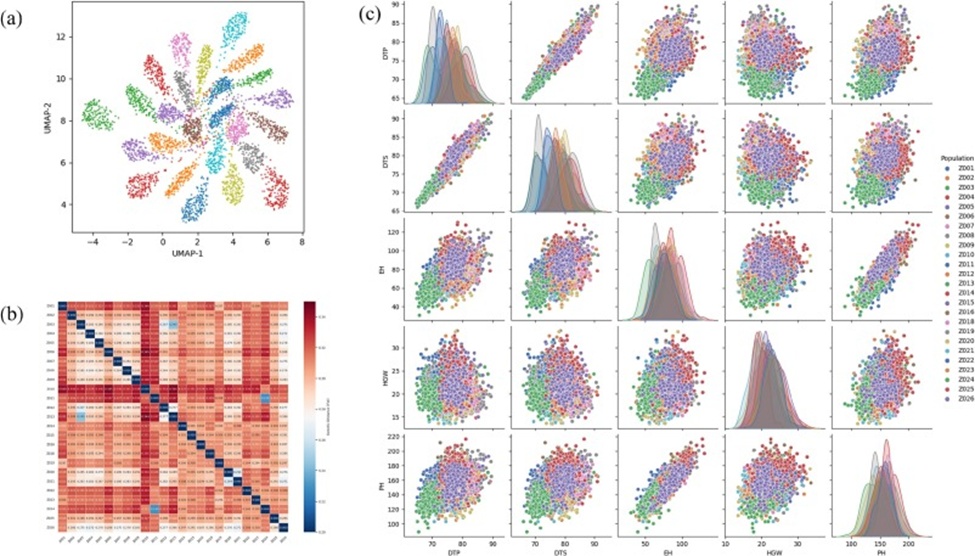
Figure 4. (a) Two-dimensional visualization of genomic data for each sub-population of the maize4505 dataset, (b) Pairwise fixation index (Fst) analysis of genetic divergence among sub-populations on the maize4505 Dataset, and (c) The distribution of phenotypes and correlation between phenotypic traits in each sub-population of the maize4505 dataset.
The VMGP approach advanced in this work capitalizes on the capacity of self-supervised learning on genomic inputs to extract latent genotypic signatures and draws on multi-target learning to disentangle the web of connections among several characters. This design aims to map genotype-phenotype correspondences without relying on the population’s internal grouping and dispersion properties, thereby moving beyond the boundaries of classical GS pipelines, which are typically tuned to specific traits and discrete populations. To firmly establish the practical value of VMGP, we performed a 5-fold cross-validation across the subcohorts in the maize4505 compilation. The compilation was stochastically apportioned into five folds according to sub-cohort membership, with the constraint that any given sub-cohort’s specimens appeared exclusively within a single designated fold. This precaution enforced the mutual exclusivity of sub-cohort representation across the folds. At every cross-validation round, four folds were assigned to the fitting phase, and the solitary remaining fold was held out for testing. This deliberate segregation ensured that any sub-cohort encountered during evaluation was wholly absent from the relevant material, thereby enhancing the trustworthiness and credibility of the cross-population forecasting analysis.
In terms of forecasting fidelity, VMGP ranked first, with a commanding lead over the comparator techniques across three distinct phenotypic characters: DTP, EH, and PH. However, concerning DTS, the highest Accuracy was captured by Cropformer, and for HGW, rrBLUP led the field (Figure 5). Within that same compilation, VMGP posted a marginal Accuracy shortfall of 1.3% relative to rrBLUP in the multi-phenotype forecasting setting, yet when placed in the cross-population forecasting context, the average Accuracy of VMGP outstripped that of rrBLUP by a considerable 7.7%. Particularly arresting were the pronounced advances in developmental predictions of DTP and PH, where Accuracy climbed by 14.7% and 12.8%, respectively. When contrasting the cross-population with the multi-phenotype forecasting scenario, the Accuracy surplus held by VMGP over RF and DNNGP increased from 10.8% and 4.4% to 37.0% and 11.1%, respectively. Cropformer likewise demonstrated enhanced cross-population forecasting performance, achieving a 3.0% accuracy improvement over rrBLUP, attributable to its multi-head self-attention module. The forecasting fidelity and consistency delivered by VMGP attest to its ability to overcome the inherent structural and distributional constraints of crop populations, fruitfully probing the genotype-phenotype linkage, and enabling cross-population phenotypic forecasting.
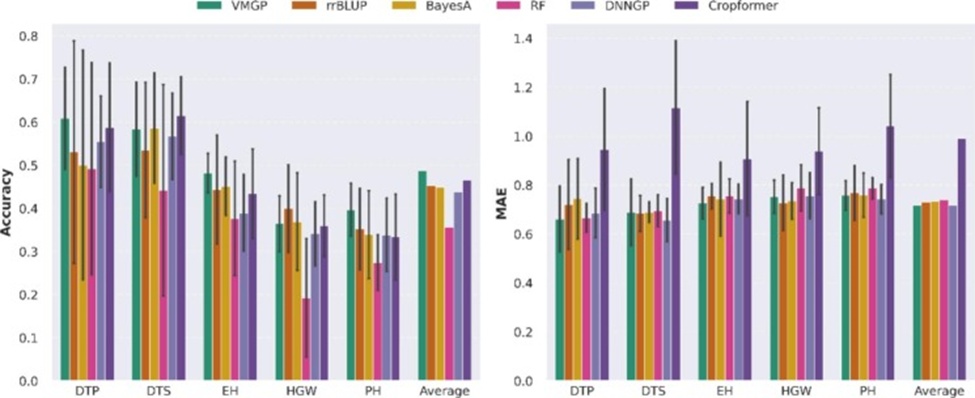
Figure 5. Cross-population prediction accuracy and prediction error of methods built using four different models on the maize4505 dataset. Abbreviations: VMGP = variational auto-encoder-based multi-task genomic prediction; rrBLUP = ridge regression-best linear unbiased prediction; RF = random forest; DNNGP = deep neural network for genomic prediction; DTP = days to pollen; DTS = days to silking; EH = ear height; HGW = hundred-grain weight; PH = plant height.
Turning to forecasting deviation, VMGP, alongside DNNGP, registered the most commendable average. VMGP yielded the lowest MAE figures for DTP and EH, whereas DNNGP came out ahead for DTS and PH, and rrBLUP for HGW. Even so, the spread in forecasting deviations across the approaches (Cropformer excluded) proved narrow, with the gap between the strongest and weakest entrants remaining under 2.8%. VMGP, DNNGP, and RF each adopted mean squared error (MSE) as their respective optimization objectives. Yet, their forecasting fidelities diverged substantially, suggesting that different model families exhibit fundamentally distinct aptitudes for learning the genotype-phenotype mapping.
As expected, the forecasting fidelity of VMGP-S fell somewhat below that of VMGP. When pitting VMGP directly against VMGP-S, VMGP netted superior Accuracy for four phenotypic characters—namely DTP, DTS, EH, and PH—while registering marginally inferior Accuracy for HGW. This pattern may tie back to the previously documented absence of a meaningful statistical association between HGW and the remaining characters observed in Figure 4c, coupled with the architecture’s inability to harness information from other characters for optimization.
To methodically probe the bearing of genetic divergence on cross-population forecasting, we set up a validation framework in which the VMGP architecture was conditioned on the subcohorts Z001-Z004. Forecasting competence was then gauged over three sub-cohorts representing varied genetic separation: Z010 stands as the most genetically remote population, its Fst figures ranging between 0.329 and 0.340 (averaging 0.335); Z026 constitutes the genetically nearest, with Fst ranging between 0.272 and 0.312 (averaging 0.286); Z014 occupies an intermediate station, its Fst values spanning 0.309 to 0.317 (averaging 0.312). Average Accuracy exhibited a general declining trajectory, proportionate to increasing genetic remoteness (peaking in Z026, followed by Z014 and then Z010). At the same time, the maximum Accuracy for EH and PH surfaced in Z010, whereas HGW peaked in Z014. Such irregularities signal that genetic separation, taken alone, cannot comprehensively account for the efficacy of cross-population forecasting, warranting subsequent dissection of fine-grained genetic architecture determinants.
The VMGP architecture’s aptitude for SNP subset curation, leveraging model transparency, was explored using SHapley Additive exPlanations (SHAP) [30, 47, 48], a well-validated framework for unmasking the inner workings of machine learning models. The SHAP procedure gains its footing by evaluating the isolated contribution a given feature exerts on the architecture’s output, conceptualized as a linear term conditioned on the remaining features, and the resulting weight is recognized as the Shapley value.
A random draw of 10% from the maize4505 compilation was taken, and after VMGP fitting, the Shapley values for each character were computed to guide SNP curation. These Shapley magnitudes were summatively pooled across SNPs, guiding a tactical selection of SNP subsets based on their aggregated relevance. In a subsequent step, cross-population 5-fold cross-validation was performed on the remaining 90% of the compilation using the pre-identified SNPs from the architecture’s interpretive output.
Figure 6 shows the Shapley-value warmth map for the top 50 SNPs, covering both the cumulative metric and the breakdown by each character. A clear alignment emerges, linking the Shapley values derived for DTP with DTS and those for EH with PH, mirroring the phenotypic interdependencies shown earlier in Figure 4c. This congruence suggests that the VMGP architecture effectively captures the interplay among multiple characters simultaneously.
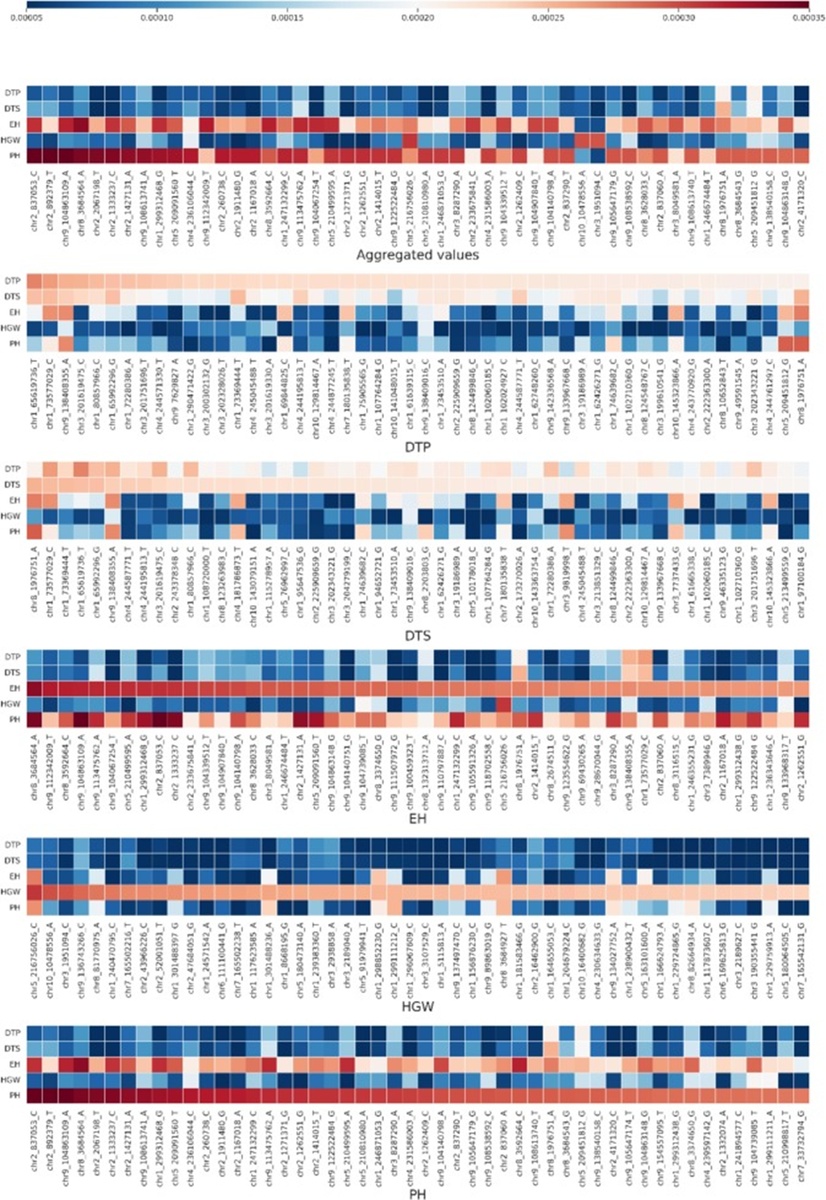
Figure 6. The Shapley value heatmap of the top 50 SNPs for aggregated values and individual traits. Abbreviations: DTP = days to pollen; DTS = days to silking; EH = ear height; HGW = hundred-grain weight; PH = plant height.
To corroborate the usefulness of the attributes identified by the VMGP architecture, we conducted a sweeping benchmarking exercise across 13 separate attribute ensembles. This series commenced with panels harboring 1000, 2500, 5000, and 10,000 SNPs, then systematically ramped up to encompass larger panels, expanding in increments of 10,000 SNPs, before reaching an all-encompassing panel of 100,000 SNPs. Each attribute ensemble was meticulously assembled based on the Shapley values generated in the earlier curation stage. The panel of 100,000 SNPs was treated roughly as the full attribute complement and served as a reference for measuring the comparative performance of the various pruned subsets.
Figure 7 delineates the forecasting fidelity and deviation exhibited by the VMGP algorithm over this gamut of pre-curated SNP panels. Strikingly, VMGP, when operating with only the foremost 1000 SNPs, already outperformed comparator approaches trained on the entire SNP repertoire. With 2500 SNPs in hand, the forecasting performance drew level with that of VMGP supplied with the complete SNP complement. Most tellingly, curation of 10,000 SNPs pushed forecasting performance to its peak, delivering an 11.3% accuracy uplift alongside a 6.0% deviation contraction compared with the VMGP run using all SNPs. These outcomes highlight the effectiveness of the VMGP architecture’s transparency analysis in identifying pivotal SNPs associated with phenotypic characters, thereby sharpening genotype-phenotype projections.
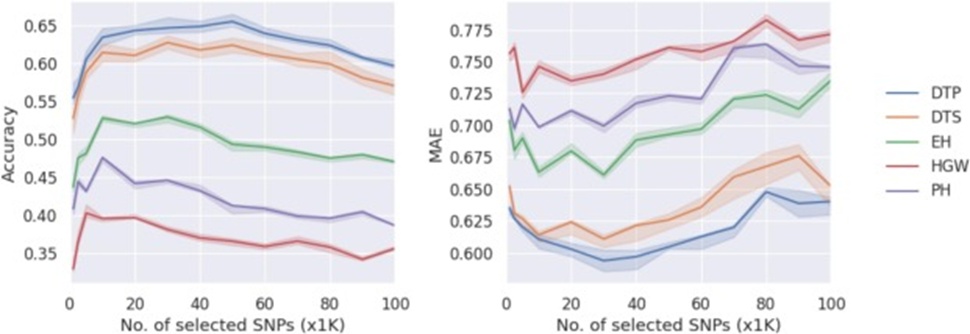
Figure 7. Cross-population prediction accuracy and prediction error of different SNP numbers pre-selected by VMGP on the maize4505 dataset. Abbreviations: VMGP = variational auto-encoder-based multi-task genomic prediction; DTP = days to pollen; DTS = days to silking; EH = ear height; HGW = hundred grain weight; PH = plant height.
By comparison, when a subset of SNPs is drawn entirely at random for cross-population forecasting, the anticipated regularities fail to materialize, and the forecasting performance of VMGP may not exceed that with the all-inclusive SNP panel. This discrepancy can be attributed to the likelihood that a haphazard SNP draw may miss the vital genomic variants that underpin phenotypic divergence.
The SNP curation tactic, guided by the VMGP architecture, can distill a targeted subset of SNPs that exhibit strong association with the phenotypes of interest. By deploying focused sequencing strategies for genotyping [14, 49, 50], this approach not only substantially slashes genotyping costs for large-scale breeding cohorts but also elevates the quality of genotype-phenotype projections.
To substantiate the biological intelligibility of our architecture, we conducted a methodical cross-validation between the feature importances derived from machine learning (the Shapley values) and outcomes from classical QTL interval mapping. The QTL dissection was conducted via IciMapping v4.2 under the following settings: a scanning interval of 1 cM, a stepwise regression inclusion threshold of 0.001, and a Logarithm of Odds (LOD) cutoff calibrated via 1000 permutation trials (P < 0.05). Background markers were incorporated to absorb residual genetic effects, and noteworthy QTLs were called based on a minimal LOD value of 2.5. Additive contributions and the fraction of phenotypic variance accounted for (R2) were quantified for each detected QTL.
QTL dissection targeting DTP in the Z016 sub-cohort (n = 191 specimens) identified 7 genome-wide significant QTLs, scattered across 7 chromosomes. Figure 8 plots LOD signals against physical coordinates, with the empirically derived genome-wide significance boundary (LOD = 2.5) denoted by a dashed red line. The model transparency analysis provided by the proposed architecture uncovered functional convergence, as two SNP positions ranking at the top of the SHAP list (chr2_22590965 and chr7_180135838) co-localized with the principal DTP-linked QTLs. Our integrative survey detected 639 genome-pervasive significant QTLs (P < 0.05) across five agronomic characters, and 53.4% (103 out of 193) of the SHAP-leading SNP positions (top 50 per character) displayed concordance with QTL confidence spans.
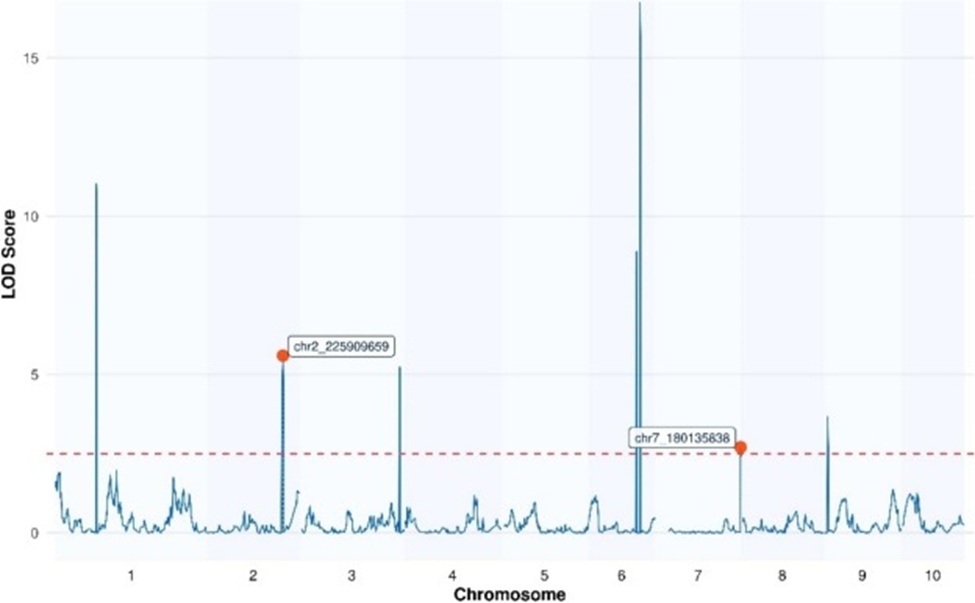
Figure 8. QTL mapping of DTP in the Z016 population co-localizing with two top SHAP-ranked SNPs of the maize4505 dataset. Abbreviations: QTL = quantitative trait loci; DTP = days to pollen.
The present work proposes an architecture deliberately engineered to remain invariant to parameter choices, serving multi-scenario breeding contexts and placing a premium on structural consistency and predictive fidelity. The protocol for hyperparameter specification unfolds across two stages: configuration of the architectural parameters, followed by formulation of the loss function.
A sweeping grid-based exploration of architectural parameters was undertaken over d1, d2, d3, and l, with the candidate pools set to [1024, 2048, 4096], [256, 512, 1024], [64, 128, 256], and [16, 32, 64], respectively. Perturbing these architectural variables induced only negligible swings in predictive faithfulness when assessed on the wheat599 assembly. The forecasting faithfulness (averaging 0.578 ± 0.0064) indicates a statistically negligible responsiveness to the hyperparameter combinations explored across 81 distinct configurations, with every outcome contained within a tight interval spanning 0.561-0.592. This robustness to architectural perturbations remained stable under 5-fold cross-validation. The evident indifference to architectural specification motivated our adoption of a fixed configuration throughout.
The VMGP framework fuses self-supervised genomic restoration with multi-character mapping from genotype to phenotype within a single neural blueprint, where the latter serves as the primary GS objective and the former as a supporting role. The task-weighting coefficient α, embedded in the composite loss function, governs the relative emphasis placed on these twin objectives. This multi-task construction capitalizes on shared latent representations to tease apart low-dimensional biological embeddings from high-dimensional SNP arrays, thereby alleviating the CoD obstacle endemic to GS. Setting α = 1 meant VMGP received no phenotypic information for fitting, and predictably, the predictive faithfulness for each character resided near zero. Setting α = 0 reduced VMGP to a pure phenotypic forecasting tool, yielding a baseline Accuracy figure of 0.351. Intermediate α values (0-1) conferred an average Accuracy lift of 8.7% over the baseline, thanks to auxiliary support from the genomic restoration pathway. Our deliberately restrained selection, α = 0.5, reconciles steadiness with achievement, yielding a 9.8% uplift.
The optimization trajectory exhibits a recognizable two-phase character: a steep reduction in error across the initial 50 epochs, followed by gradual leveling, with convergence plateaus established beyond epoch 200.
We have demonstrated that the VMGP approach effectively addresses GS assignments spanning multi-phenotype, multi-environment, and cross-population forecasting. This effectiveness springs from the cooperative fitting regimen that weaves together genomic compaction and restoration alongside several forecasting objectives. Tellingly, for characters with low heritability—such as the harvest metric in the rice299 assembly—VMGP achieves a minimal Accuracy enhancement of 19.5% relative to comparator approaches. This gain stems from the productive unearthing of latent dependencies residing within genotype profiles, an operation enabled by the VAE backbone and affording a more encompassing grasp of the genetic architecture.
The edge held by VMGP is particularly conspicuous within multi-environment forecasting and the forecasting of intercorrelated characters (for instance, DTP alongside DTS, and EH alongside PH in the maize4505 assembly). Its success arises principally from the effective apprehension of coupled relationships across tasks through collaborative fitting across several forecasting assignments. Such a strategy fosters a more synthesized understanding of the genetic substructure underlying these characters and their mutual influences across varied settings, thereby bolstering predictive quality. What is more, the collaborative fitting serves as a potent tactic for countering the CoD problem by pulling shared regularities across assignments through a communal network, thereby amplifying the architecture’s forecasting capability. This tactic equips the architecture to nimbly navigate the inherent challenges of high-dimensional genomic data, strengthening its capacity to generalize and resist noise.
Cross-population GS, characterized by incongruent distributions between training and test sets, is a complex setting that often defeats conventional GS pipelines. In confronting this hurdle, VMGP registers sizable Accuracy advantages over established baselines, posting a 7.7% accuracy improvement over the prior benchmark leader (rrBLUP) and a 4.6% edge over the deep learning alternative (Cropformer). When combined with SHAP-informed SNP pre-curation, the performance gaps registered by VMGP widen to 19.9 % and 16.4%, respectively. This extraordinary showing signals VMGP’s power to surmount distributional chasms that separate populations, distilling genotype-phenotype mapping with greater effectiveness and carrying out GS assignments by tapping into the innate informational content of genomic data, together with insights from several forecasting pursuits.
Deep learning does not invariably eclipse classical statistical techniques when tackling GS challenges [11, 31-33, 40]. Even among approaches that perform relatively well, painstaking parameter specification is essential. By contrast, the VMGP methodology advanced here deploys an invariant architecture and a single parameterization spanning all experimental runs, achieving either the best or nearly the best predictive outcomes. This standardized framework, combined with its straightforward design, robust forecasting capabilities, and publicly accessible source code, makes it eminently suited for large-scale rollout and routine adoption in plant breeding. It holds particular value for practitioners who foreground phenotypic projection but may lack deep familiarity with deep learning or limited proficiency in hyperparameter tuning. Beyond this, its bolstered capacity for cross-population forecasting hints at the possibility of displacing rrBLUP as the default algorithmic engine for GS in plant breeding as the field enters the big-data era.
The fusion of VMGP with the SHAP-based framework for model interpretation provides illuminating insights into the contribution weights of individual SNPs to forecasting diverse traits. By cumulating Shapley weights across multiple characters, VMGP can support preliminary sifting of SNP subsets, paving the way for potentially reduced genotyping costs. Such targeted attribute selection can also further hone GS forecasting quality. In the cross-population exercise referenced earlier, it was noted that drawing upon only 2.3% of the pre-identified SNPs (2500) yielded predictive quality approximately on par with deploying the full SNP complement. This dramatic reduction in the number of SNPs meaningfully curtails the financial burden of gene sequencing. Moreover, peak predictive quality was achieved with 9.4% of the pre-identified SNPs (10,000), resulting in an 11.3% accuracy lift and a 6.0% reduction in MAE relative to using the entire SNP panel. Furthermore, the curated SNP subset can operate as a preparatory filter for deeper investigation of functional genes, a topic that constitutes the focal direction of our future research.
Ultimately, conceived as a prospective universal genome-wide selection engine, manifold directions remain open for the continued refinement of this methodology. To begin with, it is essential to assimilate environmental covariates to probe the reciprocal influence of genes and surroundings more deeply. The empirical portion of this article treated environmental drivers either as static quantities or as elementary categorical variables, and it refrained from a granular exploration of how specific environmental parameters—including temperature, light exposure, and precipitation—modulate gene expression. We are poised to make the MaizeGEP resource publicly accessible, encompassing genotypic profiles, multi-environment phenotypic logs collected across numerous trial locations (2017–2023), and site-resolved daily meteorological records. Upcoming efforts will engineer deep learning encoders tailored to environmental covariates, facilitating their fusion with VMGP to explicitly parameterize genotype-environment interplay and thereby raise the fidelity of phenotype forecasting under fluctuating agroclimatic regimes. In addition, the transcriptome, proteome, and analogous molecular strata likewise constitute decisive determinants of phenotype. Building outward from VMGP and advancing toward a GS framework capable of multi-omics data amalgamation is a major objective for our ensuing research agenda.
The present study introduces the Variational auto-encoder-based Multi-task Genomic Prediction (VMGP) methodology, which has demonstrated its robust ability to address the intricacies of Genomic Selection (GS) across multi-phenotype, multi-environment, and cross-population settings. The resilience of the methodology stems from its cooperative fitting design, which fluidly merges genomic compaction and reconstitution with multiple forecasting assignments, thereby sharpening the fidelity of GS.
The VMGP methodology shines with particular brilliance in circumstances marked by depressed heritability and within the demanding arena of cross-population forecasting, outstripping the achievements of incumbent techniques. This success is owed to its ability to productively surface and capitalize on the nuanced interdependencies encoded within genotypic profiles. The methodology’s standardized architectural design and uniform parameterization, enforced across all experiments, have culminated in a tool that is simultaneously parsimonious, stable, and highly dependable in its forecasts.
Beyond this, the open-source nature of the VMGP methodology, together with its amenability to extensive deployment across plant breeding, positions it as an indispensable tool for both investigators and practitioners. Its accessible design proves especially advantageous for those who emphasize phenotypic projection, without requiring advanced grounding in deep learning or protracted effort in hyperparameter calibration.
Looking ahead, the VMGP methodology is well-placed for ongoing iterative advancement. The integration of environmental data and the pursuit of multi-omics data convergence offer fertile avenues to enhance the inferential power of the methodology. Such progressions will not only enrich our understanding of the dynamic interplay between genetic determinants and environmental cues but also provide insights into the mechanisms underlying these interactions. Still, they will also contribute to the development of ever more exacting and all-encompassing GS frameworks.
This work is supported by the National Key Research and Development Program of China (No. 2024YFD1201500), the Key Research and Development Program of Jiangsu Province, China (No. BE2022337, BE2023302, and BE2023315), and the National Innovation Center for Digital Seed Industry, Beijing, China, 100097.
None
None
None
Open Access The author(s) retain copyright. This article is licensed under the Creative Commons Attribution-NonCommercial-ShareAlike 4.0 International License. It may be shared and adapted for non-commercial purposes with appropriate attribution, an indication of changes, and distribution of adaptations under the same license. Third-party material may be subject to separate terms identified in its credit line. View the license at https://creativecommons.org/licenses/by-nc-sa/4.0/.
 Agro Intelligence Research Press