Leaching losses of nitrogen (N) from grazed pasture are driven predominantly by urinary N deposited by cattle. This work aimed to use non-invasive accelerometer-based sensors to capture the timing and duration of urination and defecation events in grazing cattle. To register the back arching motion that accompanies urination and defecation, each cow was fitted with two accelerometer sensors. Experiments took place outdoors under grazing conditions during two seasons—autumn and summer—and captured a total of 160 urination events. Across the majority of these events, the tilt angle was observed to shift within a range of 8 to 22.5 degrees. Using 18 selected features that characterise a cow's back arching, ensemble machine learning classifiers were constructed to recognise urination and defecation. The urination classifier delivered an F1 score of 0.80 (harmonic mean computed from a precision of 0.82 and a sensitivity of 0.78). In contrast, the defecation classifier gave an F1 score of 0.73 (calculated from 408 hours of recordings made between 9 a.m. and 3 p.m. from 19 cows). Predictive models for urination event duration were statistically significant. Still, they underperformed, with low explanatory power, in part because the relationship between the duration of back arching and the duration of urine passage was only moderate (R² values of 0.29 in autumn and 0.47 in summer). The work highlights that non-invasive accelerometer sensing has real promise for capturing individual cows' urination patterns and for generating animal-level information that farm decision support systems (such as those addressing urine-N excretion) and managerial actions (such as selective culling or breeding) could use as input.
Agriculture's contribution to impaired water quality and greenhouse gas emissions is heavily influenced by nitrogen (N) losses from grazed pasture systems, such as dairy farms, and jurisdictions increasingly enforce legal ceilings on such N losses [1]. The dominant pathway for N leaching in these systems is urine excreted by grazing stock (e.g., dairy cows) in concentrated patches, which apply N at high loading rates of 200-2000 kg N/ha [2]. Because pasture plants reach a utilisation ceiling at elevated N rates, the fraction of N that percolates from urine patches increases steeply with the rate of urine-N application [1]. Moreover, the total N contained within a single urine patch—termed the N load—proves to be a reliable univariate predictor of N leaching for discrete urination events. This predictability arises from lateral N movement within the patch and the capacity of roots located beyond the wetted zone to scavenge the deposited N [3]. By way of illustration, shifting cows to a diet containing plantain cut the per-event N load by 31%, an effect projected to lower whole-farm yearly N leaching by 7% in the Waikato region and by 21% in the Canterbury region of New Zealand [4]. Both how often urination occurs and how much volume is released each time directly set the N load of a given urine patch. Since volume per event is determined by urine flow rate multiplied by duration, longer-lasting events generally produce larger volumes. The traits of urination frequency, duration, and N load vary considerably from one cow to another, with coefficients of variation ranging from 15% to 25% [5, 6]. Animals that urinate more frequently—often with shorter individual events—inherently void less N each time, thereby contributing less to N leaching. This opens a pathway for reducing N leaching on grazed pastoral land by singling out and preferentially managing cows that naturally deposit low N loads per urination.
A typical dairy cow urinates around 10 times each day, each episode averaging 9 seconds in length [6]. Because these events are sparse, the chance of catching one by spot-checking a single cow at a random instant is roughly 1 in 1000. Detecting urination characteristics consequently demands sensor deployment over long, continuous periods, combined with high sensitivity and high precision. Today's standard methodology for recording urination in grazing dairy cows involves directly capturing urine flow, a resource-intensive approach reserved for in-depth research into the timing, volume, and N content of each event [5, 7]. An alternative uses an invasive controlled internal drug release (CIDR) device fitted with a thermistor that hangs beneath the vulva and senses the thermal spike caused by passing urine [8].
Acoustic, accelerometric, and electromyographic (EMG) sensors offer potential as lightweight, non-invasive options for monitoring urination events. EMG sensors, which detect electrical impulses and muscle vibration [9, 10], could, in theory, be adapted for this purpose. Acoustic approaches have been successfully designed and validated for monitoring rumination duration in cows [11], estimating feed intake [12-14], and detecting oestrus [15]. In previous work, our team deployed acoustic sensors attached to cows' hind legs and achieved an F1 score of 0.88 for urination event classification during validation [6]. Accelerometer devices are electromechanical sensors that can measure the dynamic forces that characterise animal behaviours [16, 17]; one application has been the identification of the squatting posture in urinating sheep [18]. Capturing the distinct back arching cows perform while urinating presents an opportunity for accelerometer-based detection. On commercial dairy farms, such sensor technology could provide estimates of individual cows' urination traits—frequency and duration per event—to supply animal-level data that feed into decision-support platforms (e.g., modelling urine-N excretion) and inform farm-level actions (e.g., culling or breeding selections).
Our central research hypothesis is that non-invasive accelerometer sensors can determine both the timing and duration of urination events in cattle managed on grazed pasture.
Full details of the experimental runs were given in our earlier acoustics-focused paper [6].
The study site was the AgResearch Ruakura Research Farm near Hamilton, New Zealand. In the calibration run (Trial 1), eight non-lactating dairy cows were monitored over a two-day window (3–4 May 2018; UTC+12:00). Across a 6-hour daily observation block (0900 to 1500 h), two personnel visually logged the moment each urination or defecation event started and how long it lasted. Two video cameras also monitored the grazed paddock. The subsequent validation run (Trial 2) employed 15 non-lactating dairy cows over 4 days (11–14 December 2018; UTC+13:00), replicating the protocol used in Trial 1. Visual recording of event timing and duration was again performed by the two observers throughout 6 hours (0900 to 1500 h). The field value for the urination event duration was the average of the two observers' assessments and was customarily logged to an accuracy of 1 second.
Both trials were conducted under the approval of the AgResearch Ruakura Animal Ethics Committee (approval numbers 14381 and 14553), meeting the requirements set out in the New Zealand Animal Welfare Act 1999. Throughout the experimental periods, the cows had unlimited access to drinking water and grazed swards consisting mainly of perennial ryegrass and white clover.
To capture shifts in spinal movement, Hobo Pendant® G data loggers from Onset® Instruments (www.onsetcomp.com) were employed. Built as a 3-axis accelerometer, the unit registers movement across three dimensions and also captures tilt. The recording interval was programmed to 1 second. Power is supplied by a single CR2032 lithium button cell, and total unit mass is 18 g. The device operates across a measurement window of ± 3 g (equivalent to 29.4 m/s²), delivering accuracy of ± 0.075 g (0.735 m/s²) when held at 25 °C and ± 0.105 g (1.03 m/s²) over a broader thermal range from -20 to 70 °C. Its resolution capability is 0.025 g (0.245 m/s²). Extraction of logged data was performed via a USB interface cable linked to a computer.
For mounting, each accelerometer unit was secured to an angle bracket, which in turn was fixed to a 30 × 50 mm backing plate equipped with VELCRO™. This plate assembly was then pressed onto a 25 × 50 mm VELCRO™ strip that had been bonded with adhesive to the required location on the cow's body. The chosen attachment sites lay along the spine, with one sensor positioned directly at the hipline (designated point A) and another set 400 mm forward along the spinal column toward the head (designated point B). Anatomically, point A sits at the centre of the hipline—also known as the wing of the ilium—over the first sacral vertebra (S1). Point B is defined as the midpoint lying between the first lumbar vertebra (L1) and the thirteenth thoracic vertebra (T13). When a urination event commences and concludes, these two spinal reference points undergo distinct tilting shifts, resulting in a net displacement of the overall spinal orientation that is maintained throughout the duration of urination. Figure 1 shows the arrangement of the orientation sensors. In Trial 1, four cows were fitted with sensors. A subset of two cows from that same trial received additional sensors mounted at 200 mm and 600 mm forward along the spine. However, the data from these extra positions were not incorporated into the final analysis. All 15 cows in Trial 2 had sensors installed.
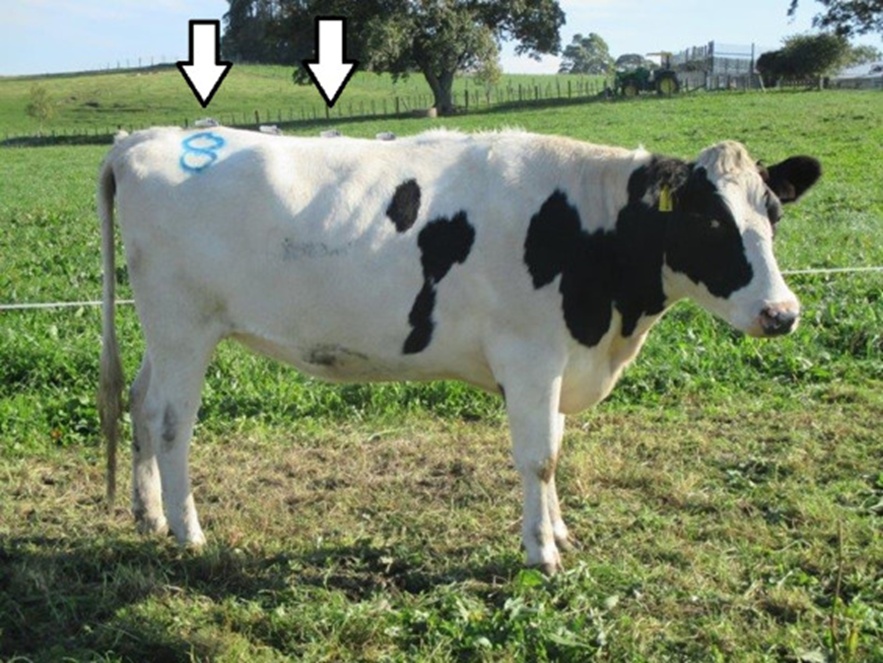
Figure 1. Arrangement of accelerometer sensors on the cows. Sensor units were placed on the spine at the hipline and at a point 400 mm anterior along the spine (the cow shown also carried sensors at 200 mm and 600 mm). Analysis was restricted to data collected at the hipline and the 400 mm position (marked by arrows).
A characteristic back-arching movement precedes and follows each urination event. In most urination events, the tilt angle at anatomical locations A and B shifts by 8-22.5 degrees. A continuous arch in the back is sustained not only while urine is being passed but also for a short window before the flow starts and after it finishes. Urination events almost always exceed 5 seconds in total length. When comparing the onset of arching, the rate at which the back bends upward is typically sharper for urination than for defecation. By contrast, the back arching that occurs when a cow scratches its ear tends to be markedly shorter in duration and involves a smaller tilt-angle displacement than is observed for either defecation or urination. The prototype classification model was built around these behavioural observations.
To predict both the start time and duration of each event, a suite of different modelling approaches was explored.
A total of eleven models were assessed for their ability to determine event timing.
Model 1 – sufficient sustained back arching (applied to urination events).
To be classified as a urination event, a recorded episode must satisfy all five of the following rules:
• A tilt increase at the hipline spinal midpoint measuring a minimum of 8°.
• A simultaneous tilt decrease at the spinal midpoint approximately 400 mm forward of the hipline, also of at least 8°.
• A phase of comparative stillness in which the heightened/lowered tilt differential is preserved, exhibiting a maintained separation (lasting no fewer than 5 consecutive seconds) of at least 16°, and featuring at least one moment during this phase where the differential reaches 17° or higher.
• A drop in tilt of no less than 8° at the hipline spinal midpoint.
• A matching rise in tilt of no less than 8° at the spinal midpoint situated approximately 400 mm forward of the hipline.
The numerical thresholds were set by hand after reviewing the trial events.
This algorithm permits adjustment to filter out false positives arising from unrelated cow activities. For instance, a cow will often lift a rear hoof to scratch parts of its body—commonly the neck and head region—to relieve discomfort from an insect bite. That scratching behaviour can produce spinal orientation changes that happen to fall within the rule boundaries. To address this, criterion 3 may require that the relatively motionless interval following the initial spinal tilt continue for at least 5 seconds.
Spinal arching can also appear just before a powerful rear-leg kick, whether using one or both hind limbs; however, the arching in such instances is extremely brief and concludes in under one second. Similarly, rapid locomotion sometimes generates pronounced but momentary spinal arching. Both types of events are excluded because they fail to meet the combined requirements of criteria 1 through 5.
Model 2 – sufficiently sustained (≥ 10 s) back arching alongside an adequately restrained initial rate of arching (fewer than 5 seconds in which the tilt rate exceeds 2.75 degrees per second) at the beginning of an arching episode (for urination events).
Model 3 – sufficiently sustained (minimum of 4 consecutive seconds with a tilt differential ≥ 16°, plus at least 10 consecutive seconds with a tilt differential ≥ 8°) back arching together with a relatively high initial rate of arching (more than 2 seconds where the tilt rate surpasses 2.75 degrees per second) at the episode's onset (for defecation events), applied to those episodes not already labelled as urination by Model 2.
Model 4 – Linear Discriminant Analysis (LDA) classification that draws on a set of 18 features describing an arching episode (for urination events). Model 1 provided a means to generate a labelled training dataset for calibration, built from true-positive and false-positive instances.
The full list of 18 features (each derived from the time windows in which the tilt angle differential exceeds 0°) is as follows:
1. The maximum attained value of the tilt angle differential
2. The cumulative count of seconds during which the tilt angle differential remains above 0°
3. The cumulative count of seconds during which the tilt angle differential remains above 8°
4. The standard deviation computed across the tilt angle differential
5. The standard deviation of the tilt angle differential, restricted to those periods when the differential exceeds 15°
6. The standard deviation of the tilt angle differential, restricted to those periods when the differential exceeds 20°
7. The standard deviation of the tilt angle differential, restricted to those periods when the differential exceeds 25°
8. The longest uninterrupted run of seconds where the differential is at least 16°
9. The longest uninterrupted run of seconds where the differential is at least 10°
10. The longest uninterrupted run of seconds where the differential is at least 8°
11. The elapsed time in seconds until the maximum tilt differential is reached
12. The total number of seconds during which the rate of tilt change stays above 2.75 degrees per second
13. The total number of seconds during which the rate of tilt change stays above a threshold equal to 10% of feature 1 (expressed in degrees per second)
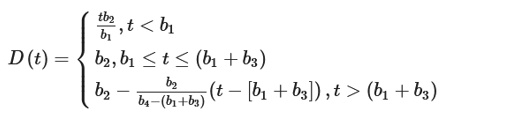
14. The coefficient b1 resulting from fitting Eq. 1 to the tilt angle differential across the time window where the differential exceeds 0°
15. The coefficient b2 resulting from fitting Eq. 1 to the tilt angle differential across the time window where the differential exceeds 0°
16. The coefficient b3 resulting from fitting Eq. 1 to the tilt angle differential across the time window where the differential exceeds 0°
17. The combined term b4−b1−b3 obtained from the fitted Eq. 1 applied to the tilt angle differential across the time window where the differential exceeds 0°
18. The total number of seconds during which the tilt angle differential exceeds 80% of feature 1
Where the tilt angle differential D(t) is modelled as a function of time (t).
 (1)
(1)
Model 5 – Naïve Bayes (NB) classification drawing on the full set of 18 arching-event features (targeting urination events). The labelled calibration dataset was constructed from TP and FP instances supplied by Model 1.
Model 6 – Support Vector Machine (SVM) classification drawing on the full set of 18 arching-event features (targeting urination events). The labelled calibration dataset was constructed from TP and FP instances supplied by Model 1.
Model 7 – Stepwise generalised linear model (SGLM) classification employing 16 of the features (features 8 and 9 were omitted due to gaps in the data) to characterise an arching event (targeting urination events). The labelled calibration dataset was constructed from TP and FP instances supplied by Model 1.
Model 8 – Classification Tree (CT) drawing on the full set of 18 arching-event features (targeting urination events). The labelled calibration dataset was constructed from TP and FP instances supplied by Model 1.
Model 9 – Classification Ensemble (CE) drawing on the full set of 18 arching-event features (targeting urination events). The labelled calibration dataset was constructed from TP and FP instances supplied by Model 1.
Model 10 – k-nearest neighbour (kNN) classification drawing on the full set of 18 arching-event features (targeting urination events). The labelled calibration dataset was constructed from TP and FP instances supplied by Model 1.
Model 11 – an occurrence receives a positive label when a minimum of three classifiers drawn from Models 4 through 10 return a positive prediction (Majority vote, MV).
A pair of modelling strategies was trialled for estimating the length of events.
Model A: The span of the sustained back arching detected by Model 1 acted directly as the estimate of urination event duration.
Sixteen features derived from the back arching occurrences identified in Model 1 served as the training inputs for Model B.
Model B: Stepwise linear regression (SLR).
By cross-referencing the set of visually confirmed urination events with the set of algorithm-predicted events, the tallies of true positives (TP), true negatives (TN), false positives (FP), and false negatives (FN) were established. For every binary classifier, a suite of performance metrics was computed: sensitivity (TP/(TP+FN)), precision (TP/(TP+FP)), specificity (TN/(TN+FP)), and the F1 score—the harmonic mean that evenly weights sensitivity and precision (2 × (sensitivity × precision)/(sensitivity + precision)). The confusion matrix [■(TN&FP@FN&TP)] was populated for each classifier. Bootstrap procedures provided estimates of standard error for each classification statistic. Linear regression was applied to quantify the relationship between the predicted and measured event durations; from these regressions, the coefficient of determination (R²), root mean squared error (RMSE), intercept, slope, significance level, and bias were extracted for each model.
Outcomes are reported separately for the two trial phases.
Urination events were identified through accelerometer traces collected along the spinal column. Figure 2a displays the raw tilt angle signal captured at the hipline over the course of a 14-second urination episode. Figure 2b presents the matching signal from the sensor located 40 cm further along the spine toward the head. Subtracting the +40 cm tilt from the hipline tilt yields a differential that peaked at 25 degrees during this event. This value quantifies the extent of spinal curvature during voiding.
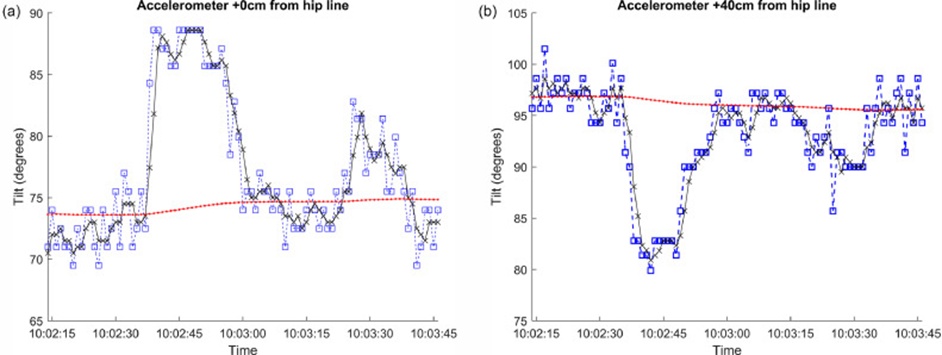
Figure 2. a) Unprocessed accelerometer readings (square markers) of hipline tilt angle across a urination event of 14 s, and b) unprocessed accelerometer readings (square markers) of tilt angle at a spinal position 40 cm anterior to the hipline. The overlaid smoothed series (x) and baseline (dot) were produced using 3-point and 300-point averaging windows, respectively.
Calibration of the models utilised 24 urination events gathered from four cows over the period of direct visual monitoring. Table 1 presents the confusion matrix summarising Model 1's classification performance. The four monitored cows yielded an F1 result of 0.65 and a precision of 0.49. Eighteen of the 24 predicted-but-unobserved urination events proved on review to be defecation; the other six were scratching bouts. The approximate number of TN events was taken as the count of non-overlapping 15-second segments (urination typically concludes within a 15-second block) in which no event was either seen or predicted; per cow, across a 6-hour session, this amounts to 1440 segments. Table 2 reports the corresponding output for Model 2, which attained an F1 of 0.89 and a precision of 0.91 on the same four animals. The two predicted events lacking visual corroboration were both defecation. These data confirm the practicality of accelerometer-based urination sensing.
Table 1. Classification of urination events: observed versus predicted in Trial 1 (Model 1).
Calibration performance | Predicted other event | Predicted urination event | Empty cell |
Observed Other Event | 10032 (True Negative, TN) | 24 (False Positive, FP) | Precision = 0.49 ± 0.07Sensitivity = 0.96 ± 0.04 |
Measured Urination Event | 1 (False Negative, FN) | 23 (True Positive, TP) | Specificity = 0.998F1 score = 0.65 |
Table 2. Classification of urination events: observed versus predicted in Trial 1 (Model 2).
Calibration performance | Predicted other event | Predicted urination event | Empty cell |
Observed another event | 10054 (True Negative, TN) | 2 (False Positive, FP) | Precision 0.91 ± 0.06 |
Measured urination event | 3 (False Negative, FN) | 21 (True Positive, TP) | Specificity 0.999 |
An equivalent calibration was performed on 24 defecation events noted during visual observation. Table 3 presents the confusion matrix for Model 3. Here, the F1 reached 0.73, with a precision of 0.72 for the group of four cows. Among seven predicted events not matched by a visual defecation record, four corresponded to scratching and three to urination. Defecation events that were observed but missed by the model tended to involve minimal arching of the back. The TN count was approximated by enumerating 10-second intervals (a typical defecation event falls within a 10 s interval) free of both observation and prediction; this yields 2160 intervals per cow per 6-hour watch. These outcomes indicate that capturing defecation events with accelerometers is a realistic goal.
Table 3. Classification of defecation events: observed versus predicted in Trial 1 (Model 3).
Calibration performance | Predicted other event | Predicted defecation event | Empty cell |
Observed another event | 15089 (True Negative, TN) | 7 (False Positive, FP) | Precision = 0.72 ± 0.09Sensitivity = 0.75 ± 0.09 |
Measured defecation event | 6 (False Negative, FN) | 18 (True Positive, TP) | Specificity = 0.999F1 score = 0.73 |
Figure 3 plots the measured duration of urination events against the values predicted by Model A for the 21 events detected during the visual monitoring phase of Trial 1. The association is not strong: R² is only 0.29, and RMSE is 4.7 s. Systematic overprediction is evident, a consequence of the back arching commencing before urine release and persisting beyond its cessation.
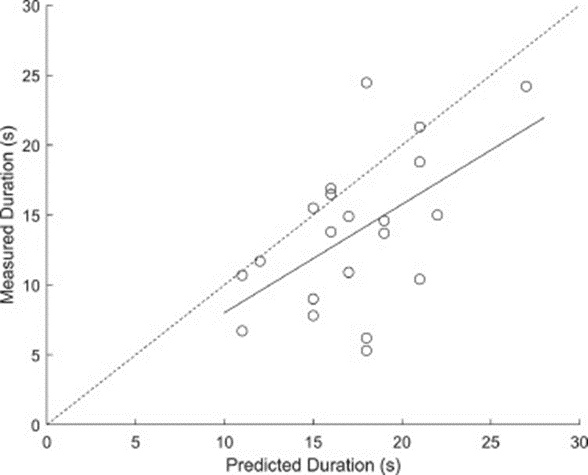
Figure 3. Predicted against measured urination event duration for the 21 events from Trial 1 using Model A (R² = 0.29, RMSE = 4.7 s, N = 21, P = 0.01, slope = 0.77 ± 0.28, intercept = 0.26 ± 4.91, bias = 3.65 s). The solid line depicts the fitted regression; the dotted line shows the 1:1 reference.
The urination classifiers originally tuned on Trial 1 were tested on the independent data of Trial 2. Table 4 supplies the confusion matrix obtained with Model 1. As before, TN events were estimated from the pool of 15-second blocks lacking any observed or predicted event, totalling 1440 per cow per 6-hour session. Across the 15 monitored cows, Model 1's F1 was 0.56, close to the calibration F1 of 0.65. Consistent with the calibration pattern, precision lagged behind sensitivity. Model 2's validation metrics, collated in Table 5, proved broadly similar, achieving an F1 of 0.59.
Table 4. Classification of urination events: observed versus predicted in Trial 2 with Model 1.
Validation performance | Predicted other event | Predicted urination event | Empty cell |
Observed another event | 86400 (True Negative, TN) | 194 (False Positive, FP) | Precision = 0.40 ± 0.03Sensitivity = 0.95 ± 0.02 |
Measured urination event | 7 (False Negative, FN) | 129 (True Positive, TP) | Specificity = 0.998F1 score = 0.56 |
Table 5. Classification of urination events: observed versus predicted in Trial 2 with Model 2.
Validation performance | Predicted other event | Predicted urination event | Empty cell |
Observed another event | 86400 (True Negative, TN) | 146 (False Positive, FP) | Precision = 0.45 ± 0.03Sensitivity = 0.87 ± 0.03 |
Measured urination event | 18 (False Negative, FN) | 118 (True Positive, TP) | Specificity = 0.998F1 score = 0.59 |
The TP and FP events from Model 1 (Table 4) were repurposed as the labelled training set for Model 11. Table 6 contains the resulting confusion matrix when Model 11 was applied to the full set of 15 cows monitored over four consecutive 6-hour daily sessions. This ensemble classifier achieved an F1 score of 0.80, with precision and sensitivity well balanced. The notable performance gain highlights the capability of accelerometer-based urination detection and the importance of assembling larger training corpora to enhance model reliability during calibration and validation.
Table 6. Classification of urination events: observed versus predicted in Trial 2 (Days 1 through 4) with Model 11.
Calibration performance | Predicted other event | Predicted urination event | Empty cell |
Observed another event | 86400 (True Negative, TN) | 24 (False Positive, FP) | Precision = 0.82 ± 0.03Sensitivity = 0.78 ± 0.04 |
Measured urination event | 30 (False Negative, FN) | 106 (True Positive, TP) | Specificity = 0.999F1 score = 0.80 |
Figure 4 displays the validation-stage relationship between observed and Model A-predicted duration for the 129 urination events captured during Trial 2's visual monitoring. The fit remains poor, giving R² = 0.16 and RMSE = 3.0 s. Duration overestimation persists, echoing the Trial 1 outcome. Calibration of Model B for urination event duration on Day 1 of Trial 2 is illustrated in Figure 5 (R² = 0.47, RMSE = 2.14 s, N = 32), but extending this model to Days 2–4 resulted in a breakdown of predictive power (R² = 0.03, RMSE = 3.41 s, N = 97; slope = 0.32 ± 0.18; intercept = 6.9 ± 1.7; bias = −0.73 s). These patterns underscore the demand for considerably larger training pools to build robust models of urination duration in both calibration and validation contexts. Still, the evidence consistently indicates only a loose coupling between the time spent with an arched back and the actual duration of urine flow, mirroring earlier field-based observations.
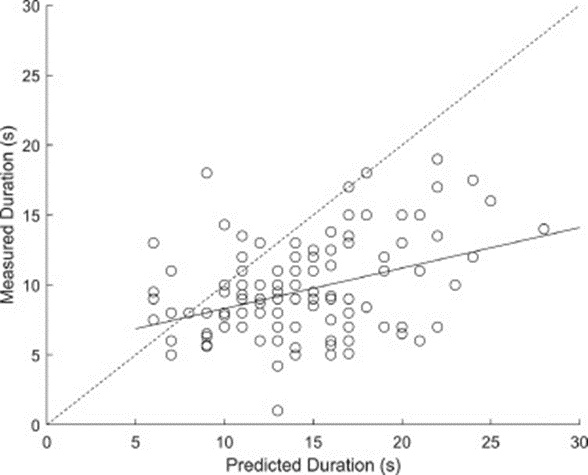
Figure 4. Measured versus predicted urination event duration (Model A) for the 129 predicted events with known durations in Trial 2, Days 1–4 (R² = 0.16, RMSE = 3.0 s, N = 129, P < 0.001, slope = 0.29 ± 0.06, intercept = 5.11 ± 0.88, bias = 4.62 s). The solid line shows the fitted regression; the dotted line indicates the 1:1 reference line.
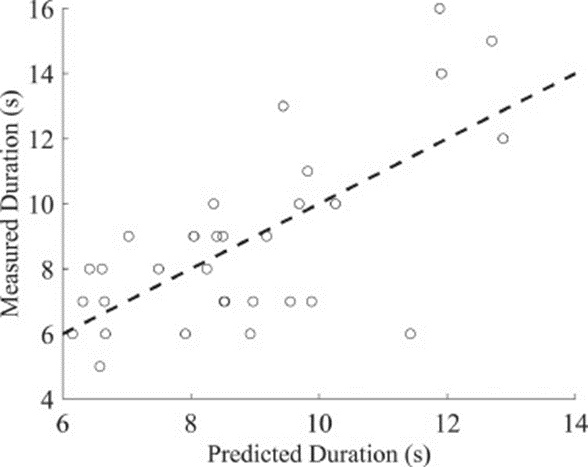
Figure 5. Calibration comparison of stepwise linear regression (SLR) predicted and measured urination event durations (s) for Trial 2, Day 1 (R² = 0.47, RMSE = 2.14 s, N = 32). The solid line marks the 1:1 reference.
In the work reported here, cow-mounted accelerometer sensors were employed to register the timing and length of urination events performed by grazing cattle. We demonstrated that securing lightweight, non-invasive accelerometer units to the cow's spinal column is a viable method for detecting the distinctive back arching that occurs during both urination and dung deposition. During calibration in Trial 2, the accelerometer-based urination classifier delivered strong performance, with an F1 of 0.80 (precision 0.82 ± 0.03 and sensitivity 0.78 ± 0.04). The feasibility of accelerometer-based defecation detection was also established, with an F1 of 0.73 achieved in calibration Trial 1. These findings are in line with the results of [18], which reported precision and sensitivity of 0.81 and 0.72, respectively (F1 = 0.76), using a 5-second accelerometer window model to detect urination in sheep.
The ensemble machine learning (ML) classifier (Model 11) yielded superior performance relative to any of the standalone ML models (Models 4–10). Beyond this, integrating information from heterogeneous sensor types could further enhance model accuracy, as each modality captures a phenotype that is relatively independent of the others. Of particular interest, pairing an acoustic sensor—valued for its high precision (0.94 in validation Trial 2; [6])—with an accelerometer sensor—noted for its high sensitivity (0.95 for Model 1 in validation Trial 2)—might produce a combined F1 exceeding the best individual scores (F1 = 0.88 [6] for acoustic and F1 = 0.56 in the accelerometer validation study). That said, sensor fusion was not investigated here and would entail greater cost and complexity for widespread animal deployment. The acquisition of substantially larger datasets would also permit the inclusion of a richer feature set within ML frameworks and open the door to architectures such as long short-term memory (LSTM) networks and hidden Markov models (HMM) for refining the classification of urination and defecation in grazing cattle [19, 20].
EMG = Electromyogram
F1 = The F1 statistic
FN = False negative
FP = False positive
ML = Machine learning
MV = Majority vote
N = Nitrogen
RMSE = Root mean squared error
R2 = Coefficient of determination
SLR = Stepwise linear regression
TN = True negative
TP = True positive
We thank Amanda Judge, Martin Kear, Mike Sprosen, Moira Dexter and Lisa Box for technical assistance.
None
This work was funded by the AgResearch Preseed Fund.
None
Open Access The author(s) retain copyright. This article is licensed under the Creative Commons Attribution-NonCommercial-ShareAlike 4.0 International License. It may be shared and adapted for non-commercial purposes with appropriate attribution, an indication of changes, and distribution of adaptations under the same license. Third-party material may be subject to separate terms identified in its credit line. View the license at https://creativecommons.org/licenses/by-nc-sa/4.0/.
 Agro Intelligence Research Press