Reliable, hands-off measurement of bovine body dimensions and weight is vital to increasing output and accelerating genetic gains in tropical beef enterprises. Traditional techniques are time-consuming, demand heavy machinery, require handling livestock, induce animal stress, and are frequently unworkable for resource-constrained smallholders lacking adequate infrastructure. This paper introduces an original, smartphone-operated platform for instantaneous body dimension capture and weight forecasting in Brahman cattle, driven by a cloud-based artificial intelligence (AI) engine. A corpus of 12,660 lateral photographs was assembled and tagged for hip depth (HD) and body length (BL), with YOLOv11 convolutional neural network variants undergoing training and evaluation. The YOLOv11m configuration achieved the highest metrics (precision: 99.85%, recall: 100%, F1-score: 99.92%, IoU: 97.68% ± 1.31%), and the automatic extractions displayed tight concordance with manual ImageJ-derived figures (MAPE < 0.4%). HD and BL were strongly intercorrelated in both sexes (r = 0.98–0.99) and moderately indicative of body weight (r = 0.57–0.59). A multiple regression formula incorporating HD and BL delivered the most precise body weight predictions (MAE = 43.44 kg; MAPE = 8.91%). The system was fielded via a LINE messaging chatbot interface, allowing users to upload cattle photos and receive immediate dimensional outputs and weight approximations straight to their smartphone—doing away with any need for bespoke hardware. This inexpensive, easy-to-operate AI instrument supplies a scalable avenue for digital phenotyping, herd oversight, and evidence-based selection in smallholder environments. The concept exhibits substantial capacity to enable data-informed management and enduring productivity improvements in tropical beef networks.
Broadly, the two prevailing categories of beef cattle enterprise in Thailand are calf-producing herds and finishing lots [1]. Cow-calf managers ordinarily rely on Thai Native, Brahman, and Brahman crossbred cows to generate offspring. The sires or semen employed for breeding may match or differ from the dam breeds, contingent on market signals [1, 2]. Fattening operators, by contrast, typically procure stock from outside sources. Such cattle are predominantly hybrids of Bos taurus and Bos indicus ancestry [1]. Bovine body architecture and body weight (BW) are fundamental arbiters of carcass output, grade, and system efficiency. Among the range of metrics deployed to judge cattle, chest depth, body length, wither height, hip height, and hip width shed light on overall structure, muscular distribution, and developmental trends [3-6].
Hip depth (HD) and body length (BL) act as principal indicators of an animal's suitability for meat output. Extended bodies denote bigger frames, translating to additional muscle tissue along the dorsal line and elevated retail-cut tonnage, particularly in prized zones such as the loin and rib-eye [4, 6]. Fuller hips signify enhanced hindquarter development, boosting premium cuts like sirloin, round, and rump. Animals exhibiting ample hip depth are inclined to deliver more beef [5]. Judging from appraisals of bovine physical form, the heritability of structural measurements ranges from moderate to high, pointing toward these characteristics being amenable to deliberate selection within genetic programs [7, 8]. Genetic links between BW and conformation attributes are generally positive and robust, hinting that targeted selection for improved frame qualities will probably drive desirable gains in BW [5]. Hence, observing body conformation and animal growth provides a blueprint for picking stock geared toward maximal, uniform production, an essential element in hitting targets and ensuring beef enterprise viability [9].
Live, individualized monitoring of animal development furnishes rich longitudinal records, underpinning precise managerial judgments and lifting productive output [10]. Simple supervision of cattle growth hinges on visually judging an animal's appearance or capturing diverse growth-related indicators, such as body measurements and live weights. The traditional husbandry paradigm for managing bovine development leans on hands-on, visual inspections, competent personnel, and tools that make physical contact. These routines may stress the animals and pose dangers to stockpeople. Consequently, there stands a notable risk of dimensional errors that undermine the dependability of growth tracking [9]. To surmount these hurdles, novel non-invasive methods harnessing image processing and deep learning have been devised. One powerful tactic deploys cameras (2D and 3D) to shoot photographs from several vantage points and leverages algorithms to pull out vital body parameters like heart girth, wither height, hip height, body length, and body area [9, 11]. This approach exhibits tight agreement with physically obtained dimensions, inclusive of BW derivation from said metrics, and can substantially curtail animal stress [12]. The preponderance of studies has centered on Bos taurus cattle, which are marked by an absent or minimal shoulder hump, reduced dewlap size, and a largely symmetrical or boxy silhouette. Bos indicus cattle, in comparison, carry a conspicuous hump atop the withers and a more developed dewlap, yielding an irregular body outline with more curvature than their Bos taurus counterparts. This innate variation in physical form poses a barrier to building exact and practical body measurement pipelines tailored to this breed group.
Additionally, while cutting-edge imaging systems supply encouraging answers for automated structural measurement and BW inference, a good number of these setups call for specialized devices (like stereo depth cameras, multi-camera arrangements, or 3D imagers), are frequently pricey, and are complicated to roll out, narrowing their availability for farms of certain scales, notably among resource-limited smallholders with scant funds and technical expertise [13]. To span this divide, options that are nimble, cheap, and rely on pervasive, everyday gadgets (e.g., smartphones) that are intuitive and farmer-friendly, and that agriculturalists already keep at hand on nearly every holding, stand as realistic avenues for delivering automated body measurement and BW approximation under field conditions. Furthermore, pairing such a tool with an accessible gateway (a smartphone chat platform) could markedly magnify its reach and acceptance throughout the livestock community. These channels already belong to the daily communication fabric for numerous farmers, and launching chatbot-driven systems makes it possible to supply live facts and assistance with zero demand for supplementary hardware or specialist programs. Accordingly, this research endeavors to engineer an AI-grounded system for hands-off body identification, dimensional extraction, and BW inference in purebred Brahman cattle (Bos indicus) over a LINE messaging chatbot application, so as to promote farm-level use and heighten the efficacy and fidelity of cattle growth oversight in authentic production circumstances.
The present work drew upon 4860 photographs of sexually mature, purebred Brahman cattle (1992 males and 2868 females), ranging between 2 and 10 years old, for model training. All photographs are two-dimensional, captured at 96 dots per inch (DPI) resolution, and depict a lateral view of the animal. The full image collection was loaded into the Roboflow® environment (https://roboflow.com) and partitioned into an 80.25% training fraction (3900 images) and a 19.75% validation fraction (960 images, the subset serving to test model behavior throughout training). Image annotation was executed using the toolset provided by Roboflow, Inc. (Des Moines, Iowa, United States), with a single specialist handling the labeling for consistency. Within each image, bounding regions were manually traced to enclose the areas targeted for analysis, namely the spans of HD and BL (Figure 1). HD was quantified as the vertical distance from the horizontal line of the belly floor to the highest elevation over the hip bones. BL was quantified as the horizontal distance from the point positioned behind the front limb to the pin bone.
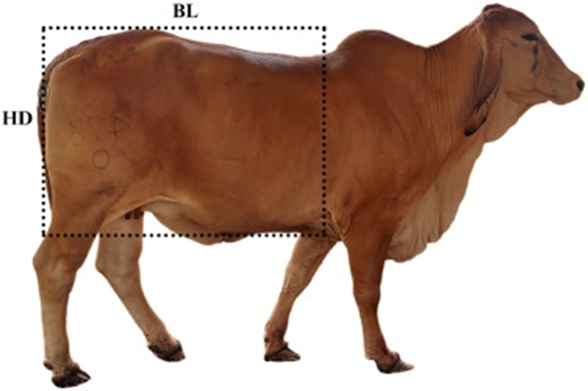
Figure 1. Drawing bounding boxes around the body of cattle based on the widths of hip depth (HD) and body length (BL).
To cultivate a more generalizable model, the training corpus must incorporate ample variation, since targets differ in dimensions, illumination regimes, and postural arrangements. Every picture underwent pre-processing: resizing to 640 × 640 pixels (Fit mode, black margins applied), followed by conversion from full color to grayscale. Augmentation strategies were activated to broaden both the volume and the heterogeneity of the training material without capturing new photographs [14]. The augmentation pipeline applied to each source picture comprised: 1) a 50% chance of horizontal mirroring (encouraging the model to disregard subject directionality), 2) luminance modulation within −15% to +15% (injecting variation in image brightness so the model adapts to changing light and camera settings), 3) exposure modulation within −10% to +10% (injecting variation in image brightness so the model adapts to changing light and camera settings), and 4) Gaussian smoothing between 0 and 1 pixels (superimposing random Gaussian blur so the model accommodates shifts in camera focus). A stochastic (3×) automated synthesis protocol incorporating all four treatments was employed, fabricating fresh variants strictly from the training pool (3900 images) to produce 11,700 newly synthesized training pictures. The definitive tally is 12,660 pictures, comprising 11,700 forming the training collection and the 960 originals serving as the validation collection.
The assembled image library was reformatted to the YOLOv11 specification to interface seamlessly with the Roboflow® platform and exported for training via Google Colab, which supplies complimentary access to cloud-located GPUs (Google CoLaboratory Pro. Google LLC. Mountain View, CA, US; Tesla A100) operating the YOLOv11 framework with COCO-pretrained weights. A transfer learning paradigm was followed, wherein the YOLOv11 model was first exposed to the dataset. The network was bootstrapped using pretrained parameters learned from the COCO corpus and subsequently refined through fine-tuning against our own annotated data.
This investigation benchmarks the effectiveness of YOLOv11 variants engineered at differing capacities, arranged into four scales: 1) small-capacity model (YOLOv11s), 2) medium-capacity model (YOLOv11m), 3) large-capacity model (YOLOv11l), and 4) extra-large-capacity model (YOLOv11xl). The directive code steering the training workflow is scripted in Python, an open-source language [https://colab.research.google.com/drive/1erH_Brn761mFdq2Z4682WSiBrqUqMF8S?usp=chrome_ntp#scrollTo=D2YkphuiaE7_]. The configuration hyperparameters included the following: model = yolov11s.pt or YOLOv11m.pt or yolov11l.pt or yolov11x.pt, batch size = 16, epochs = 100, learning rate = 0.01, and imgsz = 640.
Upon finishing the training cycle, the models underwent efficiency testing centered on detection capacity: outlining the recognized target with a box, enforcing a minimum confidence cutoff of 50% for Intersection over Union (IoU), and assigning the body region category. IoU spanned a range of 0% to 100%, capturing the extent of overlap between the actual annotation and the model-proposed bounding region [15]. A predicted boundary aligns strongly with the ground-truth boundary when IoU attains a high value. Precision, recall, and F1-score were computed from the confusion matrix following the Pascal VOC Challenge convention, employing the expressions below to dissect model capability [16]:
 (1)
(1)
 (2)
(2)
 (3)
(3)
Where (1) Precision captures the ratio of observations correctly anticipated as positive relative to the total observations anticipated as positive. Precision emphasizes the predicted positives. (2) Recall captures the ratio of observations correctly anticipated as positive relative to all genuinely positive observations. Recall emphasizes the actual positives. (3) The F1-score represents the harmonic mean synthesized from precision and recall. It offers an equilibrium between the two. TP refers to cases where the model successfully labels the positive class. Applied to cattle body regions, this signifies the model successfully classifying a body region as belonging to a given body-region pattern, i.e., a detection meeting IoU ≥ 50%. TN refers to cases where the model successfully labels the negative class. Here, it signifies the model successfully classifying a body region as not belonging to a given body-region pattern. FP refers to cases where the model erroneously labels the positive class when the true label is negative. Here, the model classifies a body region as belonging to a given body-region pattern when it actually does not, a detection for which IoU < 50%. FN refers to cases where the model erroneously labels the negative class when the true label is positive. Here, the model misses classifying a body region as belonging to a given body-region pattern when it actually belongs [16].
This experiment set out to devise a Python pipeline employing OpenCV for hands-free identification of cattle bodies alongside automated extraction of body dimensions from cattle photographs. The best-performing set of weights for each model variant was integrated into the Python pipeline to judge the reframe alignment and body dimensions on the test photograph pool of Brahman cattle (consisting exclusively of images withheld from the training process), placed side by side against photographs measured manually via ImageJ software (an open-source image processing toolkit). ImageJ constitutes a flexible image analysis environment, particularly well-adapted to measuring and examining morphometric characteristics in cattle. Through the interrogation of digital imagery, the application enables researchers to harvest detailed, precise data on varied body parameters such as body length, height, and additional skeletal measurements [17]. A set of 960 Brahman cattle test photographs was deployed to gauge the measurement concordance between body dimensions yielded by the Python script (drawing on the strongest YOLOv11 trained model) and those derived from ImageJ software, each expressed in pixel terms.
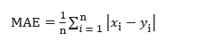
The alignment between body dimension readings sourced from the manual route and the automated route was examined through a paired t-test. The Mean Absolute Error (MAE) conveys the average magnitude of divergences between the two methodologies, disregarding the direction of the error. The mean absolute percentage error (MAPE) formulates the divergence as a percentage of the disparity between the two methodologies. Diminished MAE and MAPE figures signal tighter proximity to the reference methodology [17]. The expressions for deriving MAE (4) and MAPE (5) are given below:
 (4)
(4)
 (5)
(5)
Where n designates the image count, xi stands for the body dimension reading obtained via the automated methodology at the ith data position, and yi stands for the body dimension reading obtained via the manual methodology at the ith data position. Measurements were presented as the mean ± standard deviation.
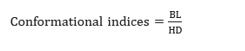
When analyses called for unique animal records, only a single picture per individual (either the left or right flank) was preserved. Following the removal of duplicate subjects photographed on both sides, a set of 4596 distinct cattle remained: 1928 males paired with 2668 females. These Brahman cattle photographs were linked to the highest-performing trained model so that conformational indices could be investigated within the broader male and female Brahman cohort. The indices describing body shape were derived through an adjusted calculation protocol originally documented in Ref. [18], following the equation presented below:
 (6)
(6)
The present work drew on body dimension readings and BW figures assembled at a commercial beef cattle enterprise situated in Thailand. The cohort of 523 Brahman cows earmarked for BW forecasting stands as a wholly new dataset, entirely independent of the initial image collection. Their ages fell within the range of 2 to 10 years. All cows experienced a fasting window of 12 h, during which both feed and water were withheld, before undergoing body measurement and live BW recording. Every subject was photographed from a side-facing orientation using a mobile phone camera (Galaxy A42, Samsung®) fixed at a height of 1.5 m above ground level, placed at a 3 m gap from the animal, with image specifications of 1920:1080 pixels (width: height). Ahead of each photographic capture, a 100 cm ruler was placed beside the animal's flank to act as a scaling benchmark. The pixel-to-centimeter conversion ratio was determined by enumerating the pixel count along the ruler's length. This derived ratio served as the multiplier for converting every body measurement within the cattle photographs into centimeter equivalents. The live weight (kg) of each animal was registered through a mechanical cattle scale installed on a steel platform. Calibration checks were performed on the scale both before the measurement campaign and periodically as data collection progressed.
Once image gathering finished, each photograph was run through a Python-based software pipeline integrated with the top-performing YOLOv11 trained model to isolate HD and BL. The pixel-unit readings were subsequently transformed into centimeter values via the scaling reference. These centimeter-adjusted outputs were then fed into the calculation of body surface area (BSA) and body volume (BV), grounded in well-established morphological relationships. The computed variables—HD, BL, BSA, and BV—were thereafter introduced as independent predictors inside a multivariate linear regression framework designed for BW estimation.
BV was derived by applying the geometric expression defining the volume of a cylinder [19]. The cylindrical volume (V) was obtained as follows: V = πr²h, where π equals 3.14, r denotes the radius, and h denotes height. Within this formulation, HD supplied the diameter of the cylinder's circular cross-section, with the radius computed as: r = ½ HD, whereas BL mapped directly onto the cylinder's height. The resultant BV was then expressed in liter (L) units as delineated below:
 (7)
(7)
BSA was derived through the formula providing the lateral surface area of a cylinder, with the circular bases excluded, as shown below:
 (8)
(8)
This manuscript introduces a service framework built around the LINE mobile ecosystem, a dominant social communication medium throughout Asian countries, harnessing an automated LINE messaging chatbot service pipeline to detect and gauge HD and BL in cattle. The system functions across both iOS and Android operating platforms. A LINE messaging chatbot was constructed atop the LINE messaging infrastructure, calling upon the Python program (the best YOLOv11 trained model) to carry out autonomous identification and measurement of cattle HD, BL, and BW.
The functional mechanism of the LINE messaging chatbot app (LY Corporation) for automated detection, measurement of cattle HD and BL, and BW derivation proceeds through the following sequence: An end user dispatches cattle photographs into the LINE messaging chatbot; these are subsequently routed to a cloud-resident AI engine hosted on the Heroku server (Heroku, Inc.) for image-level analysis. The best YOLOv11-trained model, operating inside a Docker container environment (Docker, Inc.) on the Heroku server, undertakes cattle body detection and dimensional extraction. BW values were estimated by applying the best-fitting multivariate linear regression formula. Upon completing the analysis within a 3–5 s interval, the processed images accompanied by extracted results (body measurements and BW) are transmitted back to the user via the LINE messaging chatbot (LINE Messaging API) (Figure 2).
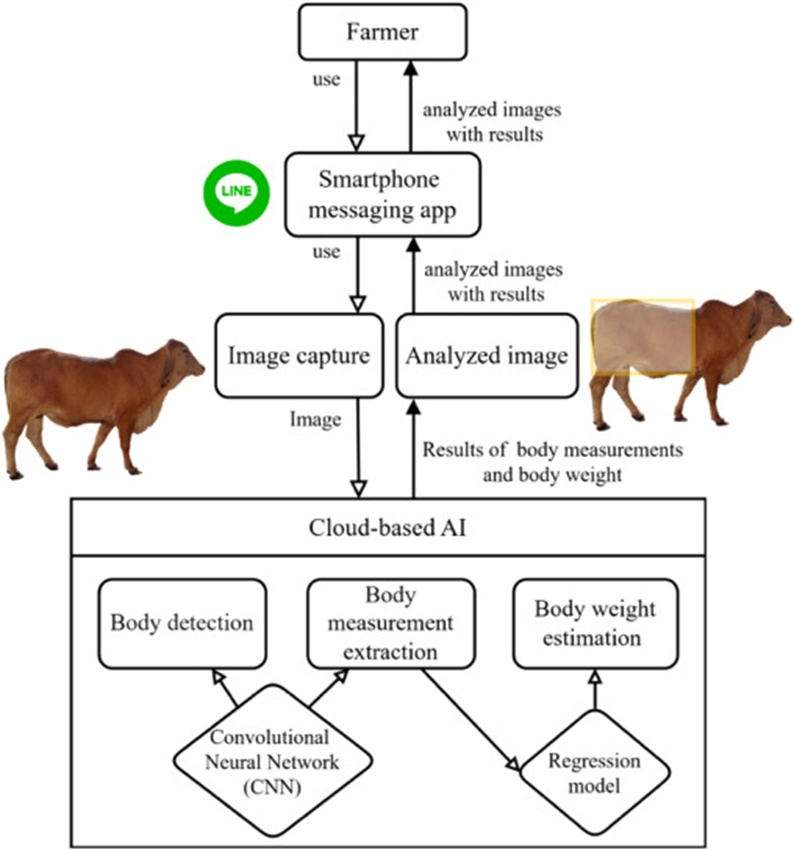
Figure 2. Diagram of the LINE messaging chatbot app based on a cloud-based AI model for cattle body detection, measurements, and body weight estimation in Brahman cattle.
Quartile boundaries (Q1, Q2, Q3) were established to capture data spread and central location for the conformational indices. These quartile markers deliver a reference baseline for interpreting the characteristic body architecture of Brahman cattle. Pearson's correlation coefficients (r) were derived to evaluate the strength of the linear association between BW and the body measurement variables. Results were expressed as r ± standard error. Multilinear regression modeling was employed to scrutinize potential linkages between BW and the suite of body measurements (HD, BL, BV, BSA). This examination culminated in the construction of a BW prediction formula. The model takes the following structure (9):
 (9)
(9)
Where Yi symbolizes the BW record of the ith animal, a₀ stands for the intercept constant, b₁, b₂, …, bₙ signify the regression slope coefficients, X₁, X₂, …, Xₙ denote the body measurement predictor variables, and εi captures the residual deviation term. The Akaike information criterion (AIC) and Bayesian information criterion (BIC) were invoked as model selection benchmarks, striking a balance between explanatory adequacy and model intricacy [20]. The specification returning the most diminished AIC and BIC scores is judged to offer the finest compromise between fidelity to the data and structural simplicity [20]. Model robustness was scrutinized through 10-fold cross-validation. Within this routine, the full dataset was stochastically segmented into 10 subsets (folds). The model underwent repeated fitting on 9 folds with evaluation on the single held-back fold, rotating across all folds to extract averaged performance indices. The predictive fidelity of the model was quantified via MAE and MAPE metrics, which capture the typical gap between observed and model-predicted BW figures in cattle. The regression model's underpinning assumptions were additionally probed: variance homogeneity was examined through Bartlett's test, while distribution normality was assessed via the Shapiro–Wilk test. A probability value meeting P ≤ 0.05 was treated as denoting statistical significance. The entire suite of statistical computations was executed within the R software environment.
YOLO11 advances feature representation through a redesigned backbone and neck structure, securing an elevated mean Average Precision (mAP) score on the COCO benchmark while operating with 22% fewer parameters relative to YOLOv8m [21]. A central merit of YOLOv11 stems from its optimized architectural design, which empowers the identification of nuanced details even when conditions are unfavorable. The model's augmented capacity for feature extraction allows it to register and interpret a wider spectrum of patterns and elaborate visual constructs within images [21]. The YOLO11 product line spans several magnitude tiers: YOLOv11n (Nano), YOLOv11s (Small), YOLOv11m (Medium), YOLOv11l (Large), YOLOv11xl (Extra-Large) [21]. More compact configurations tend to be better matched for real-time inference on mobile or embedded devices, whereas bulkier configurations may be set aside for applications where heightened precision is critical and computational resources pose fewer constraints [21]. Based on this rationale, the YOLOv11 framework was chosen as the backbone for training a model to pinpoint the body region of Brahman cows.
After the training phase for the YOLOv11 variants concluded, a graphical summary of performance was rendered (Figure 3). The YOLOv11s variant posted a mAP of 99.49%, complemented by a box loss of 0.151%, cls loss of 0.079%, a model storage requirement of 19.2 MB, and a training runtime of 2 h. The YOLOv11m variant delivered a matching mAP (99.49%) while achieving a modest reduction in box loss (0.144%) and cls loss (0.074%), with a model storage requirement of 40.5 MB and a runtime of 3 h. The YOLOv11l variant sustained the same mAP level (99.49%), accompanied by further decrements in box loss (0.143%) and cls loss (0.069%), needing 4 h to complete training and occupying 51.2 MB. The YOLOv11xl variant reached the supreme mAP (99.50%) alongside the most suppressed box loss (0.141%) and cls loss (0.067%), though it carried the bulkiest storage footprint (114.4 MB) and demanded the lengthiest training window (5 h).
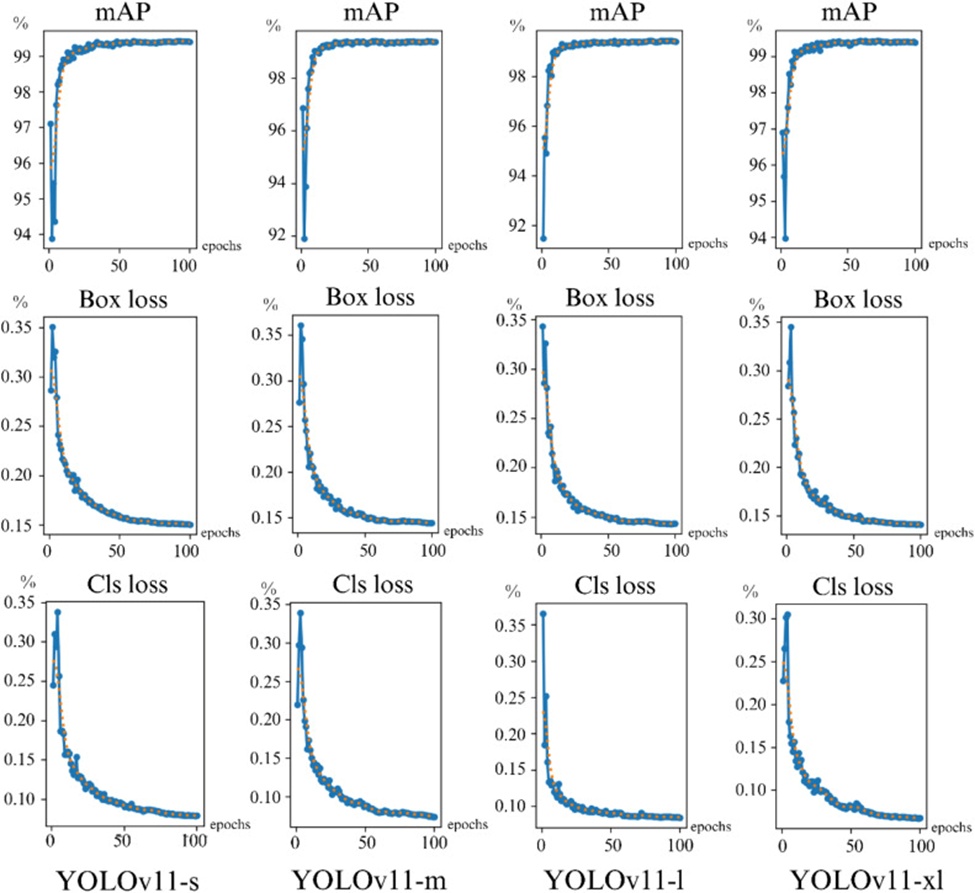
Figure 3. Graphs of performance during training of body area model based on YOLOv11s, YOLOv11m, YOLOv11l, and YOLOv11xl models.
The procedure for judging model quality leaned on mAP together with the validation loss components (box and cls). Stated broadly, mAP is the average of the proportions of genuine positives relative to total positives calculated over the full sweep of recall values [22]. The YOLOv11 design integrates object detection along with classification loss formulations to measure the categorical mismatch between the predicted bounding annotation and the corresponding ground-truth annotation [23]. Owing to this, the mAP metric is commonly adopted as the target criterion for benchmarking model proficiency while training proceeds and for steering decisions when singling out the strongest model from among the YOLOv11 family. Judging from the training outcomes recorded in the present experiment, as additional iteration cycles elapsed, the model progressively absorbed more information, a trend reflected in diminishing training loss values across later epochs. From epoch 90 onward, the loss curves exhibited relative stabilization, implying that the network's learning trajectory was advancing toward greater exactitude [24]; accordingly, residual training loss at this stage was presumably negligible, a pattern visually conveyed in Figure 3.
Box loss corresponds mathematically to the regression error associated with bounding box placement. Its monotonic decrease signals that the model is incrementally refining its object localization capacity [25]. Cls loss corresponds to the error linked with classification (the confidence score assigned by the model to detected objects). Its parallel reduction indicates that the model is sharpening its ability to output the correct class designations [25]. As a general principle, when the validation loss curve descends toward zero at a pace exceeding that of the corresponding training loss curves, this behavior points to the model transferring well to the unseen validation partition. Validation loss estimates how the model reacts when confronted with novel data instances [25]. Hence, the early convergence toward near-zero territory suggests the model is successfully assimilating salient and broadly applicable feature representations from the training distribution [25].
Even as the loss quantities declined markedly, the mAP figure exhibited a steady ascent before reaching a plateau. Within the current investigation, it became evident that all model size categories yielded remarkably similar mAP readings alongside minimal loss magnitudes. The mAP statistic encapsulates behavioral competence along two axes: the capacity for correct classification (identifying which object category appears in the image) and the capacity for correct localization (determining where the object sits spatially within the image). Operationally, mAP is obtained by averaging the precision quantities across all object classes over a sweep of threshold settings that govern the minimum permissible overlap between the forecast and reference bounding regions (IoU) [26]. It merits emphasis that, given our models were exclusively trained on the single body area category, the body area AP figure effectively serves as the mAP, a standard yardstick within the object detection domain [22]. Superior mAP readings translate directly into more dependable detection of the cow body area [27].
The high-precision magnitudes observed indicate that the models maintain a notably low false positive rate, meaning they seldom erroneously flag unrelated anatomical features or background scenery as HD and BL. A recall statistic reaching 100% across every model scale demonstrates that the models unfailingly capture HD and BL in each occurrence, failing to flag any authentic instance. The F1-score, which synthesizes precision and recall into a single balanced indicator, reached exceptionally elevated territory (Table 1). An increased F1 score is interpreted as evidence of a more proficient model [28]. Moreover, all models exhibited the capacity to dependably pick out the lateral body outline of cattle even when operating against disparate environmental settings characterized by subdued contrast, blurring distortions, and ambiguous visual detail. To support this robustness, an image augmentation protocol was instituted that systematically varies brightness, exposure, and blur levels within the dataset so that the training distribution mirrors photographs collected under heterogeneous conditions. Data augmentation is conventionally embedded within the pre-processing stage of dataset preparation for training image detection and classification systems, particularly CNN-based architectures, as it expands the learning signal and contributes to elevated end performance [29].
Table 1. Performance metrics of YOLOv11 trained models for different.
Model | IoU | F1-score | Recall | Precision |
YOLOv11s | 97.62% ± 1.31% | 99.89% | 99.96% | 99.82% |
YOLOv11m | 97.68% ± 1.31% | 99.92% | 100% | 99.85% |
YOLOv11l | 97.67% ± 1.31% | 99.91% | 99.98% | 99.84% |
YOLOv11xl | 97.67% ± 1.32% | 99.91% | 99.98% | 99.83% |
Within object detection workflows, a model must concurrently pinpoint spatial placement and assign accurate class labels. IoU represents the fraction formed by the intersection area over the union area of the forecast bounding region and the ground-reference annotation [26]. For downstream reliability, the learned model ought to yield values approaching 100%, guaranteeing that extracted boundary contours faithfully correspond to the cow's actual body position, inclusive of both width and length dimensions destined for later computations. Among the candidates, the YOLOv11m variant registered the strongest IoU performance at 97.68% ± 1.31% (Figure 4), demonstrating that this architecture delivers superior geometric precision when resolving HD and BL in cattle, rendering it the preferred option for continued deployment. Architecture scaling typically brings expanded parameter budgets, granting capacity to encode richer feature hierarchies. Yet beyond a saturation boundary, supplementary complexity may furnish negligible accuracy returns, above all when a leaner configuration already accounts for the dataset's inherent variance [30, 31]. Within these experiments, the performance spread separating YOLOv11m, YOLOv11l, and YOLOv11xl proved negligible, indicating the extra capacity housed within the larger configurations adds marginal discriminative benefit. Consequently, we select the YOLOv11m trained checkpoint as the backbone for developing a detection-measurement pipeline that also estimates BW from imagery under real-time constraints, leveraging its intermediate footprint to conserve computational overhead while accelerating inference speed [21].
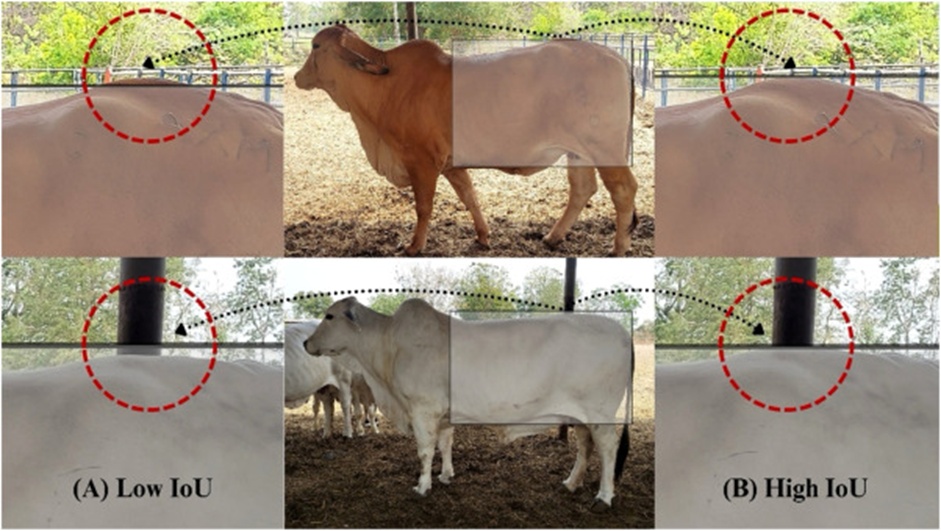
Figure 4. Examples of predicted bounding boxes with HD and BL detection errors on Brahman cow images with the YOLOv11 trained model at different sizes, with (A) low IoU values and (B) high IoU values.
The present work deploys an automated quantification protocol realized through a Python codebase interfaced with the YOLOv11m trained weights (Figure 5). The software processes incoming photographs, autonomously locates critical anatomical landmarks distributed across the bovine frame, and independently derives dimensional outputs—spanning length and width—grounded in pixel enumeration. The reference manual workflow relies on ImageJ software for extracting body dimensions from cattle photographs. A human operator activates line or rectangular selection utilities to manually outline and gauge target body segments, ultimately computing measurement figures via arithmetic analogous to that executed by the Python pipeline. HD readings harvested from Brahman cattle test photographs and analyzed through ImageJ software versus the YOLOv11m model registered at 391.50 ± 89.96 pixels and 391.76 ± 89.85 pixels, respectively. Correspondingly, BL readings processed via ImageJ and the YOLOv11m model registered at 572.15 ± 137.65 pixels and 571.32 ± 137.34 pixels, respectively.
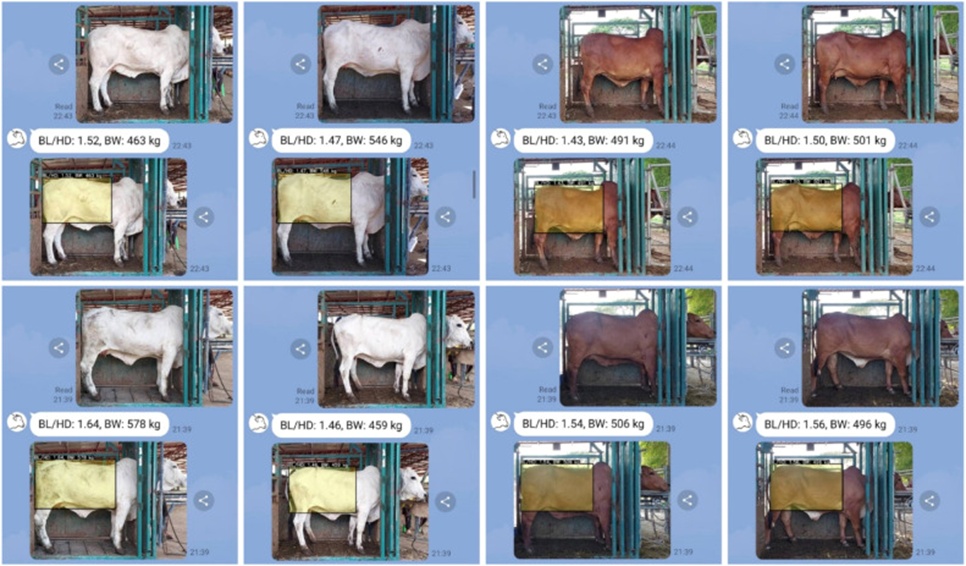
Figure 5. Example of the dialogue between the user and the LINE messaging chatbot app during computer vision service.
Placing body dimension estimates sourced through the manual pathway (ImageJ software) side by side with those emerging from the automated pathway (YOLOv11m model) uncovered statistically significant divergences. HD measures differed reliably between the ImageJ and YOLOv11m pipelines (P = 0.029), as was the case for BL measures (P = 0.001) (Table 2). In the case of HD, MAE settled at 1.39 pixels, matched by a MAPE of 0.36%. For BL, MAE amounted to 1.74 pixels, alongside a MAPE of 0.32%. Although these gaps satisfied conventional significance criteria, the subdued MAPE magnitudes underscore that, operationally speaking, the offset between the two measurement pathways is trivial. The tight error margins confirm that both modalities generate outputs of comparable practical value. Still, the Python-based YOLOv11m pipeline constitutes a far more hands-off and time-efficient replacement for the labor-intensive manual mensuration sequence inside ImageJ software.
Table 2. Performance metrics of hip depth (HD) and body length (BL) measurements obtained from Brahman cattle images and analyzed using ImageJ computer software and the YOLOv11m model method.
Measurements | Measurement methods | MAPEb | MAEa | P-value | |
YOLOv11m | ImageJ | ||||
HD | 391.76 ± 89.85 | 391.50 ± 89.96 | 0.36% | 1.39 | 0.029 |
BL | 571.32 ± 137.34 | 572.15 ± 137.65 | 0.32% | 1.74 | 0.001 |
Note: a: Mean absolute error, b: Mean absolute percentage error.
This manuscript introduces an original, cost-conscious framework that marries smartphone-enabled machine vision with a LINE chatbot interface to deliver real-time, touch-free quantification of HD and BL from whole-profile photographs of Brahman cattle (Bos indicus). The methodology foregrounds morphometric characterization and its coupling to live BW and growth-correlated parameters. Marked Pearson correlation coefficients bridging HD and BL were documented among males (0.98 ± 0.02, P < 0.01) as well as females (0.99 ± 0.02, P < 0.01), pointing toward a tendency for longer-framed individuals to concurrently express deeper hip dimensions—features integral to carcass yield [5, 32, 33]. Histogram visualizations depicted an approximately bell-shaped spread of BL: HD ratio values across both sexes (Figure 6), wherein males exhibited a fractionally higher central tendency (1.45 ± 0.08) contrasted against females (1.44 ± 0.07), plus amplified scatter (CV: 5.27 vs. 4.89). Boxplot renderings brought to light closely matched interquartile spans (IQRs), where males ranged across Q1–Q3 thresholds of 1.40–1.50 and females across 1.40–1.49 (Figure 6). These distributional signatures intimate a gentle degree of sex-driven conformational divergence [4, 34].
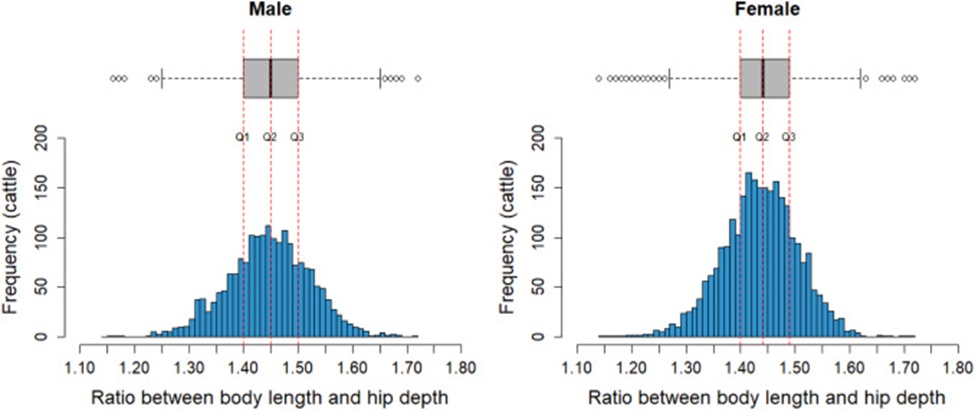
Figure 6. Histograms and boxplots to visualize the distribution of the body length to hip depth ratios among male and female Brahman cattle.
Brahman sires, steered by hormonal cascades and genetic programming, habitually accumulate superior lean tissue mass and stouter skeletal architecture relative to dams, an effect particularly pronounced in the post-weaning phase [35]. This phenomenon manifests as elevated BW gain, leaner carcass profiles, and greater cutability of premium sections, including loin and rib-eye [4, 6]. Dams, conversely, are inclined to present modestly suppressed BL: HD ratio values, mirroring a more symmetrically proportioned physique aligned with reproductive competence, taking in features such as broader pelvic geometry and heightened adipose storage conducive to parturition success [3, 36, 37]. Examination of residual deviations brought forward subtle yet systematic sex-attributable offsets (males: +0.005, females: −0.005 relative to the pooled average), figures that may operate as reference anchors within structured selection regimes. Channeling selection emphasis toward elevated BL can indirectly lift HD, thereby augmenting carcass merit in sires while safeguarding conformational equilibrium among dams [32-34].
Viewed through an applied genetic improvement lens, stratifying livestock by IQR supports the fine-tuning of herd architecture in service of defined production endpoints. As a case in point, augmented BL: HD ratios in sires covary with expanded frame class and superior daily liveweight gain, variables that advance dressed-meat output [3, 38, 39], whereas mid-range or moderated ratios in dams foster earlier physiological maturation and elevated calving rates [36-38].
The present work confirms that BW and its allied morphometric descriptors in Brahman cows adhere to Gaussian distributional forms and exhibit steady linear covariation, endorsing their suitability for operational phenotyping and herd administration (Figure 7). The cohort's arithmetic mean BW registered at 502.61 ± 73.79 kg, flanked by associated average values of HD equaling 70.96 ± 4.13 cm, BL equaling 104.36 ± 6.87 cm, BV equaling 415.30 ± 64.83 L, and BSA equaling 2.33 ± 0.24 m². Across this variable suite, BW displayed moderate-to-strong positive interdependency with BV (r = 0.67 ± 0.03) and BSA (r = 0.68 ± 0.03), conveying that each of these aggregate indices individually functions as a competent mass estimator. By comparison, the ties binding BW to HD (r = 0.59 ± 0.04) and BL (r = 0.57 ± 0.04) settled at moderate intensity, implying these unidimensional metrics operate as auxiliary signposts of skeletal blueprint and frame scale, not as direct mass surrogates [5, 40, 41].
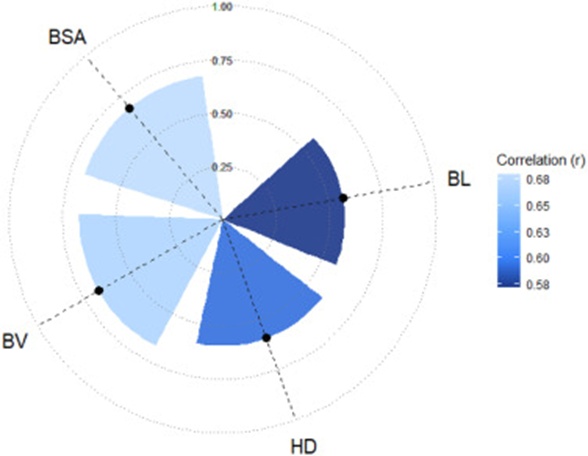
Figure 7. Pairwise scatter plot matrix, histogram, and correlation coefficients of phenotypic correlation among body weight (BW) and body measurements for body length (BL), hip depth (HD), body volume (BV), and body surface area (BSA) in Brahman cows. Pairwise scatter plots are in lower triangle boxes, histograms are in diagonal boxes, and upper triangle boxes give the correlation coefficients between variables (P-value < 0.001).
Linear regression output (Table 3) indicated that BW projections formulated from HD alone and BL alone generated mean absolute errors (MAE) of 48.36 kg (9.92% MAPE) and 49.03 kg (10.12% MAPE), respectively. Forecasts resting on BV and BSA yielded tightened accuracy, recording MAE figures of 44.31 kg (9.07% MAPE) and 43.53 kg (8.92% MAPE), respectively (P < 0.001), a trend suggesting these combined metrics render body mass with superior fidelity [5].
Table 3. Linear regression between body weight and body measurements in Brahman cows.
Equation | BIC | AIC | MAPEb | MAEa | P-value |
BW = −139.30 + 6.15 (BL) | 5793 | 5780 | 10.12 | 49.03 | < 0.001 |
BW = −249.87 + 10.60 (HD) | 5774 | 5761 | 9.92 | 48.36 | < 0.001 |
BW = 185.22 + 0.76 (BV) | 5687 | 5674 | 9.07 | 44.31 | < 0.001 |
BW = 25.14 + 204.99 (BSA) | 5676 | 5663 | 8.92 | 43.53 | < 0.001 |
BW = −461.05 + 7.52 (HD) + 4.12 (BL) | 5676 | 5659 | 8.91 | 43.44 | < 0.001 |
Note: BW = Body weight, HD = Hip depth, BL = Body length, and BSA = Body surface area; a: Mean absolute error, b: Mean absolute percentage error.
Recognizing that BV and BSA are algebraically constructed from HD and BL, merging both foundational inputs lifts predictive precision. Paputungan et al. [42] comparably reported model strengthening when supplementary predictor variables were introduced. Within the current analyses, simultaneously incorporating HD and BL compressed the MAE to 43.44 kg and the MAPE to 8.91% (P < 0.001), reaffirming the merits of multivariable specifications for BW inference.
The specification concurrently deploying HD and BL also posted the most competitive AIC and BIC statistics (Table 3), signaling an optimal compromise between goodness-of-fit and structural economy [2]. This finding validates its fitness for deriving BW in Brahman cattle under on-farm conditions. These outcomes resonate with prior literature identifying HD and BL, together with thoracic circumference, as dependable mass correlates in Brahman crossbred groups [4, 39].
Additionally, this tactic harnesses commonplace smartphone hardware constrained BW estimation imprecision to sub-10% thresholds, matching investigations that apply convolutional neural network or artificial neural network paradigms, which document equivalent margins (≈10% MAPE) for digitally sourced BW inference [43]. In day-to-day ranch application, the encountered predictive discrepancy resides within pragmatically tolerable bounds, even supposing the approximated mass strays by approximately ± 20% from the scale-recorded value. The downstream variations in computed dietary rations or veterinary pharmaceutical doses prove modest and remain within acceptable safety envelopes [44].
This methodology nonetheless carries certain boundary conditions. Field observations accumulated during this study indicate that cow mass estimation fidelity depends critically on aligning the camera sensor at an exact orthogonal 90-degree angle relative to the animal's lateral plane and on preserving a fixed 3 m standoff gap linking the smartphone imager to the cow's body, parameters needed to lock a uniform pixel-per-centimeter ratio as the photograph's internal reference scale. Deviations toward nearer or more distant positioning risk warping the reference conversion factor, thereby eroding estimation validity. This constraint delineates a continuing research horizon for crafting algorithms or procedural innovations capable of autonomously resolving the image-embedded reference scale independent of the capture distance employed.
To extend domain coverage and fortify platform resilience outside purebred Brahman contexts, upcoming investigations should benchmark the framework across broader Bos indicus and Bos taurus breed types habitually stewarded within tropical husbandry systems. Scheduled validation runs featuring Charolais × Brahman and Angus × Brahman composite beef stock, as well as Holstein Friesian × Brahman dairy cattle, will assist in appraising model fidelity inside populations carrying diversified conformational architectures. Extending performance audits to encompass these genotypic classes will corroborate the system's portability along the full genetic continuum characterizing tropical livestock operations.
Beyond breed-level generalization, rigorous examination of system conduct under heterogeneous real-world operational settings—encompassing fluctuating natural illumination, background scene complexity, postural variation among animals, and angular displacement of the capture device—is imperative, given that such elements can profoundly modulate image integrity and, in consequence, shift the precision of anatomical landmark recognition and mass inference. Systematically confronting these environmental modifiers will strengthen the instrument's trustworthiness and uniformity when mobilized across varied smallholder and commercial husbandry contexts.
Although this investigation employed 2D photographic capture through standard smartphone optics to foreground cost accessibility and operator simplicity, considerable opportunity resides in adopting emergent 3D imaging and depth-mapping sensor suites for heightened morphometric resolution. These modalities hold potential to refine the quantification of volumetric attributes and deliver enriched spatial authenticity when registering body proportions, changes that could further sharpen body mass forecasting performance. As 3D-enabled portable devices become progressively more economical and ubiquitous, eventual assimilation of such functionality may dampen operator-linked variability and elevate system autonomy. Earlier demonstrations by Imamura et al. [45] and Zin et al. [46] substantiate the practicality and added value of 3D imaging within livestock biometric contexts. Extending from these foundational contributions, a future platform iteration integrating 3D imaging hardware constitutes a propitious vector for progressing precision phenotyping and modernizing digital animal management.
This body of work establishes that a smartphone-anchored platform operating a convolutional neural network grounded in the YOLOv11m architectural design can isolate and measure HD and BL in Brahman cattle with notable exactitude and throughput. The model realized elevated detection spatial fidelity (IoU = 97.68 ± 1.31%) together with marginal mensuration offset relative to manually executed benchmarks. The robust correlative ties joining HD and BL support their candidacy as selection criteria within genetic advancement schemes. A regression equation fusing HD and BL proved the most faithful BW estimator (MAPE = 8.91%). This economical, non-contact apparatus delivers a feasible pathway for instantaneous cattle oversight and informed selection, above all within production landscapes marked by resource scarcity.
The authors are grateful to the technical staff of Loong Chow Co. Ltd., Suphanburi, for their invaluable support and collaboration.
None
The authors would like to acknowledge the Graduate School Fellowship Program, Kasetsart University, for providing financial support to the first author through a research scholarship. The authors also thank the Kasetsart University Research and Development Institute [FF(KU)54.67] for funding support.
This study was approved by Kasetsart University’s Institutional Animal Care and Use Committee, Thailand (Approval no. ACKU67-AGR-025).
Open Access The author(s) retain copyright. This article is licensed under the Creative Commons Attribution-NonCommercial-ShareAlike 4.0 International License. It may be shared and adapted for non-commercial purposes with appropriate attribution, an indication of changes, and distribution of adaptations under the same license. Third-party material may be subject to separate terms identified in its credit line. View the license at https://creativecommons.org/licenses/by-nc-sa/4.0/.
 Agro Intelligence Research Press