Rice blast (RB) and brown spot (BS) represent two economically impactful diseases in rice cultivation, responsible for substantial annual yield reductions. Both pathogens infect the same host plant and produce lesions of remarkably similar appearance, leading to frequent misidentification by growers. Correct identification is vital to ensure effective disease control. Visual diagnosis requires trained personnel, while laboratory-based molecular assays, although precise, are costly and time-consuming. The present study examined whether lesions from these two diseases could be distinguished using proximally sensed digital RGB images and calculated colour indices. A smartphone camera was used to capture digital photographs of the lesions. A set of thirty-six colour indices was assessed via k-means clustering for disease separation, utilising three colour channel systems: RGB, HSV, and Lab. In summary, image backgrounds were masked so that only the leaf spot lesion remained, and colour indices were then computed as features from the lesion’s central portion, reflecting the diagnostic practice commonly employed by plant pathologists. The outcomes indicated that the complete set of 36 indices separated the two diseases with an accuracy of 84.3%. It was also noted, however, that accuracy was largely driven by indices related to the R, G, and B profiles, with the remaining indices contributing little. The indices G/R, NGRDI, (R + G + B)/R, VARI, (G + B)/R, R/G, Nor_r, G-R, Mean_A, and Logsig were singled out as providing the greatest contribution to disease discrimination. Accordingly, these specific RGB-derived colour indices can be applied alongside the k-means algorithm to separate blast and brown spot diseases. The study’s outcomes deliver a non-destructive, alternative objective means of recognising RB and BS disease symptoms. On the strength of these results, a mobile application named Blast O spot was created to perform field-level disease differentiation.
As stated by the International Rice Research Institute (IRRI) [1], rice constitutes a fundamental carbohydrate source and staple food for more than half of the global population. Rice yields are constrained by multiple diseases, with rice blast (RB) and rice brown spot (BS) among the most important [2-4]. Both RB and BS are fungal diseases. The ascomycete fungus Magnaporthe oryzae [5] is responsible for RB, while BS is predominantly attributed to Bipolaris oryzae [6]. Following infection, leaves of affected plants in both cases form elongated spot lesions that steadily expand, impairing photosynthetic function in green tissues [4, 7, 8]. Without adequate management, this can translate into severe yield penalties; on average, RB can lead to a 30% loss [5] and BS to a 52% loss [9] in rice cultivation.
Growers in Sri Lanka and elsewhere have encountered persistent difficulty in managing RB and BS diseases due to the challenge of distinguishing their symptoms. Drawing on expert knowledge and IRRI guidance, RB lesions are defined as elliptical to spindle-shaped, possessing whitish to grey centres and necrotic borders [10]. In contrast, BS lesions are characterised as circular to oval, with a light brown or grey centre encircled by reddish-brown margins [11]. The stage-dependent divergences between the two diseases are shown in Figure 1.
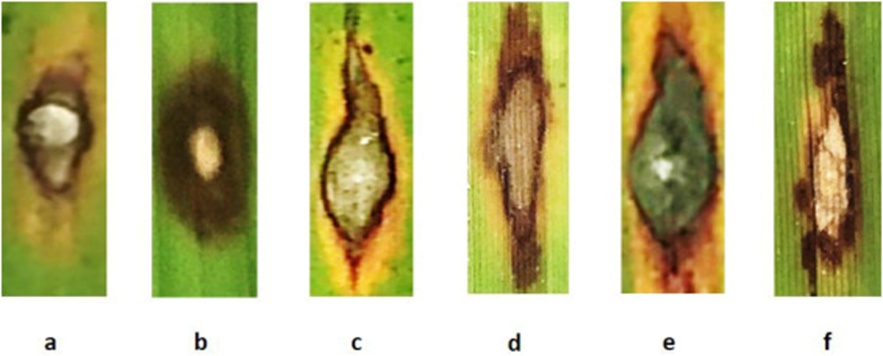
Figure 1. Visual representation of RB and BS lesions at different disease stages: (a-b) initial stages of disease; (a) the RB lesion water-soaked in appearance, spindle shape with brown edges, (b) BS lesion oval shape in appearance with thick purplish black edges, (c-d) middle stages of disease; (c) RB lesion enlarges with the white centre because of fungal mat, (d) BS lesion often appears as a thin brown surface in the centre region most probably without mycelium, (e-f) severe stages of disease; (e) RB lesions with grey colour fungal mat appearance in the centre, and (f) BS lesion with necrotic region visible adjacent to the lesion with a reddish-brown edge.
Differences in colour gradation extending from the lesion centre to the edge can serve as a basis for distinguishing RB and BS. Even so, farmers and agricultural extension officers in Sri Lanka routinely struggle to separate them. Given that symptom expression in the two diseases is often overlapping and appears concurrently on the same leaf, differentiation poses a genuine challenge. Established identification protocols and elaborate symptom descriptions fall short when disease presentations converge due to factors such as weather patterns, crop management practices, cultivar choices, and competitive dynamics among pathogens. We administered a symptom differentiation survey to 60 randomly selected farmers, yet no one could correctly identify the symptoms.
Furthermore, during specimen collection, agriculture extension officers (5) likewise failed to distinguish the symptoms properly. They regularly misidentified them as blast, a common disease in Sri Lanka’s Northern Province. This diagnostic confusion underscores the pressing need for precise diagnostic tools that ensure accurate disease identification and enable appropriate intervention. Selecting cultivars with resistance to regionally relevant diseases ranks among the most promising and ecologically sound strategies. By accurately diagnosing diseases, farmers can adopt targeted management tactics, reducing dependence on chemical inputs and advancing sustainable agricultural practices.
Additionally, identification by the unaided eye requires trained skill, which is frequently unavailable among farmers and agricultural officers alike. Beyond this, qualitative assessments inherently vary with the assessor’s experience, and decisions may be swayed by temporal shifts in symptom presentation and inconsistencies across evaluators [12, 13]. An objective, quantitative approach to lesion identification is thus urgently needed to facilitate prompt disease management and forestall major outbreaks.
Among currently available diagnostic approaches, laboratory-based molecular genetic methods offer high accuracy. For example, a dedicated primer pair, PfH2A/PfH2B, has been used for selective PCR-based detection of M. oryzae, the causal agent of RB [14]. Yet these procedures call for sophisticated laboratory setups, specialist training, destructive sample collection, and analysis conducted away from the field. Therefore, an objective methodology for differentiating RB and BS leaf lesions that is faster, performable on-site, non-destructive, and inexpensive would be strongly favoured.
Remotely captured digital colour images and the corresponding image analysis workflows serve as a substitute for human visual assessment [15] and have been widely applied across disease identification, symptom recognition, and severity estimation [16]. This approach represents a well-established means of non-contact acquisition of reflected spectral/colour data from plant foliage to infer tissue condition [17]. Proximal sensing devices, including smartphone cameras, offer distinct advantages over platforms such as unmanned aerial vehicles and satellites, as smartphones are affordable, accessible instruments that any farmer can readily deploy at ground level to inspect localised disease symptoms, including RB and BS lesions.
• A novel methodology for discriminating between RB and BS, two symptomatically overlapping diseases, through the translation of laboratory-based findings into image-based sensing approaches. An exhaustive, side-by-side evaluation of diverse colour indices was conducted to identify those indices best suited for reliable disease symptom identification.
• Deployment of k-means clustering for the categorisation of RB and BS: The investigation harnesses the k-means clustering technique to reliably sort and separate RB from BS. This technical advancement illustrates the promise of unsupervised learning frameworks for disease diagnosis in the agricultural domain.
• Building of a straightforward, intuitively operable mobile application: Drawing upon this research, a basic, user-centric mobile application christened “Blast O Spot” was engineered. This provides substantial practical support to growers and agricultural field personnel in reliably diagnosing RB and BS.
The manuscript is structured around the following segments:
• The Introduction portion incorporates the literature review, which sets out the context of rice cultivation, the obstacles faced by the industry, the ramifications of RB and BS, and the diagnostic techniques deployed in agriculture, thereby building the case for the present investigation.
• The Method portion delineates the gathering of samples, laboratory authentication of RB and BS, and the step-by-step procedures adopted to select the most effective model for the classification of RB and BS.
• The results and discussion portion lays out the outcomes generated by the current study and weighs the efficacy of our model against that of previously reported models.
Rice is grown on upwards of 150 million hectares worldwide and provides sustenance for 3 billion people [18]. The yields of principal cereal crops—maize, wheat, rice, and soy—will need to climb by 87 % to nourish the ever-expanding human populace [19].
Rice farming is hampered by a variety of factors, including shifting global climate patterns, natural disasters, and plant diseases [20]. Fungal disorders such as RB, sheath blight, BS, and sheath-rot, along with bacterial afflictions such as bacterial blight and viral conditions exemplified by rice tungro disease (RTD), are among the foremost diseases compromising rice [21].
In numerous countries, including Sri Lanka, two financially detrimental diseases—BS and RB—have curtailed rice output. In addition to their power to drastically reduce yields, they can also degrade the quality of the grain produced, rendering it unfit for human use once the panicle is heavily infected. As such, they have been held accountable for devastating famines across Asian nations [22]. In the Sri Lankan context, RB and BS represent prevalent, regularly occurring fungal infections spanning both the Maha and Yala cultivation cycles [23]. A major blast epidemic was recorded, most acutely in the Mannar district during 2016, where substantial harvest losses were suffered. Scholarly work focused on these diseases within the Northern Province remains wanting, and research publications from other areas of the nation are similarly thin on the ground.
Plant pathologists habitually lean on visible signs to arrive at a diagnosis. Getting the diagnosis right typically steers management towards greater efficiency, curtailing or eliminating the squandering of inputs. Putting together a faithful description of disease signs is far from simple and can be difficult. Symptoms can shift noticeably depending on when the infection occurs, which cultivar is involved, and the prevailing weather conditions. Accurately identifying while juggling all these variables is a formidable hurdle, even for battle-hardened pathologists. The task grows all the more formidable where two or more diseases provoke near-identical signs, as is true of BS and RB (Figure 1). A grower faces an uphill battle trying to correctly read the signs in such circumstances and will commonly fall back on specialist counsel, which may not be on hand in many corners of the globe. Given that misdiagnosed diseases can lead to total crop failure, correctly identifying them at the earliest stages is imperative. The targeted chemical agents advocated for bringing BS and RB under control are distinct as well [24].
The most widespread route to disease identification relies on inspections conducted either in situ or in the laboratory. The workflow calls for distinguishing healthy from ailing specimens, correctly identifying symptoms, and teasing apart those symptoms by timing and the specific plant organs involved. The technique leans heavily on visual signals and pre-compiled diagnostic handbooks. A range of such handbooks exists to help growers pinpoint symptoms accurately [25].
The traditional microbiological workflow entails deploying enormous numbers of microbial cells as starting material and growing them on substrates such as agar for evaluation by eye and under magnification. A shortcoming of this conventional practice is that broad-brush traits observed across millions of microbial cells under a microscope often fail to reflect the actual characteristics of each cell [26]. Another complication posed by microbes is their tendency to diversify into new strains over remarkably short intervals. Even within a single culture dish, an assortment of sub-strains, serotypes, and phage types can coexist. Many pathogenic organisms may also exhibit indistinguishable morphological features, leading to erroneous identification. As a rule, plant pathogen identification involves a visual appraisal of symptoms, along with benchtop procedures such as culturing the organism on selective growth media, which are ordinarily followed by physiological, biochemical, and/or pathogenicity assessments. All these workflows are painstaking and sluggish [27].
Antibody-driven testing has featured in plant pathogen surveillance since the 1980s [28]. Although this avenue provides a rapid and responsive means of detecting plant pathogens, it carries a steep price tag, and closely related strains can mount indistinguishable responses when exposed to the same antibody. Molecular toolkits deliver fast workarounds to the shortcomings listed above. PCR-based assays targeting polymorphisms in nuclear, mitochondrial, and ribosomal DNA have been applied for species-level characterisation [29]. Metagenomic next-generation sequencing (mNGS) is a comparatively recent innovation that has seen extensive uptake for pathogen screening of samples whose pathogenic makeup is unknown. Compared with conventional molecular assays, mNGS captures the sequence information of every DNA or RNA molecule in the diseased specimen, providing a high-throughput platform that can sequence not only the entire microbiome but also the host genome. It makes the primer design step easier by eliminating the need for bespoke primers and probes that would otherwise constrain the dataset’s breadth. This platform yields improved dependability in pinpointing the causative agent.
Remote sensing is another tool for probing the properties of a target without physical contact. The practice is widely used to delineate vegetation’s biophysical traits using ground-level, airborne, or satellite-mounted remote sensing platforms. The approach has been applied to investigate yield prediction [30], nutritional demands [31], pest incursions [32], and lesions and pathogen-inflicted injury [33].
In plant disease research, it is customary to represent the reflectance wavebands recorded in smartphone photographs as colour indices. These indices are essentially ratios of colour channels that correspond to leaf pigments, most notably chlorophyll concentration, housed within the foliar tissues [34]. As a disease progresses, it disrupts the tissue’s pigment profile, leading to shifts in pigment makeup that ultimately give rise to the lesions distinctive to that malady [35]. The reflected colour signature specific to any given lesion can, in turn, be expressed as a numerical colour index value. What is more, moving beyond a single colour index (CI) toward a suite of CIs enables the extraction of a range of colour attributes from lesions. This approach can yield considerable dividends in image-based analysis.
Red, green, and blue (RGB) images captured with digital or smartphone cameras have proven their worth as a proximal sensing apparatus across a spectrum of leaf- and canopy-scale investigations centred on disease expression. Salgadoe et al. [36] derived canopy traits tied to Phytophthora root rot affliction in avocado trees by way of gap analysis. Saberioon et al. [37] scrutinised 27 distinct colour indices to gauge nitrogen levels in rice plants growing in paddy fields across six developmental phases, using RGB as the primary colour channel for image transformation. The investigation identified Green (G) and the Kawashima index (IKAW) as the foremost indices for nitrogen level estimation. The research further indicated that inexpensive digital cameras are a perfectly viable means of capturing digital images and could serve as a handy, intelligent device for small-scale cultivators. Research conducted by Mohan and Gupta [38] underscored the utility of the RGB channel in appraising leaf chlorophyll content from digitised images of rice foliage. The authors concluded that the brightness ratios (R, G, B), whether taken in isolation or coupled with a dark green colour index (DGCI-rgb), showed a robust correlation between forecast chlorophyll levels and relative chlorophyll measures when processed via an artificial neural network (ANN) framework. Beyond this, the RGB component breakdown was used to predict the true foliar chlorophyll content in leaves of both Quinoa and Amaranth [39]. In the case of Barley [40], exploration of the linkages between chlorophyll concentration and colour indices sourced from the RGB and Lab colour spaces established that RGB-driven indices—specifically R, G, (R + G + B), R-B, R + B, R + G—alongside Lab space metrics—namely L, a, and b—maintained a meaningful connection with chlorophyll levels. Chlorophyll within citrus foliage has similarly been projected with success through Linear Regression and ANN models by drawing upon RGB-anchored colour indices encompassing R, G, B, (R-B)/(R + B), R + G + B, (G + B)/R, G/R, (R + G + B)/R, (G-R)/(G + R), (G-R), (G + R), G/(R + G + B), R/(R + G + B), B/(R + G + B), R-B, (G-B)/(R + G + B), and (R + B) [41].
K-means clustering is applied at the earliest stage of teasing apart disease symptoms afflicting plants [42]. The technique is applied to segment images of diseased tissue, after which increasingly elaborate schemes, such as ANNs, are deployed to nail down disease identity with high fidelity across numerous plant types [43]. The algorithm removes substantial image noise and is used in subsequent processing stages for disease differentiation, serving as a potent yet straightforward tool for categorizing images [44]. A sizeable body of published work has chronicled its deployment alongside more sophisticated machine learning pipelines to detect disease in crops such as corn, brinjal, and grape [45].
Bearing in mind the obstacles inherent to discriminating RB from BS, both in the field and in many Sri Lankan laboratories operating under tight resource constraints, fashioning a digital instrument that marries ease of use with the capacity to correctly pinpoint the disease on-site with scant resources has become an imperative. The working hypothesis is that RB and BS lesions are separable by virtue of the colour indices computed from digital RGB imagery, exploiting the fine-grained differences between RB and BS that lie beneath the threshold of naked-eye perception. The present inquiry examines the feasibility of harnessing proximally captured RGB images from a smartphone camera as a replacement for time-honoured diagnostic practices rooted in human eyesight to distinguish RB from BS diseases in rice stands. The methodological approach outlined here has led to a mobile application that a grower can use effortlessly in the field to distinguish one disease from another. Pinpoint identification may also enable the farmer to detect the disease at its incipient stages, mitigate the resulting harm, or choose a more suitable cultivar when the next season rolls around.
The “Blast O Spot” mobile application helps growers spot Rice Blast (RB) and Brown Spot (BS) infections in rice using smartphone photos. The system’s architectural blueprint (Figure 2) maps the structural components and the sequential flow that underpin the development of the “Blast O Spot” mobile application, revealing how the various subsystems mesh to provide precise, timely recognition of rice ailments via digital imagery.
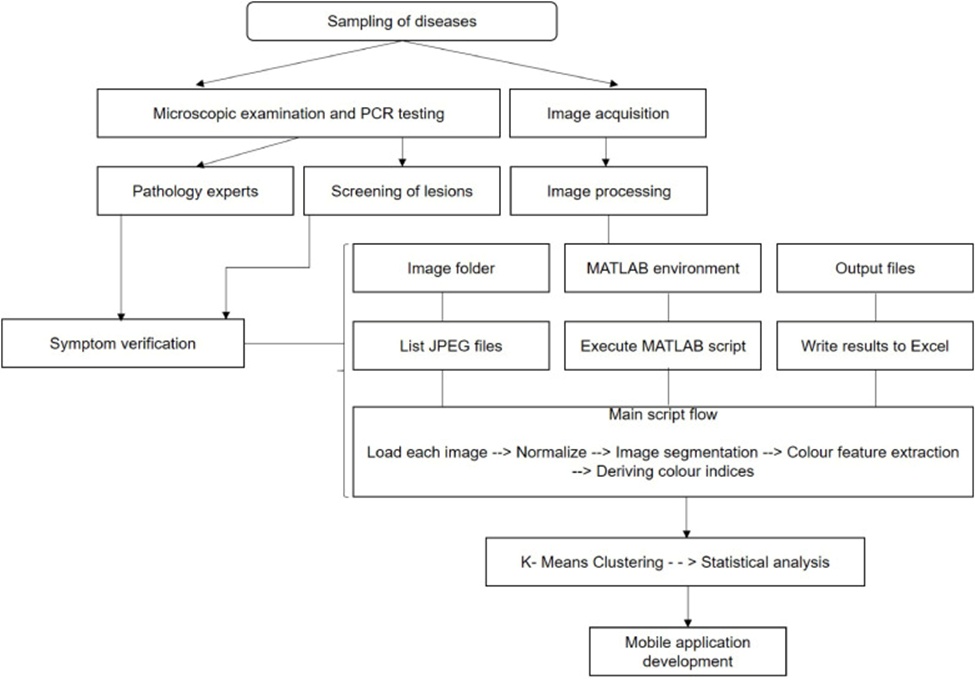
Figure 2. Overall system architecture for disease detection. This diagram illustrates the comprehensive workflow for detecting RB and BS diseases in rice leaves.
To support this study, rice foliage bearing RB and BS lesions was haphazardly collected, under the supervision of pathologists, directly from cultivators’ paddies. One such paddy is shown in Figure 3, where the necrotic plant sections stand out as brownish areas. The paddies in question are distributed throughout five districts (Jaffna- 9°39′41.38″N, 80° 1′31.97″E, Kilinochchi- 9°22′49.04″N, 80°22′37.20″E, Mullaitheevu- 9°16′1.53″N, 80°48′51.29″E, Mannar- 8°58′51.51″N, 79°54′15.91″E and Vavuniya- 8°45′37.03″N, 80°29′40.21″E) falling within the Northern Province (NP) of Sri Lanka.
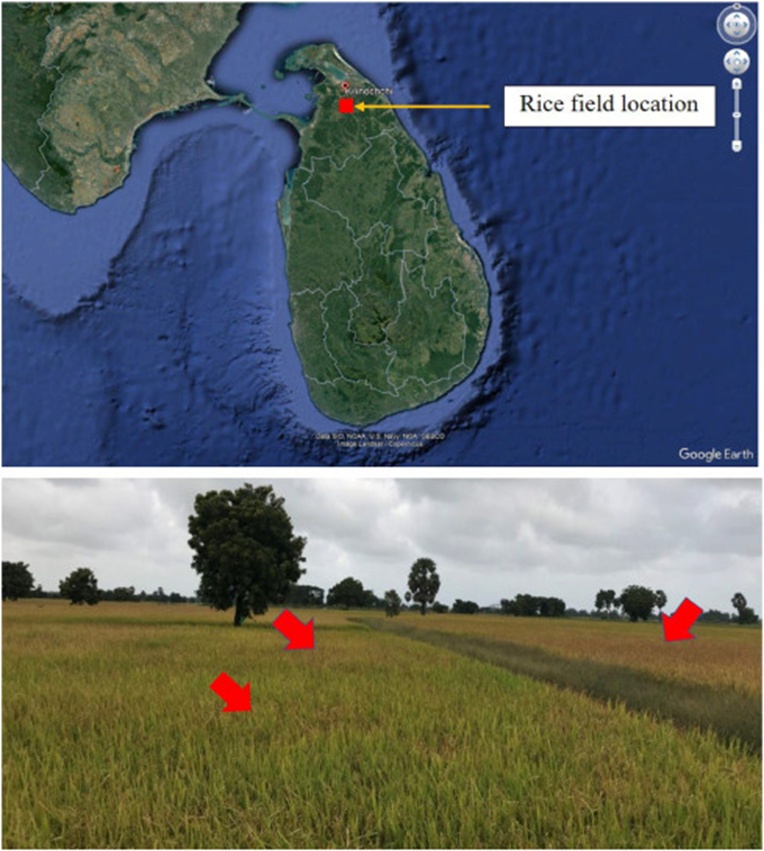
Figure 3. A rice field infected with RB and BS diseases, located in the Kilinochchi district of the Northern Province, Sri Lanka. The necrotic areas appear as brown patches.
Symptoms corresponding to a range of severity grades for both RB and BS were gathered, catalogued, and subjected to a symptom verification process that drew upon visual traits (Figure 1) and molecular testing (namely, PCR) conducted in a laboratory setting.
Leaf material collected in the field, presenting only RB and BS indicators, was placed under a microscope at ×100 magnification to confirm the morphological hallmarks of the spores and the pathogenic agents involved. Genomic DNA was then recovered from the lesions with the Mycospin™ fungal DNA extraction kit (Ceygen Biotech, Sri Lanka), incorporating modifications to the opening lysis procedure as set out by Liu et al. (2000). An exclusion-directed PCR methodology was carried through utilising RB-targeted primers (pfH2A: 5′-CGTCACACGTTCTTCAACC-3′ and pfH2B: 5′-CGTTTCACGCTTCTCCG-3′) engineered from the Pot2 region [14]. PCR amplification was undertaken with Promega’s Taq DNA Polymerase (Cat.#M7660). DNA isolates that yielded positive amplicons were designated as confirmed RB isolates, a determination reinforced by microscopic observation of the distinctive pyriform spores. Isolates that yielded no amplicons whatsoever when exposed to the Pot2 blast-specific primers, yet displayed BS symptomatology, were classified as BS-infected foliage.
The “Blast O Spot” application, available on the App Store, supports the detection of RB and BS infections. The user journey begins with downloading the app. Subsequently, individuals sign in by supplying their email credentials and password, which triggers the authentication mechanism. Upon successful verification, users are directed to the home interface (Figure 4). The application also allows users to tailor their language settings, with Tamil, Sinhala, and English available.
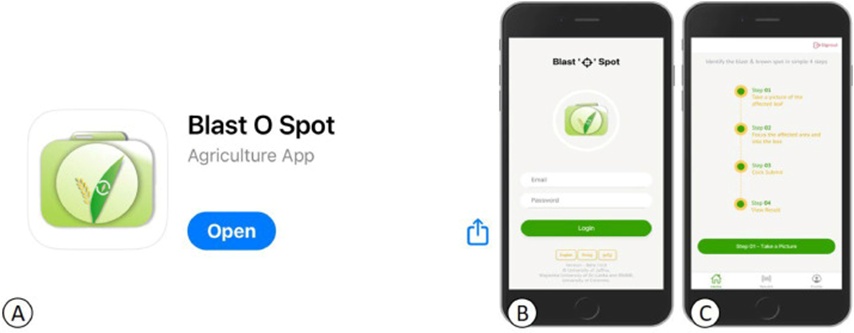
Figure 4. This figure illustrates the process for users to access the “Blast O Spot” application. Initially, users download the application from the Apple Store (A). Upon opening the app, they are greeted with the home screen (B), which prominently features login options in English, Sinhala, and Tamil. Additionally, the screen provides a succinct outline of the application process, highlighting its progression through four sequential steps (C).
The application follows an organised four-stage workflow, with each stage serving a designated purpose. Users commence by photographing infected foliage displaying RB and BS symptoms. They can then magnify the affected area to isolate a single lesion, ensuring accurate placement. Once the image is submitted, users receive instantaneous, real-time output classifying the infection as belonging to either the RB or BS category. The output display (Figure 5) presents the classification result and explains the core logic underlying the application’s decision pathway.
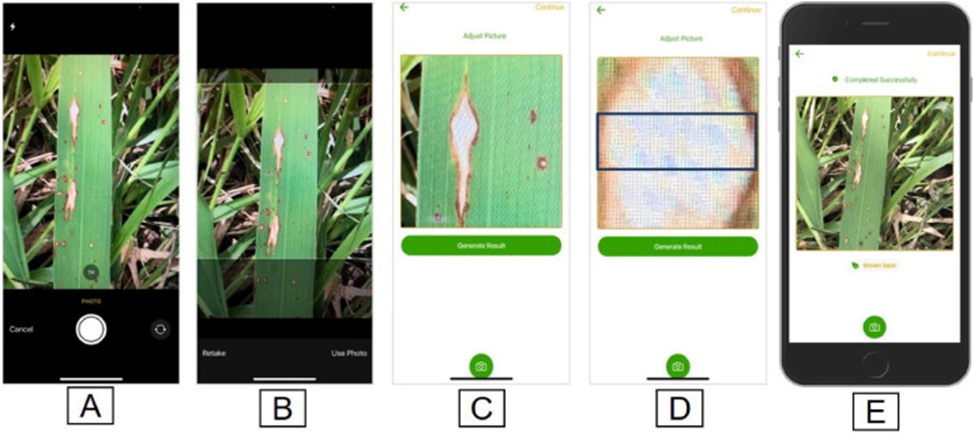
Figure 5. The series of images illustrates the sequential steps following the capture of pictures of the lesion. A) Depicts the image immediately after capture, B) Shows the lesions magnified to a certain extent, C) Displays the entire lesion zoomed in for closer examination, and D) Demonstrates the selection of a box to analyze the area of interest, with the results displayed at the bottom, E) results page.
RB and BS lesions were recorded in colour (RGB) using a smartphone camera (iPhone 7 Plus, Apple Inc., California). Using a wide-angle lens with a focal length of f = 28 mm and a telephoto lens with a focal length of f = 56 mm, the photographs were taken under open-field conditions (between 1100 and 1400 h) to generate an array image with a resolution of 1080×1920 pixels at 401 pixels per inch (ppi). The camera was positioned parallel to the flattened leaf blade, and a constant 50 cm spacing was maintained between the lens and the leaf surface. Care was taken to eliminate any shadows falling across the leaf during image capture. The leaves were arranged over a uniform white backdrop while still connected to the plant, to prevent extraneous elements (such as other foliage and soil debris) from appearing in the frame (Figure 6a). Roughly 300 colour images, each containing a solitary disease lesion, were isolated in JPEG file format and tagged according to the disease lesion type (i.e., RB or BS).
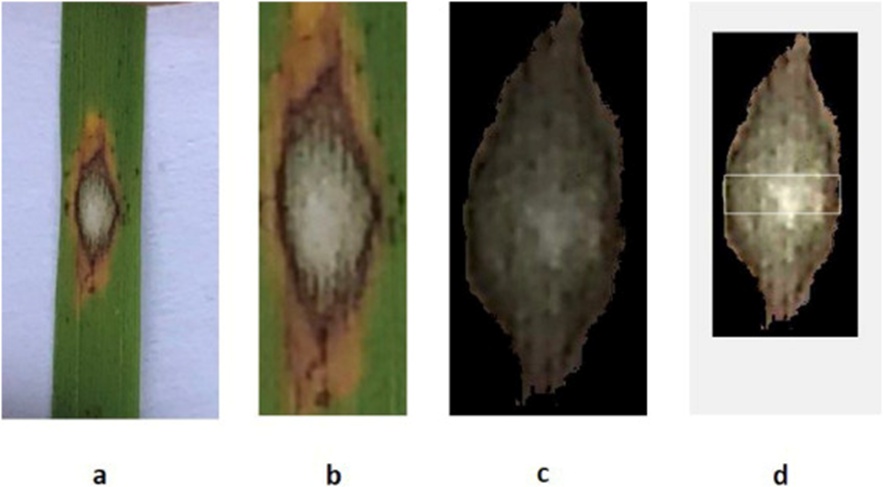
Figure 6. Pictorial representation of the steps conducted in RGB image analysis: (a) original image of the lesion with a white background, (b) image after cropping to the targeted lesion of interest, (c) masked image after thresholding for lesion pixels (surrounding black pixels are excluded by masking), and (d) rectangular shaped pointer drawn over the lesion across the centre to lateral edges by the user for feature extraction.
The processing of RGB images was undertaken using MATLAB 9.2 (The MathWorks Inc., Natick, MA, USA), drawing on purpose-written scripts and built-in routines in the Image Processing Toolbox. A single-lesion-per-image strategy was followed to streamline the image analysis pipeline. To examine the colour signatures originating from the RB or BS lesions present in each image, a series of key preparatory operations—namely image cropping, image normalization, image segmentation, and colour feature extraction—were carried out.
The photographs were cropped by hand to restrict the view to the lesion of interest (Figure 6b), while still incorporating a modest portion of the adjacent healthy tissue (green zone) [46, 47]. In addition, an initial trial run on 30 images demonstrated that effective lesion segmentation could be achieved when images were cropped before segmentation.
Every cropped lesion image was subsequently normalized to account for the fluctuating illumination conditions likely encountered during picture-taking in the open environment [48]. To accomplish this, the function rescale() was applied to each colour image, mapping pixel intensities to a range from 0 to 1.
To pull out colour attributes exclusively from the intended lesion region, a binary mask was needed (with lesion pixels assigned a value of 1 and all remaining pixels assigned 0). In this context, the region of interest constituted the lesion area enclosed within the thick, dark brown boundary ring (Figure 6b), and any pixels lying outside this zone (green or yellow pixels) were stripped away through colour thresholding [49]. Manual colour thresholding was accomplished via the CIE Lab colour space within the “Colour Thresholder App” of MATLAB, whereby threshold cut-offs were established by interactively juxtaposing the image alongside its histogram while visually gauging the appropriate level of segmentation for the desired lesion zone (Figure 7). A sensitivity assessment was run on 30 images inside the “Colour Thresholder App” to pick the optimal colour space from among the available RGB, HSV, YCbCr, and Lab options; Lab proved to deliver the strongest performance for both RB and BS image sets. The binarised, segmented output for each lesion was subsequently overlaid as a mask onto its corresponding normalized RGB image, yielding a masked RGB image (in which lesion pixels preserved their original RGB colour data while all other pixels were set to 0).
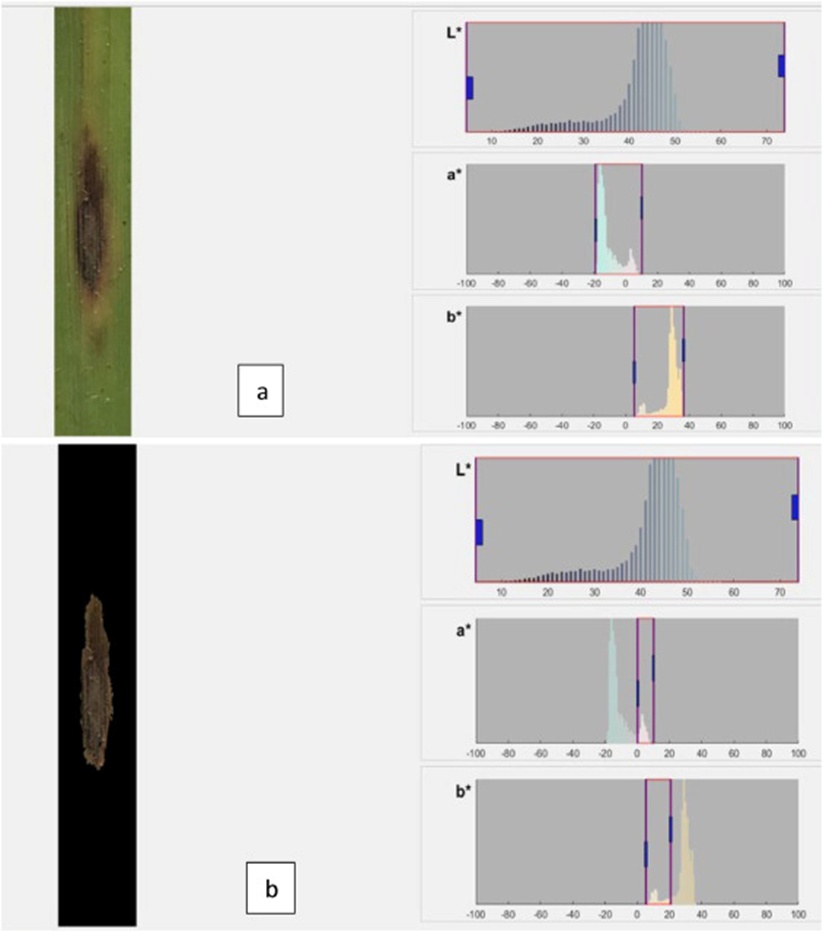
Figure 7. Performing colour thresholding to segment lesion area from green leaf tissue pixels: a) original RGB lesion image and corresponding Lab histogram limits and b) threshold RGB lesion image after excluding green leaf tissue pixels (black) and resulting Lab histogram limits, where the lesion pixels corresponded to the small peak in the a and b histograms.
At this stage, the particulars of the colour profiles spanning from the pale centre outwards to the lateral margins of the lesions were gathered, in alignment with the characteristic RB and BS lesion patterns detailed in Figure 1. A tailor-made script, “extractColour.mat,” was employed to generate a rectangular pointer (with a fixed height of roughly 40 rows) that was then manually positioned across the masked RGB image, bridging the opposing brown-coloured halo rims (Figure 6d) and thus demarcating the feature extraction zone.
Set imageFolder to the directory path containing images
List all JPEG files in the specified directory
results = {‘Pxl’, ‘Mean_R’, ‘Mean_G’, ‘Mean_B’, ‘Mean_H’, ‘Mean_S’, ‘Mean_V’, ‘Mean_L’, ‘Mean_A’, ‘Mean_B’}
Display “started”
For each file in srcFiles
Get the path and name of the current image
Load the image
% (1) Load image
im = imread(imPath);
% (2) Normalize the image for light variations
imNorm = rescale(im);
% (3) Show where to extract information in the spot
% Prompt user to draw a line across touching the widest edges horizontally
% in the spot. The line connects the widest edges across the bright center area
Display imNorm and prompt the user to draw a line
Get the position of the drawn line
% (4) Getting additional position details
leftX, leftY = position(1, 1), position(1, 2)
rightX, rightY = position(2, 1), position(2, 2)
centreX = min(leftX, rightX) + round(sqrt((rightX - leftX)^2) / 2)
centreY = min(leftY, rightY) + round(sqrt((rightY - leftY)^2) / 2)
numRowSample = 20
pinLeftX = leftX
pinLeftY = centreY - numRowSample
pinRightX = rightX
pinRightY = centreY + numRowSample
w = pinRightX - pinLeftX
h = pinRightY - pinLeftY
% Analysis:
% Convert image to HSV and LAB color spaces
% Extract mean values from the specified region
% Create the image with sampled location and save
Create a figure and display the image
Draw a rectangle around the sampled region
Save the image
% Prepare data for output
Store extracted pixel values and means in the data variable
% Write data to Excel file
Write data to an Excel file with the image name
Display “end”
The script then retrieved the colour profile figures for each pixel within the extraction zone, referencing the R, G, and B colour spaces, the H, S, and V colour spaces, and the L, a, and b colour spaces, thereby generating averaged colour readings for each profile.
The colour indices catalogued in Table 1 were calculated from the corresponding extracted mean colour profile values belonging to each RB and BS lesion.
Table 1. Colour indices used for the analysis.
No | Name | Equation/Definition | References |
1. | R | Mean of red | |
2. | G | Mean of green | |
3. | B | Mean of blue | |
4. | H | Mean of Hue | |
5. | S | Mean of Saturation | |
6. | V | Mean of brightness | |
7. | L | Mean of lightness (L) | |
8. | a* | Mean of a* | |
9. | b* | Mean of b* | |
10. | Nor_r | Normalised red =R/(R + G + B) | |
11. | Nor_g | Normalised green =G/(R + G + B) | |
12. | Nor_b | Normalised blue =B/(R + G + B) | |
13. | Intensity (INT) | INT=(R + G + B)/3 | |
14. | VIgreen – Vegetation index | VIGreen = (G-R)/(G + R) | |
15. | Difference between green and blue | G-B | |
16. | Difference between green and red | G-R | |
17. | Sum of Green and Red | G + R | |
18. | Sum of Red and Blue | R + B | |
19. | Difference between normalized green and blue | g-b | |
20. | Excess red vegetation index | ExR = 1.4r-g | |
21. | Excess blue vegetation index | ExB = 1.4b-g | |
22. | Excess green vegetation index | ExG = 2 g-r-b | |
23. | Excess green minus excess red | ExGR = ExG-ExR | |
24. | Kawashima Index | IKAW = (R-B)/(R + B) | |
25. | Dark green colour index | DGCI = [((Hue)−60)/60+(1-(Saturation))+(1-(Brightness))]/3 | |
26. | Colour feature index | G/B | |
27. | Colour feature index | G/R | |
28. | Red-green ratio index | RGRI = R/G | |
29. | Colour feature index | (G-B)/(R + G + B) | |
30. | Colour feature index | (G + B)/R | |
31. | Colour feature index | (R + G + B)/R | |
32. | Colour feature index | b*/a* |
The capacity to separate the two lesion categories (RB and BS) based on the computed colour indices was quantitatively assessed using k-means clustering implemented in Python 3.9 (Python Software Foundation, Virginia). The colour indices that proved most effective at cleanly partitioning the two lesion classes were selected based on Euclidean distance, and their respective classification accuracies were documented.
To verify the outcomes, the rectangular pointer used for feature extraction was redrawn over the images, and the entire downstream sequence (image processing, feature extraction, colour index derivation, and analysis) was repeated. This procedure was performed on two separate occasions, and the resulting classification accuracies were measured against the initially calibrated results. The dataset utilised for the analysis is detailed as follows (Table 2).
Table 2. The dataset utilised for the analysis.
Empty cell | Blast | Brown spot |
Validation (Test) | 70 | 70 |
Calibration 1 | 109 | 107 |
Calibration 2 | 100 | 100 |
The accuracy, precision, recall, and F1-score of the tested model were benchmarked against several state-of-the-art models as presented by Ritharson et al. [57].
The approach to building the mobile application drew on findings from laboratory examinations of BS and RB lesions, coupled with an image-sensing supervised classification strategy. A Singapore- and Sri Lanka-based software firm, Cerexio Pvt Ltd, was commissioned to handle the creation work. The IonicTM framework served as the foundation for the application, specifically because it supports hybrid app development. The architecture was designed to leverage intelligent algorithms and machine learning techniques for analyzing photographs captured by end users. Several vital operations comprised the backend workflow. To begin with, incoming requests were fielded by the Request Processor, which reformatted the payload into a consistent structure suitable for downstream tasks. Subsequently, PNG and RGB decoding routines were run by the Image Decoder to pull the image out of the payload, turning the byte stream into a usable representation via the following:
file_bytes = numpy.asarray(bytearray(img_stream.read()), dtype=numpy.uint8)
img_data_ndarray = cv2.imdecode(file_bytes, cv2.IMREAD_UNCHANGED)
The next phase, Image Validation and Enhancement, focused on refining the supplied image to conform to a standard, employing geometric transformations, colour-space adjustments, analytical operations, filtering, and morphological processing. A vital subroutine here was shadow correction, aimed at removing shadows cast by varying lighting conditions; it used a colour-driven shadow-identification method that weighed chromaticity and luminance values against those of the backdrop. The corresponding pseudocode encompassed dilation, median blurring, and normalization steps:
rgb_planes = cv2.split(img)
result_planes = []
result_norm_planes = []
for plane in rgb_planes:
dilated_img = cv2.dilate(plane, np.ones((7, 7), np.uint8))
bg_img = cv2.medianBlur(dilated_img, 21)
diff_img = 255 - cv2.absdiff(plane, bg_img)
norm_img = cv2.normalize(diff_img, None, alpha=0, beta=255, norm_type=cv2.NORM_MINMAX, dtype=cv2.CV_8UC1)
result_planes.append(diff_img)
result_norm_planes.append(norm_img)
result = cv2.merge(result_planes)
result_norm = cv2.merge(result_norm_planes)
Concluding the pipeline, Feature Extraction singled out distinct image attributes for the trained model, running algorithms to generate a 2D map array. Edge-related characteristics, in particular, were extracted using the Canny edge detection technique, which flags regions of sharp pixel-intensity transitions. The edge detection pseudocode appeared as:
edges = feature.canny(decoded_image)
The trained model then examined the input map array to select a pre-learned label based on the measured confidence value. The output was returned to the Request Processor, which forwarded it to the mobile interface. This end-to-end backend processing chain was structured to rigorously validate, improve, and interpret images, yielding dependable plant disease detection.
Identification of the collected specimens as either blast or brown spot was achieved through distinctive microscopic colony morphology traits and successful amplification of the pot2 region. Before field image capture, expert verification of lesion identities was also carried out.
Out of the full set of captured RB and BS lesion photographs, a subset of 200 images (100 representing each symptom class) was singled out, all possessing sharply defined lesions unaffected by sunlight-induced artefacts.
To form a preliminary picture of how colour distributes itself over the area of interest (AOI; the rectangular pointer region spanning the horizontal widest edges) within each RB and BS lesion (Figure 7), the spatial pixel-level distribution of mean values across R, G, B, H, S, V, and L, a, b colour profiles was charted after normalization by sweeping across the AOI from leftmost to rightmost pixels, i.e., traversing the lesion horizontally (Figure 8).
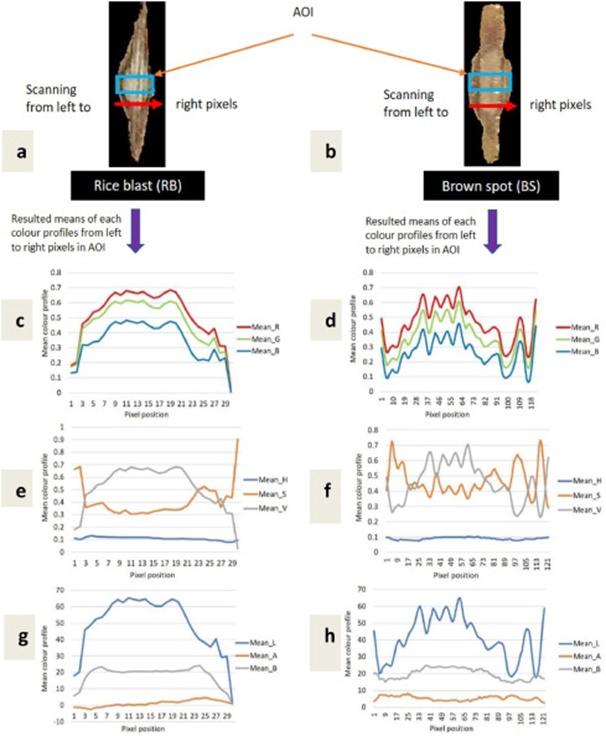
Figure 8. Graphical interpretation of the spatial pixel colour distribution pattern in RB and BS lesions from normalized images; a) normalized RGB image of rice blast lesion, b) normalized RGB image of brown spot lesion, c-h) plots indicating the spatial pixel distribution of mean colour profiles, c & d) mean R, G, B, e and f) mean H, S, V, and g and h) mean L, a, b.
As Figure 8 illustrates, every colour profile measured along the horizontal span (AOI) of RB and BS lesions yielded a distinct pixel colour distribution signature. In both lesion types, colour distribution spiked around the central pixel zone and dipped to lower mean values near the margin pixels; however, RB produced smoother peaks relative to the more jagged, irregular peak shape characteristic of BS (Figure 8). A comparison of colour spaces revealed that under RGB, mean values of R, G, and B all fluctuated as one moved across the lesion span (Figure 8). In contrast, under HSV the mean of V stayed steady, and under Lab the means of a and b similarly showed little variation (Fisg. 8e-h). These patterns suggest that all three channels (R, G, and B) in the RGB space carry more discriminative colour information associated with RB and BS lesions than do the HSV and Lab alternatives.
As a means of telling RB and BS lesions apart, the mean values pulled from the AOI for R, G, B, H, S, V, and L, a, b were mathematically transformed into colour indices, yielding a total of 36 derived indices per individual lesion image, as catalogued in Table 1.
Colour indices are calculable quantities derived from RGB digital colour images, most often used to capture visible shifts in foliage or vegetation. According to Li et al. [58], RGB-derived indices, such as intensity (INT) and VI Green, have been widely used to estimate leaf nitrogen content. Furthermore, colour indices derived from the HSV and Lab colour spaces have shown strong correlations with chlorophyll concentration in rice leaves [51].
To probe the optimal number of groupings that could emerge from an unsupervised technique, a range of k-means cluster analyses (k = 0-10) was performed on the complete set of derived colour indices (Figure 8) across all images. An elbow graph, illustrated in Figure 9, plots the squared Euclidean distance for each clustering iteration. The plot’s inflection pointed to two clusters as the most natural partitioning, and these groupings aligned with the two distinct lesion types (i.e., RB and BS). This outcome offered evidence that the suite of 36 derived colour indices powerfully encodes the variance between the two primary lesion classes. All silhouette coefficient values for the clusters were positive and spanned from 0.9 to 1, providing strong support for the cluster validity.
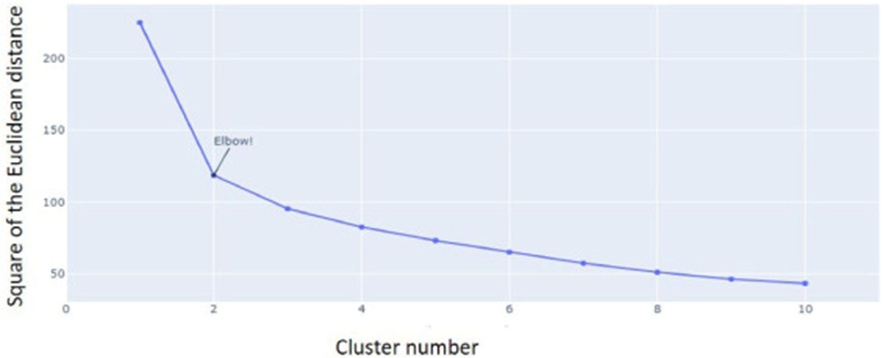
Figure 9. The elbow graph showing the optimum number of clusters possible to produce from the pool of derived colour indices, supervised.
A separate k-means cluster analysis (k = 2) was applied to colour indices (36 indices as variables) derived from images assigned ground-truth labels (RB and BS). The goal was to measure the classification power in assigning each observation to its correct, pre-identified RB or BS cluster. This procedure reported a robust classification accuracy of 84.6% in distinguishing RB from BS using the chosen 36 colour indices.
To supplement this, the Euclidean distances separating the clustered groups, broken down by each colour index, were rendered on a spider plot (Figure 10). Across the plot, every colour index exhibited some degree of separation between the two clusters; for example, the span between the red and blue trajectories for the index ‘Nor_r’ constituted a comparatively large gap (> 0.3 Euclidean), whereas the equivalent span for b/a was markedly small (< 0.1). A detailed breakdown of the exact Euclidean distances generated by each colour index was organized into Table 2. In line with Table 2, the greatest inter-cluster separation (0.38 Euclidean) was delivered by the G/R index, and the smallest divergence (0.00) was recorded for b/a. Concurrently, the evidence suggests that achieving the 84.6% discrimination level between RB and BS lesions likely relies on input from a subset of indices, rather than the entire panel of 36.
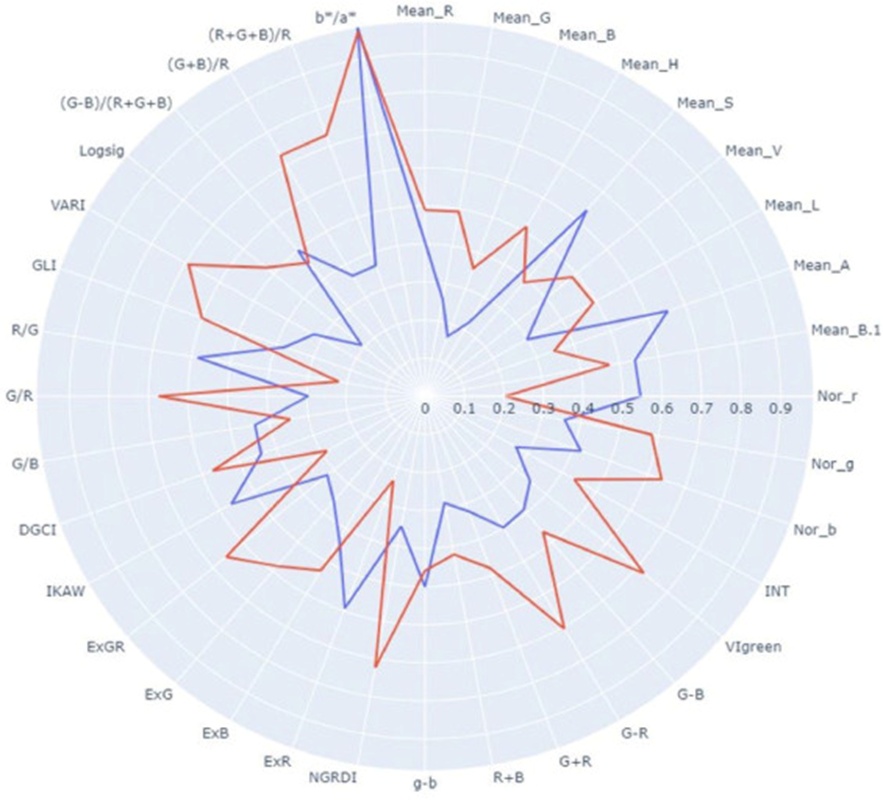
Figure 10. Graphical interpretation of the cluster distances resulting from k-means cluster (k = 2) analysis over derived colour indices; cluster corresponding with rice blast lesion (red line) and brown spot lesion (blue line), the x-axis shows the Euclidean distance.
Table 2. The resulting Euclidean distances for blast (BL) and brown spot (BS) across 36 colour indices.
No | Colour indices | Distance between clustered groups | Euclidean distance of the brown spot | Euclidean distance of rice blast |
1 | G/R | 0.36 | 0.30 | 0.66 |
2 | VIgreen | 0.36 | 0.35 | 0.71 |
3 | NGRDI | 0.36 | 0.35 | 0.71 |
4 | (R + G + B)/R | 0.36 | 0.37 | 0.73 |
5 | (G + B)/R | 0.36 | 0.37 | 0.73 |
6 | VARI | 0.35 | 0.32 | 0.68 |
7 | R/G | 0.35 | 0.57 | 0.22 |
8 | ExR | 0.34 | 0.58 | 0.23 |
9 | Nor_r | 0.33 | 0.53 | 0.19 |
10 | ExGR | 0.32 | 0.32 | 0.65 |
11 | G-R | 0.30 | 0.39 | 0.70 |
12 | Mean_A | 0.29 | 0.65 | 0.35 |
13 | Logsig | 0.28 | 0.25 | 0.54 |
14 | IKAW | 0.27 | 0.55 | 0.28 |
15 | Nor_b | 0.21 | 0.42 | 0.64 |
16 | GLI | 0.21 | 0.38 | 0.59 |
17 | Nor_g | 0.21 | 0.36 | 0.58 |
18 | ExG | 0.21 | 0.36 | 0.58 |
19 | Mean_S | 0.20 | 0.47 | 0.27 |
20 | Mean_G | 0.18 | 0.44 | 0.62 |
21 | Mean_B | 0.16 | 0.33 | 0.49 |
22 | Mean_H | 0.15 | 0.12 | 0.27 |
23 | Mean_L | 0.14 | 0.51 | 0.66 |
24 | DGCI | 0.13 | 0.42 | 0.56 |
25 | INT | 0.13 | 0.46 | 0.59 |
26 | G + R | 0.11 | 0.52 | 0.64 |
27 | R + B | 0.10 | 0.46 | 0.57 |
28 | ExB | 0.09 | 0.42 | 0.52 |
29 | G/B | 0.09 | 0.44 | 0.35 |
30 | Mean_B.1 | 0.07 | 0.58 | 0.50 |
31 | Mean_V | 0.06 | 0.58 | 0.64 |
32 | Mean_R | 0.05 | 0.58 | 0.64 |
33 | G-B | 0.05 | 0.41 | 0.47 |
34 | g-b | 0.04 | 0.51 | 0.46 |
35 | (G-B)/(R + G + B) | 0.04 | 0.51 | 0.46 |
36 | b*/a* | 0.00 | 0.12 | 0.13 |
A deeper exploration involved crafting scatter plots to portray how well individual colour indices performed in classification, based on the gap from each group’s centroid to the data points belonging to it (Figure 10). With reference to Table 2 and Figure 11, a stark contrast was apparent: colour indices tied to a wider inter-cluster distance (> 0.27 Euclidean) showed a crisp demarcation (e.g., G/R, VIgreen, NGRDI, etc.) between groups, while those with narrower distances (< 0.27 Euclidean) resulted in a blend of the two populations (e.g., b/a, g-b, (G-B)/(R + G + B), etc.). This phenomenon can be attributed to these indices’ inability to detect chromatic shifts within the lesions’ AOIs.
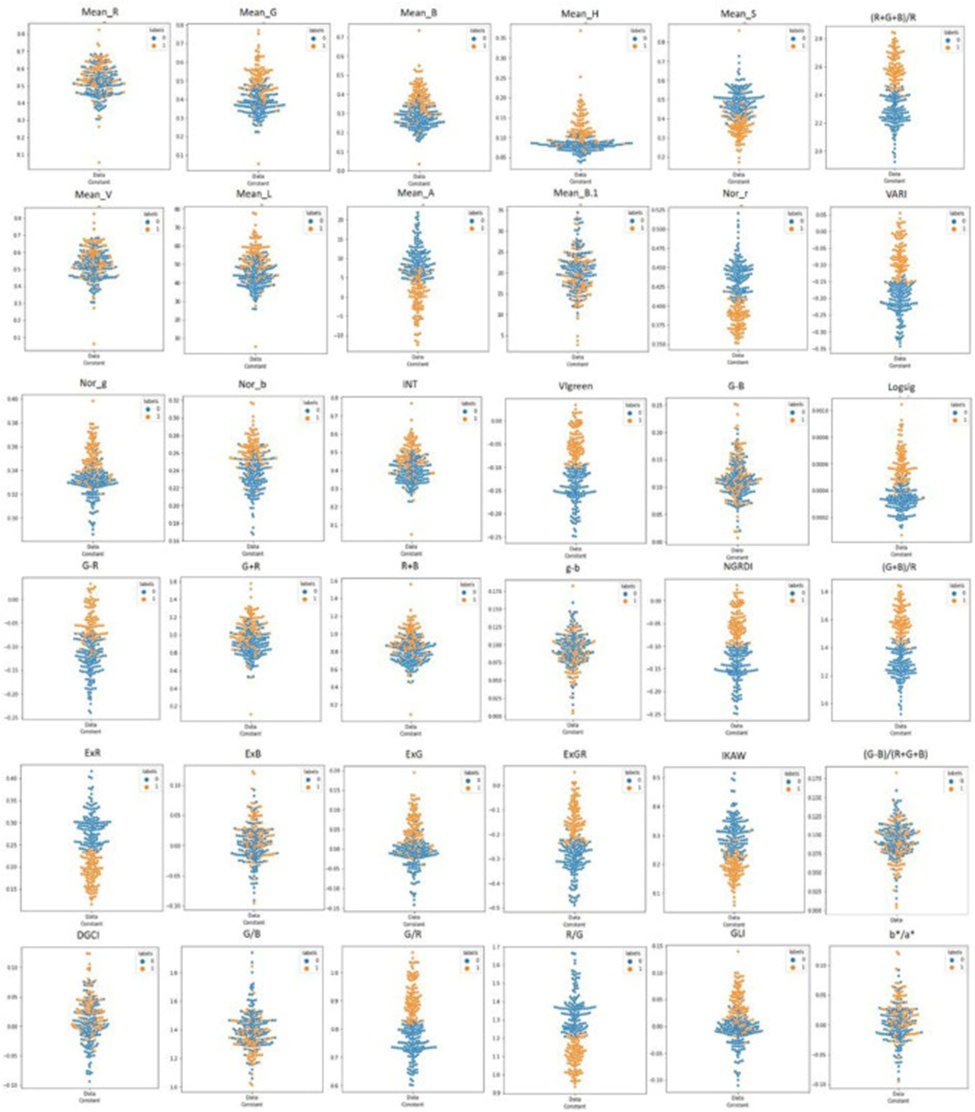
Figure 11. Scatter plots showing the distribution of data points clustered into respective groups by each colour index: orange dots (RB) and blue dots (BS).
Seeking to pinpoint the minimal set of colour indices, drawn from the original 36, that could sustain an accuracy level near the original mark (84.6%), the clustering workflow was iterated repeatedly. During each cycle, colour indices were removed stepwise, prioritising those that produced the weakest inter-cluster separation. The key points in this optimization sequence where accuracy shifted measurably are summarized in Table 3. A noteworthy discovery was that a combination of merely four colour indices was sufficient to replicate the 84.6% accuracy previously achieved with all 36 indices for separating RB and BS lesions (Table 3: Calibration analysis round). Shrinking the set further to three indices reduced accuracy to 82.7%, indicating that the four-index combination is the optimal parsimonious subset for the discrimination task. These four optimal indices were identified as G/R, VIgreen, NGRDI, and R + G + B/R (Table 4), which also ranked highest in Table 2 for generating the largest distances (> 0.36 Euclidean) between clusters.
Table 3. The changes in accuracy occurred during colour index optimization at each round.
Processing stage and accuracy variation | Iteration 2 | Iteration 1 | Calibration Phase | |||
Selected Colour Indices | Accuracy (%) | Selected Colour Indices | Accuracy (%) | Selected Colour Indices | Accuracy (%) | |
Complete set of indices | 36 | 84.0 | 36 | 84.4 | 36 | 84.6 |
Optimal subset of indices | 7 | 84.0 | 5 | 84.4 | 4 | 84.6 |
Reduced subset of indices | 6 | 82.1 | 4 | 82.5 | 3 | 82.7 |
Table 4. Summary of the optimum colour indices used to discriminate RB and BS lesions for each analysis round.
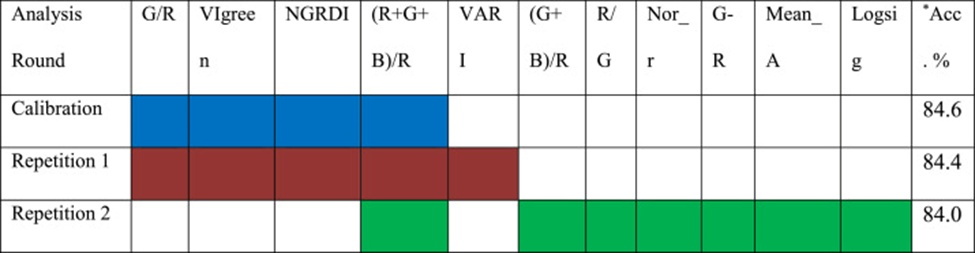
Abbreviation: Acc = Accuracy.
In a bid to corroborate the calibration-phase findings, the entire experimental protocol was repeated twice more, each time by drawing the AOI rectangular pointer anew for each image. The freshly extracted colour index sets were then processed through the same pipeline, and the resulting accuracies are displayed in Table 3. Across both replicate efforts (‘repetition 1’ and ‘repetition 2’), the discrimination accuracies for RB and BS lesions obtained using the full index set (36) proved comparable to the calibration benchmark (∼84%). Even post-optimization, the performance figures remained in line with calibration outcomes (∼84%) (Table 3). While the accuracy percentages remained steady, the indices underlying the separation varied somewhat across replicates (Tables 3 and 4). In ‘repetition 1’, the index VARI was added to those flagged during calibration, and in ‘repetition 2’, aside from R + G + B/R, the contributing indices diverged from the calibration selection (Table 4). This fluctuation is likely rooted in the slightly different colour information harvested by each new AOI placement on the images. Crucially, however, all these indices appeared within the top 10 listings of the calibration run shown in Table 2, confirming their association with the highest Euclidean distances (> 0.28) between clusters.
The performance metrics of the model assessed in this work—accuracy, precision, recall, and F1-score—are presented in Table 5, along with a comparative evaluation against several leading models from the literature.
Table 5. Comparison of the model used in the present study with already established state-of-the-art models (from [57]).
Model name | Accuracy | F1_score | Recall | Precision |
Xception | 97.7 % | 0.977 | 0.977 | 0.977 |
DenseNet121 | 93.8 % | 0.938 | 0.938 | 0.938 |
InceptionResnetV2 | 93.3 % | 0.933 | 0.933 | 0.933 |
Resnet 50 | 81.1 % | 0.811 | 0.811 | 0.811 |
InceptionV3 | 95.5 % | 0.955 | 0.955 | 0.955 |
VGG 16 | 98.8 % | 0.988 | 0.988 | 0.988 |
The present model used in “Blast O Spot” | 84.0 % | 0.965 | 0.991 | 0.941 |
Smartphone-captured digital colour imagery offers a viable route to generating colour indices attuned to the characteristics of RB and BS lesions. The study’s evidence confirmed that applying colour indices to evaluate the horizontal widest edges of lesions successfully sorts them into two distinct clusters. Although the approach requires users to manually outline a rectangular pointer region along the lesion’s horizontal widest edges (the central zone), the accuracy figures attained (84.6%) remained steady across multiple repetitions, even when the rectangular pointers were traced afresh on the same lesion time after time. Consequently, the data indicate that colour indices possess the robustness required to capture chromatic behaviour across the lesion’s central portion at different stages of severity, independent of who performs the pointer drawing. For field practitioners tasked with distinguishing diseases to devise targeted control measures, this constitutes a meaningful practical advantage.
Within the boundaries of the method put forward here, a suite of 36 colour indices spanning several colour profiles (R, G, B, H, S, V, and L, a, b) generated the peak accuracy (84.6%). An equivalent level of accuracy was maintained when the index pool was reduced to fewer than 10, a subset that, interestingly, mapped onto the R, G, and B colour profiles. Such findings resonate with prior investigations, including the conclusions of Mohan and Gupta [38], who argued that R, G, and B colour indices carry predictive value for chlorophyll content in leaves. Chlorophyll content, in turn, serves as a widely accepted biomarker for diagnosing a spectrum of disease symptoms, as diseases inherently alter the reflectance spectrum emanating from affected lesion areas [52, 59, 60]. It is common practice for these colour models to undergo optimization within the plant disease identification domain [61, 62]; as an illustration, Naik et al. [63] leveraged the RGB colour channel alongside k-means clustering to sort three cabbage ailments—black rot, frog eye disease, and fungal disease—from healthy specimens. Kulkarni and Patil [64] focused on the Lab colour channel to pinpoint three principal diseases afflicting pomegranate fruit: bacterial blight, anthracnose, and wilt complex, whereas the HSV colour channel proved its worth in separating wheat crop diseases, with segmentation hinging on the k-means algorithm [62].
The present findings also sit comfortably alongside parallel research efforts on rice disease recognition using diverse classification frameworks [46, 60, 65, 66]. Afflictions such as rice bacterial blight, RB, BS, and rice sheath rot have previously been categorized by means of a Minimum Distance Classifier (MDC) and a k-Nearest Neighbor classifier (kNN), delivering accuracy rates of 87.02 and 89.23 percent, respectively [46]. Shrivastava and Pradhan [67] brought a support vector machine (SVM) classifier to bear on the separation of bacterial leaf blight, RB, and sheath blight, managing to achieve 94.65% accuracy. Guchait et al. [48] relied on features encompassing texture, shape, colour, and intensity distribution to detect RB and BS diseases, achieving 81.81% accuracy with the IBK classifier, a k-nearest neighbors algorithm tailored for data clustering [68, 69]. The work of Shah et al. [70] found that k-means clustering is better suited to leaf image classification. Anthonys and Wickramarachchi [71] discriminated between RB, rice sheath blight, and BS using a membership function-based classification approach, achieving an accuracy of 70%. Yao et al. [72] deployed SVM for classifying RB, rice sheath blight, and bacterial leaf blight, with a reported accuracy of 97.2%. A limited set of state-of-the-art solutions exists for rice disease discrimination; for instance, a Region-based Convolutional Neural Network (R-CNN) achieved 99.25% accuracy in identifying healthy leaves. A Residual Network (ResNet19) was applied to classify a set of rice diseases (RB, BS, and Hispa), achieving 99.58% accuracy. Some groups have combined techniques such as FCM-KM and Faster R-CNN, achieving accuracies of 69%- 99% in rice disease classification [57]. Gauged against these accuracy benchmarks produced by unsupervised methods, the mean accuracy of 84% from this supervised-method study is a promising result. On top of that, the supplementary performance metrics—precision, F1 score, and recall—further underscore the model’s capability in telling RB apart from BS.
Obtaining the aforementioned accuracy level hinges on incorporating a rectangular box measuring 40 rows in height at the lesion’s midpoint into the analysis. In scenarios where lesions consist of multiple spots, each discrete spot must be analyzed separately.
In image processing, segmentation represents an essential operation [13]. The concept refers to dividing an image into meaningful regions or segments and isolating the target of interest for further scrutiny [12]. Stated another way, it is about extracting the leaf spot from the surrounding background. Within the current study, segmentation was carried out across three stages. Stage one involved image smoothing, aimed at eliminating noise to the greatest extent possible so that genuine edges could emerge clearly. Stage two focused on detecting the edge points of the leaf spot, thereby establishing the reference from which the rectangular pointer would be drawn. The importance of this stage lies in its role in defining the discriminative feature common to both diseases. The rectangular pointer was traced by hand across the broader expanse of the lesion, near its middle, so that a user could readily perceive the start and finish positions. Stage three determined which pixel rows to select for computing the mean value of each colour component within the deployed colour model. To this end, 40-pixel rows were chosen automatically, and averaging was performed for the calculations. Such an approach likely reduces the variability introduced by different users when demarcating the rectangular pointer within the central region.
The image analysis pipeline could benefit from further refinement by automating the placement of the rectangular pointer area along the lesion’s widest horizontal edges. One possible pathway involves the combined adoption of the ‘Canny edge detection’ and ‘Otsu’s’ methods, as suggested by Salgadoe et al. [36]. Beyond this, supplementary layers of feature dimensions—such as texture information [48] and wavelet-derived features [39]—could be merged with the colour indices. Additionally, the method proposed here could be extended to simultaneously analyze multiple lesions within a single image, rather than being limited to a single lesion per image. This move would require more sophisticated thresholding and segmentation routines and, in turn, facilitate rapid throughput when monitoring large batches of images simultaneously.
The mobile application that was built, named “Blast O Spot,” has proven its effectiveness during trial operation with test images gathered over the course of the research. It is currently available as a Beta release on the App Store, constituting a new tool that will likely require additional fine-tuning informed by user feedback and outcomes. Of particular note, “Blast O Spot” achieved an exceptional 100% accuracy rate in lesion identification. Its clean, intuitive interface, coupled with support for multiple languages, renders it especially valuable for a global farming audience. The application goes further by providing summary outputs, including GPS-derived access location via smartphone integration and the detected presence of RB/BS. This steady stream of data contributes to the assembly of a comprehensive database for future consultation and gives developers a means to validate the application’s behaviour. When set side by side with RiceDoctor—an application created by IRRI for diagnosing a broad array of rice problems, from diseases to nutrient shortfalls—the latter presents a comparatively more convoluted and less agile user experience. “Blast O Spot,” by contrast, distinguishes itself through superior ease of operation and a tight focus on RB and BS lesions, which translates into greater accuracy in results. It is important to highlight that “Blast O Spot” represents a trailblazing move in application development, specifically designed to distinguish RB and BS lesions.
Among the principal constraints of the method are the influence of the capturing device itself and external variables such as light intensity, shadows, and background hue, all of which can compromise image quality. Diagnostic performance may also suffer when symptoms lack clarity in the early phases of disease development. Another possible hurdle arises if users need formal training to capture images correctly. Even so, the tool’s real-time functionality greatly streamlines the decision-making process. With only modest practice, it can be wielded effectively—a pair of strengths that rank among the study’s standout contributions.
Our study addresses the problem of disease identification by developing a non-destructive, cost-effective method based on digital RGB images captured with a smartphone camera. The strategy capitalizes on the widespread availability of smartphones and the ease of snapping pictures, positioning it as a practical tool for farmers and agricultural professionals operating in field conditions. Based on our empirical results, we engineered a mobile application called “Blast O Spot,” designed to support the accurate recognition and differentiation of RB and BS diseases. The tool opens the door to choosing resistant cultivars and implementing other disease-specific management interventions. Its design prioritizes ease of use, bolstering disease control by empowering farmers to capture symptom images and shift the spot within a movable square, thereby averting misidentification when several spots are present on a leaf. In doing so, it reduces dependence on specialist visual assessment and the need for expensive laboratory procedures. By enabling timely, precise disease detection, the application supports productive, sustainable farming systems.
The authors gratefully acknowledge the support provided by the Rice Research Station, Paranthan, Sri Lanka, and the Pathology Division, Rice Research and Development Center, Bombuwala, Sri Lanka, in the collection of diseased samples. Also, the authors would like to express their sincere gratitude to Mr. S. Muraleetharan, Environmental Officer at the Central Environmental Authority, Sri Lanka, for guiding them on statistical analysis methods in Python. Finally, the authors would like to thank the funding agency, the University Grants Commission, Sri Lanka.
The authors declare the following financial interests/personal relationships which may be considered as potential competing interests:
Suvanthini Terensan reports that financial support was provided by the University Grants Commission, Sri Lanka. If there are other authors, they declare that they have no known competing financial interests or personal relationships that could have appeared to influence the work reported in this paper.
None
None
Open Access The author(s) retain copyright. This article is licensed under the Creative Commons Attribution-NonCommercial-ShareAlike 4.0 International License. It may be shared and adapted for non-commercial purposes with appropriate attribution, an indication of changes, and distribution of adaptations under the same license. Third-party material may be subject to separate terms identified in its credit line. View the license at https://creativecommons.org/licenses/by-nc-sa/4.0/.
 Agro Intelligence Research Press