Quantifying fruit mass and volume manually is a laborious, repetitive task that can hinder production scheduling. This investigation developed a computer vision framework to predict the volume and mass of baobab fruits from single-view photographs captured with affordable, widely accessible cameras, including smartphones. The baobab fruits were sourced from two experimental sites situated within the savanna ecological zone. Following image capture, the fruits were detected and segmented with an accuracy exceeding 97%. The segmented outputs were converted to binary format, from which two-dimensional (2D) attributes—namely the segmented area, centroid, bounding box, equivalent diameter, and major diameter—were derived. Volume estimations were generated from the 2D attributes by employing random forest, linear, polynomial, and radial support vector machine regressors. Every model achieved strong goodness-of-fit, yet the random forest regressor performed best, with an R2 of 99.8%. The linkage between mass and volume conformed to a quadratic expression (mass = 38.23 + 0.25 × volume + 4.49e−05 × volume2) and achieved an R2 of 92%. Correlations were substantiated through graphical plots and statistical evaluations, with credible intervals for the point estimates derived from the posterior distributions of their respective samples. This finding spotlights the potential to deploy artificial intelligence techniques in a less restrictive environment to support ecological studies and agricultural oversight. Commercial firms that manufacture baobab powder and seed oil ought to adopt these models to streamline production planning. Acquiring deeper insight into how climatic gradients shape the morphological properties of baobab fruits would help refine the model.
Naturally occurring multipurpose tree species scattered across the savanna ecological zone deliver a multitude of ecosystem services [1]. The baobab represents one such indigenous multipurpose species inhabiting the West African savannas.
Over the preceding decade, the export value of baobab fruits has climbed [2-4], creating broader prospects within African marketplaces. Notwithstanding their economic potential, not every baobab variant commands high demand. Odoom [5] observed that fruit dimensions span from large to small and signal sweetness levels—Gurashi and Kordofani [6] tied fruit configuration to its commercial worth. Hence, traits such as dimensions and form can shift consumer preferences and market prices, both of which influence demand. This reality demands the identification of suitable varieties aimed at both commercialization and propagation. Consequently, scholarly attention to baobab fruit morphology has grown to illuminate how it affects yield, grade, and domestication prospects [7-9]. Morphological diversity in fruit shape, alongside pulp weight percentage, serves as a plausible benchmark for singling out high-yield fruits [1], and Gurashi and Kordofani [6] verified this. Despite the value of these conclusions, obtaining length, width, and component weights through manual tape and an electronic scale proved physically demanding, arduous, and slow. This challenge endures across most industry-oriented studies [6, 10, 11].
Pinpointing suitable baobab fruits for domestication and commercial output by scrutinizing their morphological traits calls for less strenuous approaches to enable streamlined, large-scale operations. Mass and volume prove helpful when organizing, sorting, storing, packing, and conveying [12, 13]. They directly influence warehousing and shipping expenditures, which, in turn, affect sales revenue [14]. In agriculture, weight often serves as a proxy for size because it is easier to gauge than volume, though volume-based sorting yields greater efficiency [15]. Relative to mass, a fruit’s volume is less swayed by outside elements like moisture level. Because calculating the volume of asymmetrical bodies by geometric means is difficult, fruit volume is routinely assessed by gas or water displacement. Neither method fits production contexts, since both are most suitably carried out inside and consume substantial time. Moreover, the water displacement method (WDM) may degrade fruit quality. It therefore follows logically that published information on baobab fruit volume remains sparse. An operation that is markedly more productive, less taxing, readily scalable, and non-detrimental to fruit quality is needed to measure morphological traits.
Object detection is a widespread yet demanding pursuit in computer vision, but it can be applied to profile baobab fruits by mass and volume. The method seeks to pinpoint occurrences of object categories within a given image by exploiting color, texture, or alternative cues [16]. Earlier, image processing workflows and computer vision were capable of extracting the diameter, area, and perimeter of sphere-like objects [12, 17]. In contexts of fruit classification or separation based on color, texture, or morphological parameters, computer vision paired with regression constitutes a cost-effective, scalable solution [18]. In combination with other techniques, such approaches have been adopted to determine the mass and volume of cherry tomatoes in Nanjing, Jiangsu Province, China [14, 19], and Thai apple ber (taxonomically Ziziphus mauritiana L.) in Jodhpur, India [20].
Edible products are divided into axisymmetric and non-axisymmetric geometries [21]. Thus, an item qualifies as axis-symmetric when its cross-sections are circular while oriented perpendicularly to its major axis [19]; this group covers cherry tomatoes, eggs, watermelons, lemons, limes, oranges, and tangerines. On the other hand, axisymmetric fruits exhibit diverse geometries shaped by genetic and environmental factors [12]. In Sudan’s Kordofan, Gebauer and Luedeling [1] cataloged four baobab fruit forms: ventricose, crescent, globose, and fusiform. Gurashi and Kordofani [6] broadened that taxonomy by recording nine further forms across Sudan’s Blue Nile and North Kordofan States: ellipsoid, high spheroid, ovate, obovate, oblong-pointed, spheroid-emarginate, ellipsoid-pointed, clavate, and rhomboid. Consequently, the baobab fruit exemplifies a non-axis-symmetric class.
A range of geometric modeling and numerical analysis strategies has been applied to derive volumes by 3D reconstructing fruits from imagery captured under varying camera configurations [15, 19, 22]. Operating under the premises of axis-symmetric form, fixed fruit positioning, even illumination, and plain background, remarkably strong accuracy has been secured using elementary solids, solids of revolution, and conical frustum to predict fruit mass and volume [15, 22]. Nyalala et al. [19] used a 3D Kinect Infra-Red Sensor, insensitive to ambient light shifts. They are equipped with depth-sensing and straightforward image segmentation capabilities to generate depth maps for inferring tomato volume and mass. Nonetheless, departures from those premises in a live production setting can introduce inaccuracies into predictions of fruit mass and volume.
Furthermore, satisfying the requirements for axisymmetric geometries, fixed positioning, even lighting, and a plain backdrop proves exceptionally difficult in authentic field conditions. These conditions can erode the precision of resultant models and hinder their practical deployment. For example, Fitriyah [12] reported weak to moderate precision when using single frontal-view images for non-axis-symmetric shapes.
The present study seeks to move beyond the constraints imposed by the presuppositions of prior work. Its purpose is to construct a computer vision pipeline for predicting the volume of non-axis-symmetric baobab fruits from single-view RGB photographs taken in uncontrolled settings with uncontrolled positioning, illumination, and backdrop. The concrete objectives consist of (1) exploring fruit morphological trait variation between the study locales, (2) analyzing the Mask Region-based Convolutional Neural Network (Mask R-CNN) and tailoring it to segment baobab fruits effectively, (3) engineering an algorithm for 2D feature extraction, (4) building a model for volume estimation, (5) probing the connection between mass and volume, and (6) broadening point estimates of mass and volume into their underlying distributions. The tactic used to gauge fruit volume provides insights that can be used to fine-tune sorting operations, shipment scheduling, warehousing, and pricing mechanisms, thereby boosting operational efficiency and deal-making for vendors and purchasers alike. Grasping the mass–volume interplay during production planning can help predict storage capacity requirements for fruits once their mass is established.
Fieldwork took place across two municipalities—Nandom and Kasena–Nankana East—situated within Ghana’s savanna ecological zone. Nandom Municipal falls inside the Upper West Region, its boundaries set by Longitudes 2°41′ W to 2°54′ W and Latitudes 10°44′ N to 11°00′ N. The Kasena-Nankana East Municipal occupies part of the Upper East Region, covering Longitudes 1°10′ W to 0°53′ W and Latitudes 10°30′ N to 11°01′ N (Figure 1). Across the year, average monthly temperatures spanned from a low of 21 °C to a high of 32 °C. A dry spell dominated from November through April, after which rains arrived from May until September or October [23].
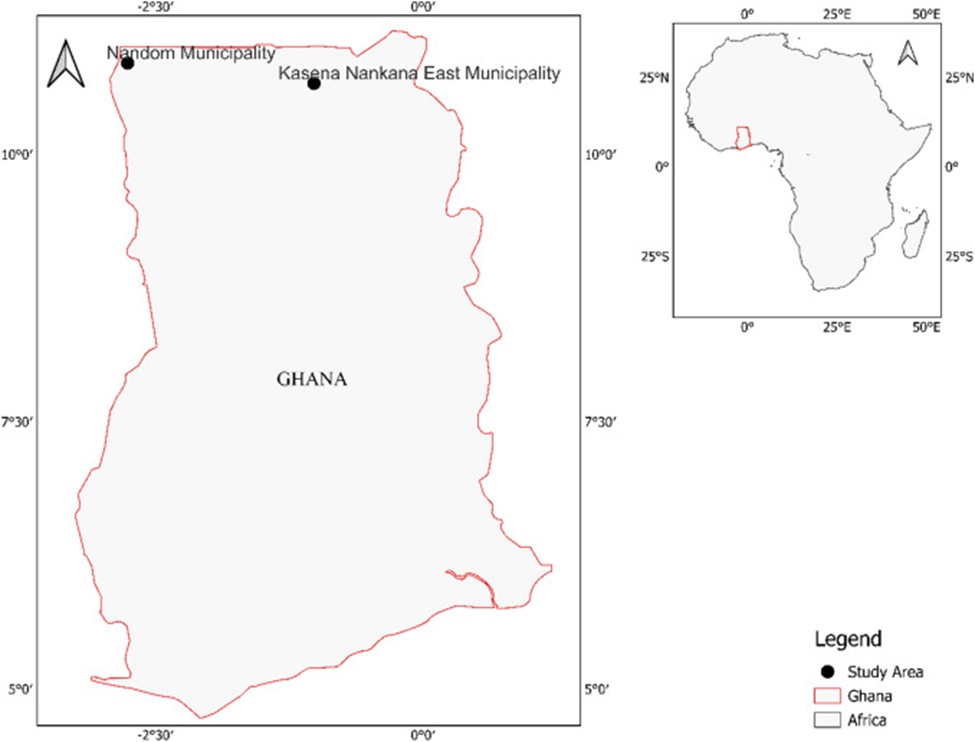
Figure 1. Study area in Africa within the savanna ecological zone of Ghana.
The baobab tree (Adansonia digitata L.) is of considerable importance, particularly for enterprises in food, cosmetics, and pharmaceuticals [7]. This deciduous giant can reach 20–30 m in height, endure for multiple centuries, and develop a trunk diameter of 3–7 m [24]. Odoom [5] describes its fruit as having a sharp, acidic tang while packing more calcium than spinach and higher vitamin C content than sweet oranges. Upon ripening, the fruit forms an ovoid capsule about 35 cm long and 17 cm across, sheathed in a woody outer layer and filled with black seeds embedded in a chalky pulp [24].
Across Ghana’s savanna ecological zone, 166 baobab fruits were harvested from 43 trees chosen at random. Of the total collection, 101 fruits originated from 26 trees located in Nandom Municipality (Nandom), and the remaining 65 came from 17 trees in Kasena Nankana East Municipality (Navrongo). Harvesting followed the techniques set out by Odoom [5] and was carried out during the annual picking season in February and March. From each tree, three or four fruits were taken from the crown quadrants—northeastern, southeastern, southwestern, or northwestern.
Every one of the 166 fruits underwent direct measurement of its volume and mass. Each specimen bore a label encoding both the study area code and a unique identifier; these tags stayed with the fruit throughout all measuring steps. All readings were recorded at room temperature. Mass was determined to an accuracy of one gram. Each baobab fruit was first enveloped in Saran Wrap, then pushed beneath the water surface with a sinker rod whose volume was negligible, and the water that overflowed was collected and weighed. Volume in cubic centimeters (cm³) was back-calculated using water’s density at room temperature. A flexible measuring tape, precise to 0.10 cm, served to obtain both the major lengths and the maximum circumferences of the fruits.
At the heart of the proposed system’s conceptual design lies an image of one or more baobab fruits serving as the initial input. A customized Mask R-CNN model handles fruit detection along with segmentation (instance segmentation), thereby overcoming difficulties arising from variable fruit orientation, shape, lighting, and background. Once binarized, the resulting output yields two-dimensional (2D) features that feed into estimates of fruit volume—or mass, provided volume is already established. To move beyond mere point estimates and broaden the data’s value for production planning, the sample’s distribution is subsequently computed (Figure 2).
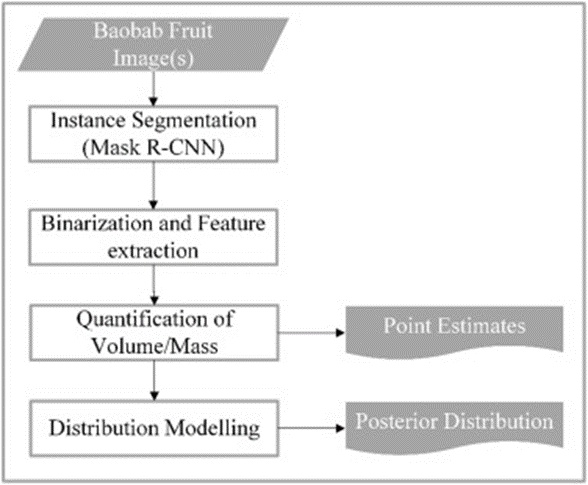
Figure 2. Conceptual framework of the proposed system.
An iPhone XS Max rear camera, with a 4.25 mm focal length and a 3024 × 4034 resolution, was used for all image acquisition. The device was positioned exactly 130 cm from the midpoint of a white backdrop sheet measuring 93 cm × 123 cm. Working with the Nandom collection, pictures featuring differing numbers of fruits were taken and then reduced in resolution to 381 × 503 pixels. Annotation duties were handled by the Visual Image Annotator (VIA) tool developed by the Visual Geometry Group (VGG) [25]. These annotations were reformatted to conform to the COCO-style specification [26] and split into 80% for training and 20% for testing. Fine-tuning of the Mask R-CNN for detection and instance segmentation relied on these newly prepared datasets (Figure 3). The ResNet-50 feature pyramid network (FPN) served as the backbone, and initial model weights were sourced from the Zoo model repository.
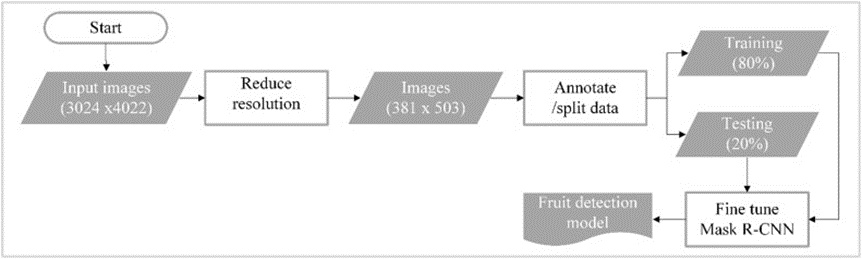
Figure 3. Training and testing procedure for fruit detection and segmentation.
Model performance feedback was based on tracking four metrics: loss box regression, loss classification, loss mask, and mask accuracy. The loss box regression metric captures errors in bounding-box predictions. Loss classification reveals how well the model assigns the correct category label to each detected entity, while loss mask gauges the fidelity of pixel-level mask predictions. Smaller values were pursued for all three loss indicators. Mask accuracy, conversely, reports the proportion of correctly predicted mask pixels, with values approaching the upper limit signaling strong segmentation precision.
Fruits were sorted by study area of origin, then photographed in groupings ranging from a single fruit to 25, ignoring any particular spatial arrangement among them. To expand the dataset, each image was rotated by 30° in 360° increments, then flipped horizontally (left-right) and vertically (up-down). This augmented collection was passed through the already-trained Mask R-CNN to detect and segment each distinct baobab fruit region, producing a predicted mask image in which each continuous area received a unique identifier. These predicted masks were next turned into binary fruit-versus-background images and relabeled. The scikit-image library was used to pull geometric and positional descriptors from the relabeled binary output by measuring a set of region properties. The measured quantities included (1) the segmented area, (2) the centroid coordinates, (3) the bounding box coordinates, (4) the equivalent diameter, and (5) the major diameter. The distinct labels and their accompanying region property measurements were saved in a Comma-Separated Values (CSV) file (Figure 4).
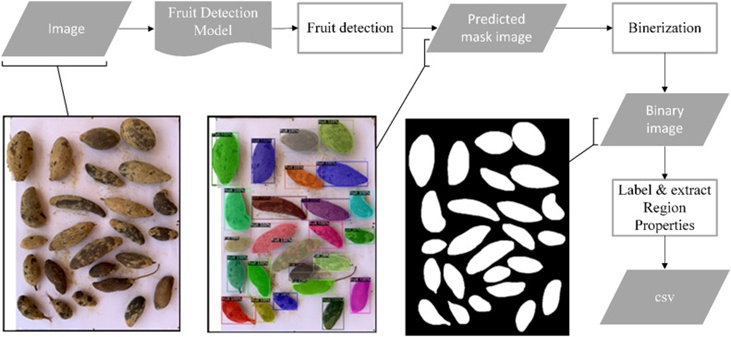
Figure 4. Instance segmentation of an image of baobab fruits to produce a predicted mask image for two-dimensional feature extraction.
To gauge how well the segmentation procedure performed, images containing more than a single fruit were examined.
Two-dimensional features extracted from Nandom single-fruit images were linked to corresponding volume readings obtained via WDM and used for model training and testing; likewise, the Navrongo records served solely as the validation set. From the CSV dataset, any entry that did not correspond to a single-fruit image was removed. The surviving entries were paired with their corresponding WDM volume values and split by study area. Nandom data were then split into a training subset (70%) and a test subset (30%). These subsets served as input for linear, polynomial, and radial support vector machine (SVM) variants, alongside random forest regression, to identify the most suitable predictive models. The Navrongo data were held aside to validate model performance (Figure 5). Model quality was judged through mean absolute error (MAE), root mean square error (RMSE), and the R-squared (R2) coefficient.
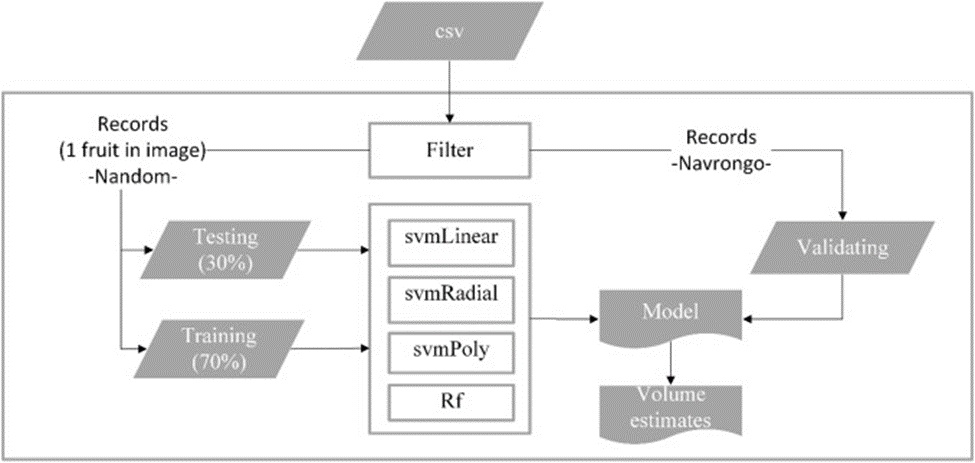
Figure 5. Training, testing, and validation process for volume quantification using machine learning.
A paired t-test, alongside the mean-difference confidence interval technique, was applied to contrast the validation-set volumes estimated by each model (support vector machine and random forest) with those obtained via water displacement. To visualize the level of concordance, the method proposed by Bland and Altman [27] was used to plot the agreement between baobab fruit volume determined by water displacement and values generated by machine learning algorithms. All statistical computations were conducted within the R environment.
To characterize the probability density functions underlying the sampling distributions of means and standard deviations for fruit mass, volume, and density, a bootstrap resampling strategy was paired with R’s distribution fitting package. Candidate fits spanning the normal, exponential, gamma, logistic, Cauchy, Weibull, and log-normal probability density functions (PDFs) were assessed, with selection based on the Akaike information criterion (AIC) and the Bayesian information criterion (BIC). A normal distribution ultimately approximates every sampling distribution of means. The top-fitting distributions then informed the Bayesian prior definitions for both the mean (mu) and the standard deviation (sigma). These prior specifications served as stand-ins for domain or industry understanding of the underlying population-level fruit distribution. Arbitrary cutoff values were adopted and treated as industry norms, allowing fruit mass, volume, or density to be assigned to categories of small/low, medium, or large/high.
The pipeline next derived posterior distributions from the point estimates supplied by the fruit quantification models. These distributions yielded insight into the credible intervals bracketing each point estimate and the probability that any given sample would be classified into a particular tier (small/low, medium, or large/high), a process facilitated by the RStan package (Figure 6) [28, 29]. Density was calculated simply as the quotient of mass divided by volume.
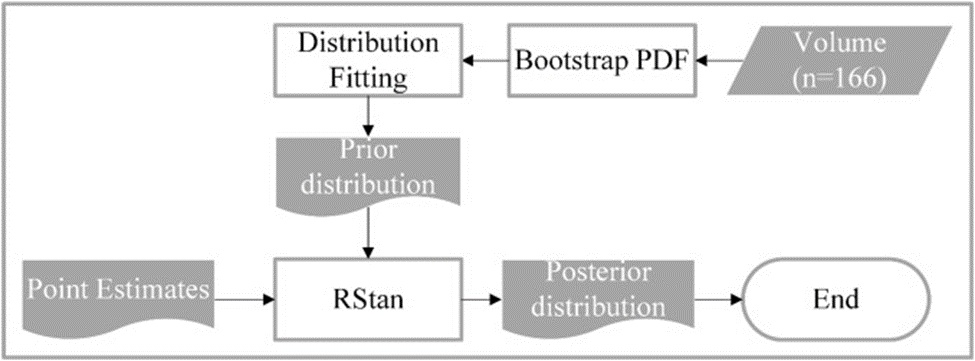
Figure 6. Volume estimation and distribution modeling from new images.
Variation in both shape and measured traits was evident across the sample. Four distinct shape categories emerged: fusiform (36%), crescent (12%), ventricose (45%), and globose (8%). Volume readings ranged from 150 cm³ to 1820 cm³, and weight ranged from 60 g to 640 g. Maximum length was found to lie between 10 cm and 39 cm, with maximum circumference ranging from 18.4 cm up to 41 cm (Table 1).
Table 1. Summary statistics of measured fruit characteristics.
Statistic | Circumference (cm) | Max. length (cm) | Volume (cm³) | Weight (g) |
Min. | 18.4 | 10.0 | 150 | 60 |
1st Qu. | 24.0 | 19.0 | 423 | 150 |
Median | 27.2 | 23.0 | 620 | 210 |
Mean | 27.3 | 23.0 | 682 | 226 |
3rd Qu. | 30.2 | 27.0 | 880 | 290 |
Max. | 41.0 | 39.0 | 1820 | 640 |
Sd | 4.535 | 5.811 | 0.339 | 0.109 |
Overall, the spread of data from Nandom proved wider than that originating from Navrongo. Nandom’s range entirely swallowed that of Navrongo, diverging only in how often certain values were recorded. A skewed pattern characterized the distributions of all attributes measured (Figure 7).
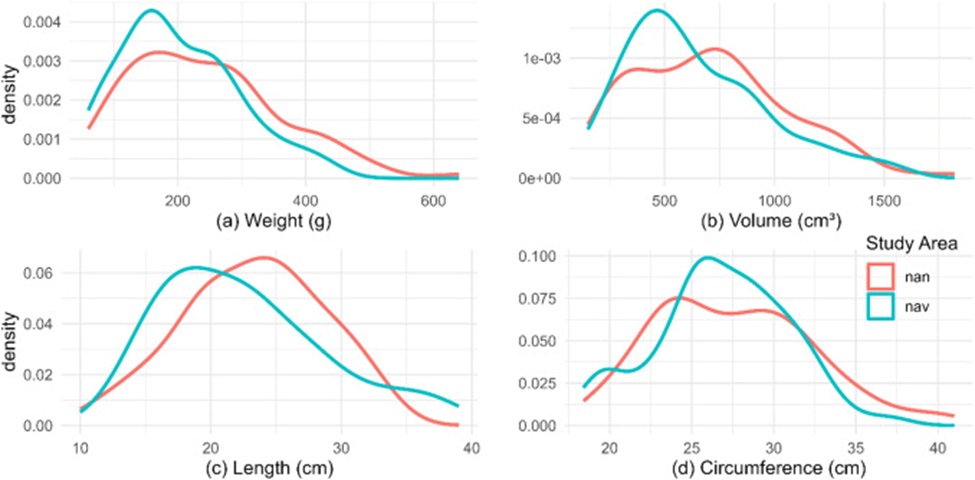
Figure 7. Distribution of morphological characteristics in samples collected from the Nandom (nan) and Navrongo (nav) study areas.
Means, standard deviations, and density summaries broken out by study area are laid out in Table 2. For nearly every parameter, both the average and the dispersion recorded at Nandom Municipality outstripped the corresponding figures from Navrongo. A break from this trend was observed in mean length, which, although larger among the Nandom samples, had a smaller standard deviation than its Navrongo counterpart.
Table 2. Summary of the means and standard deviations of the measurements and densities from the study areas.
Study area | Variable | Density (g/cm³) | Circumference (cm) | Length (cm) | Volume (cm³) | Weight (g) |
Nandom | Mean | 2.933 | 27.543 | 23.240 | 707.2 | 241.6 |
Std. dev | 0.507 | 4.839 | 5.444 | 349.9 | 116.9 | |
Navrongo | Mean | 3.181 | 26.843 | 22.555 | 643.8 | 202.2 |
Sd | 0.480 | 4.016 | 6.361 | 320.5 | 91.4 |
Circumferential measurements and density readings collected across both study sites were consistent with a normal curve; the same held for length values gathered at Nandom. Comparing the two study areas, the difference in mean circumference was not statistically significant (P = 0.314), whereas the difference in average density was significant (P = 0.002).
Normality did not hold for weight, volume, and length within the Navrongo subset. From Nandom, the median weight was 230.0 g, median volume 710.0 cm³, and median length 23.60 cm, with interquartile ranges (IQRs) of 0.16, 0.49, and 8.00, respectively. The corresponding Navrongo medians were 170.0 g, 580.0 cm³, and 22.00 cm, and their IQRs were 0.12, 0.42, and 10.00, respectively. No statistically significant difference emerged in median volumes recorded across the two sites (P = 0.265) or in lengths (P = 0.178). Weight, though, yielded a significant site-driven difference (P = 0.037). Such observable contrasts are likely attributable to influences steered by the climatic gradient.
After a full 3000 training iterations, the final loss box regression settled at 0.061, the loss classification at 0.015, and the loss mask at 0.052. As the training cycle progressed, each loss metric—covering box regression, classification, and mask—steadily decreased, reflecting the model’s growing competence in both detection and segmentation. A mask accuracy of 97.77% further underscored the model’s ability to isolate baobab fruit pixels correctly.
A wide degree of variety characterized the two-dimensional (2D) image descriptors extracted from segmented fruit zones. By way of illustration, the spread in pixel count for equivalent diameter (Eq. Diameter) clocked in at roughly 30 pixels, whereas bounding box area (Bb. Area) spanned approximately 394,232 pixels. Traits such as major diameter followed a noticeably tighter distribution, while the rest were far more scattered, highlighting the intrinsic diversity of the dataset.
Throughout the training stage, the random forest model distinguished itself as the most capable and reliable performer, yielding an RMSE of 15.80, an R2 of 99.8%, and an MAE of 8.47. svmLinear occupied the opposite end of the spectrum, producing the least favorable metrics. The remaining models turned in moderate training results. Testing largely reproduced this ordering, with random forest again on top and svmLinear at the bottom. In the test dataset, svmRadial and svmPoly swapped their relative positions compared with their training ranks. A slight downturn in performance accompanied the transition from the training phase to the testing phase.
Within the validation dataset, svmPoly led, with svmLinear nearly matching it in terms of R2. At the same time, svmLinear posted the lowest RMSE and MAE. The RF model offered a well-rounded mix of RMSE, R2, and MAE. Across every metric, svmRadial produced the poorest results.
Plotting model-estimated single-fruit volumes against the benchmark WDM volumes from the validation dataset offers a clear summary of predictive accuracy. Aside from svmRadial, whose points drifted off course, and svmPoly, which showed a persistent bias toward underprediction, the plotted points hugged the 1:1 line closely (Figure 8).
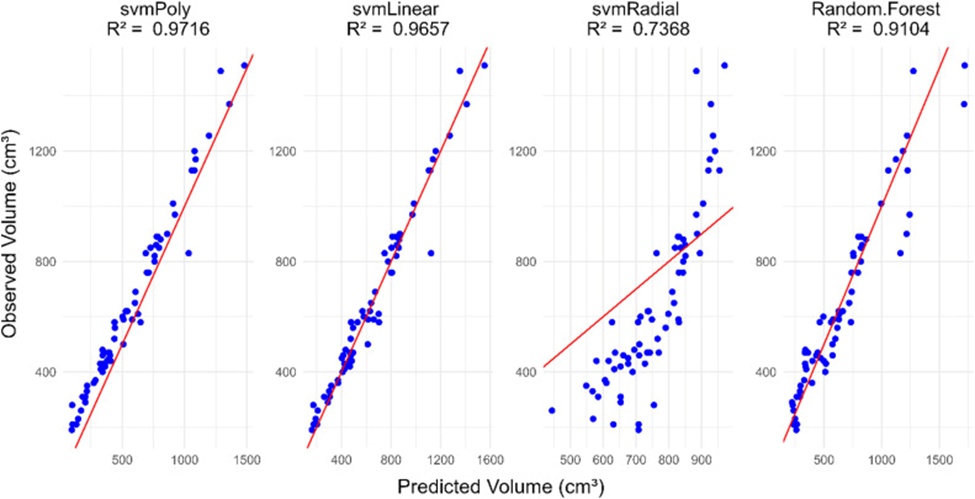
Figure 8. Regression of the observed (WDM) volume from Navrongo on the predicted volume from machine learning models.
The average differences between the volume predictions from the svmPoly, svmLinear, and random forest models and those from the water-displacement method (WDM) were not statistically significant (P ≥ 0.05). svmRadial, in contrast, registered a significant divergence (P = 0.01).
Looking at the Bland–Altman panels in Figure 9, the distribution of differences between model-generated and WDM-derived volumes took a normal shape. The span between the two dotted lines (the 95% limits of agreement) should enclose 95% of these volume disparities. Individual breakdowns appear in Figures 9a–9d. For svmLinear (Figure 9a), svmPoly (Figure 9b), and random forest (Figure 9d), the deviations were normally distributed.
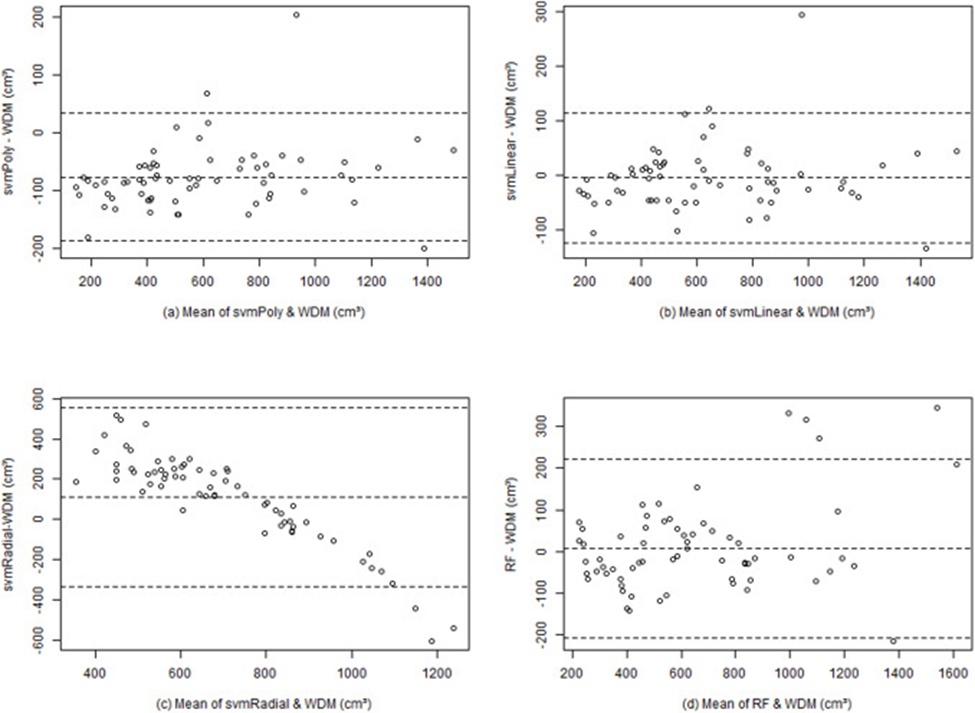
Figure 9. Bland‒Altman plot for the comparison of volumes estimated by machine learning models and the water displacement method (WDM); the outer lines indicate the 95% limits of agreement, and the centerline shows the average difference.
As revealed in Figure 9c, among small baobab fruits, svmRadial tended to return volume figures exceeding those from the WDM, whereas for large fruits, the reverse held. Thus, the approach inflates volumes at the lower end of the size spectrum and deflates them at the upper end. A nonlinear link between the extracted image descriptors and volume may account for this pattern.
For the SVM models, the segmented fruit region’s pixel area together with the equivalent diameter overwhelmingly dominated, jointly shouldering close to 100% of the explained variance. No other variable exceeded the 80% contribution mark. Major diameter managed 68.25%. Features encoding fruit position were generally either negligible or made only a token contribution.
Switching to the random forest model, the major diameter variable reigned supreme, singly accounting for nearly 100 % of the explained variance. The pixel area of the segmented fruit region and the equivalent diameter provided limited value, neither exceeding 40% explanatory power.
A scatter diagram of observed mass versus observed volume is shown in Figure 10a. The data revealed a quadratic relationship between mass (g) and volume (cm³), with an intercept term of 38.23, a first-order coefficient of 0.25, a squared-term coefficient of 4.49 × 10⁻⁵, and an adjusted R² of 92%. Regressing the resulting mass estimates onto the observed mass values produced Figure 10b. Here, the data clustered at random along the 1:1 line characterized by a slope of 1 and an intercept of 0.
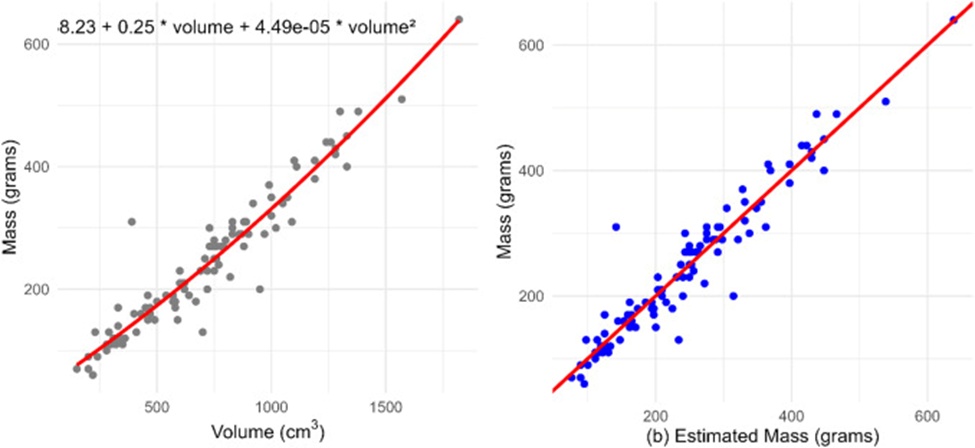
Figure 10. (a). Regression of observed mass to volume, mass = 38.23 + 0.25 × volume + 4.49e−05 × volume2, R2 = 92%, and (b) scatter plot of observed mass to estimated mass around the 1:1 line.
Among one million bootstrapped sampling distributions of the mean, mass, and volume, each conformed to a gamma PDF, whereas the density adopted a log-normal form. As for dispersion, the distribution of standard deviations followed a gamma for mass, a normal for volume, and a log-normal for density.
Rhat (Ř) statistics computed across all models were equal to 1, confirming that the Markov chain Monte Carlo sampling procedure had properly converged. The degree of autocorrelation decreased with increasing lag, approaching zero at roughly five for the examined samples. A strong gravitational pull toward the center was also evident, flanked by haphazard deviations that lacked any systematic pattern and did not segregate the individual chains.
Figure 11 depicts the posterior distributions in red and the industry distribution in blue. This illustration indicates that the bulk of Nandom-sourced fruits originated from a population with an average mass of 218.87 ± 7.00 g and a standard deviation of 8.04 ± 0.42 g. Volume’s posterior distribution bore a strong resemblance to the population-level distribution, recording a mean of 671.39 ± 22.03 cm³ and a standard deviation of 25.84 ± 1.25 cm³. Density, however, produced a still narrower distribution than those characterizing mass and volume, with a mean of 0.33 ± 0.00 g/cm³ and a standard deviation of 0.004 ± 0.00 g/cm³ (Figure 11).
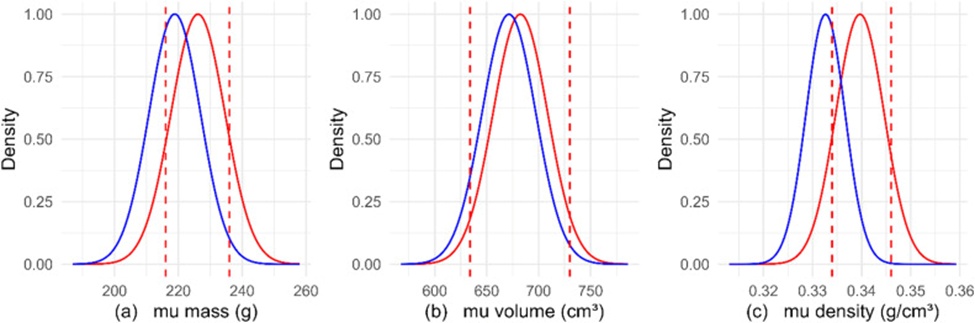
Figure 11. Comparison of prior (red) and posterior (blue) population distributions of samples obtained from Nandom.
The probability of falling below the lower cutoff was highest in the density distribution and lowest in the volume distribution. This ordering flipped inside the zone bounded by the two thresholds. Past the upper cutoff, probabilities decreased progressively as mass was converted to volume and then to density (Table 3).
Table 3. Cumulative probability below, between, and above the threshold for mass, volume, and density posterior distributions.
Probability | Density (g/cm3) | Volume (cm3) | Mass (g) |
Below min threshold | 0.60 ± 0.28 | 0.13 ± 0.16 | 0.39 ± 0.26 |
Between the max-min threshold | 0.39 ± 0.26 | 0.82 ± 0.15 | 0.55 ± 0.21 |
Above the max threshold | 0.01 ± 0.03 | 0.04 ± 0.08 | 0.05 ± 0.09 |
The spread of fruit mass values sampled in Nandom outstripped the variability encountered in Navrongo; nevertheless, the entire band of Navrongo readings sat fully within the envelope delimited by the Nandom observations. Studies situated in Mali and Malawi, representing western and southeastern Africa, respectively, have documented similarly expansive intervals [9]. The central tendency for fruit mass reported here was marginally higher than that computed for both Malian and Malawian samples, while still overlapping the bands described in earlier publications [6, 30]. Such subtle shifts in average values across investigations offer little reason to suspect that distinct underlying populations were being sampled.
Fruit size or volume is routinely proxied by either maximum diameter or overall fruit length [9]. Across the African landmass, the documented ranges for fruit length are 7.5-54 cm and for width, 7.5-20 cm [6]. The wide gulf between the minimum and maximum figures aligns with the volume heterogeneity documented in the current work. It provides a rationale for deploying the derived algorithms across a broad range of circumstances. Caution is nonetheless warranted against blanket application, given that the sample set may not faithfully represent every baobab variant on the market.
Within a study authored by Omid et al. [31], computer vision combined with image processing methods was harnessed to infer fruit volume, producing R2 coefficients of 96.2% for lemons, 97.0% for limes, 98.5% for oranges, and 95.9% for tangerines, each acting as a barometer of model fit. The random forest model trained in the present work yielded an R2 of 99.8%, surpassing all four benchmarks. In direct opposition to the conclusions reached by Fitriyah [12], the current evidence reveals that single-view imagery of non-axis-symmetric fruits can indeed furnish volume predictions of respectable accuracy. Nyalala et al. [19] argued that blending 2D and 3D feature variables enhances the fidelity of volume estimation relative to using 2D features in isolation. Still, two-dimensional models retain the edge in simplicity, speed, and a lighter computational footprint.
Throughout the current study, svmRadial exhibited a clear bias, persistently inflating the volumes of small fruits while deflating those of large specimens. Any operational or strategic choice anchored to such erroneous outputs risks inflicting financial damage, mispricing, and disruptions across resource planning and supply chain coordination.
When stacked against position-based variables, two-dimensional geometric descriptors prove to be powerful surrogates for estimating baobab fruit volume. The major diameter claims the top spot within both the random forest setup and the suite of support vector machine variants. When restricting the lens to support vector machine models alone, the pixel area of the segmented region and its equivalent diameter are stronger candidate regressors than the major diameter.
Prior research has relied heavily on 2D image descriptors—projection area, perimeter, eccentricity, major-axis length, minor-axis length, radial distance, and the horizontal and vertical extents of the bounding box—to estimate volume via regression [12, 19]. Notwithstanding the gains realized, the spotlight has largely been trained on fruits possessing axis symmetry. The equivalent diameter metric introduced in this investigation, and demonstrated to be a meaningful regressor within support vector machines, carves out a promising new direction for continued inquiry into axis-nonsymmetric fruit volume [19].
In a subset of production, commercial, or investigative scenarios, recording mass may be the more expedient choice. A single-variable functional mapping from mass to volume is therefore fitting for converting both directly determined volumes and machine-learning-generated volume estimates into their equivalent mass readings.
Information on fruit size distributions carries considerable weight for grading and sorting operations. Within the baobab fruit trade, size signals sweetness and sways consumer choice and market valuation [5, 6]. Pulp proportion and weight likewise enter the calculus when grading baobab fruits [32]. According to findings by Venter and Witkowski [33], larger fruits contain more seeds and more pulp, rendering size-based sorting a useful tool for sharpening predictive power. These authors resorted to fruit length coupled with diameter to bin mature baobab fruits into the three conventional size grades. Deploying several criteria in tandem, however, can prove unnecessarily intricate.
This study advances an alternative route: cumulative probability calculation grounded in the distributional behavior of directly measurable physical quantities—mass, volume, and density. Relying on observable physical characteristics simplifies the task of fixing size cutoffs and categorizing baobab fruits as small, medium, or large. The model draws effectively from the posterior distribution.
Sound stewardship of storage and freight logistics within the baobab fruit sector demands familiarity with the crop’s physical trait distributions. By slotting fruits into size classes defined by measurable physical properties, sellers can supply buyers with harmonized size grades, thereby injecting transparency and uniformity into product offerings. Buyers can then weigh decisions against their particular requirements or size preferences. Weaving this model into supply chain operations can drive efficiency gains from warehousing through distribution and on to point-of-sale transactions. A command of baobab fruit size grounded in physical properties enables leaner workflows, reduced overheads, and higher customer satisfaction.
This study illuminates the morphological characteristics of baobab fruits across the two sampled zones. The morphological metrics recorded among Nandom specimens eclipse those recorded in Navrongo, underscoring the role environmental factors play in sculpting fruit morphology.
The work also strengthens the case that combining computer vision with machine learning—illustrated by random forests and support vector machines—enables efficient volume inference from 2D image-derived features, notably the major diameter, the segmented fruit region pixel area, and the equivalent diameter. The newly introduced equivalent diameter of the segmented fruit region emerges as a potent predictor in support-vector-machine-based volume models. Computer vision identifies baobab fruit in an image with 97.77% accuracy, and the random forest model quantifies volume with an R2 of 99.8%, suggesting that models relying exclusively on 2D image features can serve as a practical substitute for direct volume measurement. Moreover, a quadratic relationship between mass and volume was substantiated, with an R2 of 92 %.
The single-point estimates generated by computer vision and machine learning workflows can be enriched by recovering posterior distributions for the samples under examination, delivering insights that can refine sorting lines, haulage planning, storage allocation, and pricing mechanisms.
Commercial entities specializing in the manufacture of baobab powder and seed oil would be well served by integrating these models into their production scheduling. To refine model performance, future inquiry should explore the imprint of climatic gradients on the morphological expression of baobab fruits.
Taken as a whole, this study advances understanding of baobab fruit morphology. It spotlights the value that artificial intelligence approaches, coupled with distribution modeling, can offer to ecological research and agricultural administration. The outcomes chart a course for subsequent investigations to improve fruit quantification and managerial planning across the agricultural sector.
The authors thank the West African Centre for Water, Irrigation and Sustainable Agriculture (WACWISA) and the University for Development Studies, Ghana, for providing the necessary support to conduct this study.
None
This work is funded by the Ministry of Foreign Affairs of Denmark and administered by the Danida Fellowship Centre through the Climate Change Resilience of Ecosystem Services (CRES) Project with Grant No. DFC File No. 20-13-GHA.
None
Open Access The author(s) retain copyright. This article is licensed under the Creative Commons Attribution-NonCommercial-ShareAlike 4.0 International License. It may be shared and adapted for non-commercial purposes with appropriate attribution, an indication of changes, and distribution of adaptations under the same license. Third-party material may be subject to separate terms identified in its credit line. View the license at https://creativecommons.org/licenses/by-nc-sa/4.0/.
 Agro Intelligence Research Press