The choice of methodologies is a pivotal factor in disease identification, particularly when computer vision intersects with agricultural innovation. Safeguarding global food supplies depends on the timely and accurate identification of crop diseases. Deep learning offers a feasible pathway to satisfy this demand. To move this research forward, we engineered and tested a disease identification framework grounded in a novel ensemble strategy. Our contribution includes the presentation of DenseNetMini, a more compact iteration of the DenseNet architecture. We advocate merging DenseNetMini with a learning resizer via an ensemble approach to improve training fidelity and accelerate knowledge acquisition. A further innovative element involves deploying Gradient Product (GP) as the optimization mechanism, efficiently reducing the training time while simultaneously improving model performance. Investigating imagery at varying magnifications reveals remarkable improvements in diagnostic consensus and precision. Accuracy figures on test data reach 99.65%, 98.96%, and 98.11% for the Plantvillage, Tomato leaf, and Appleleaf9 collections, respectively. A core triumph of this investigation is the substantial reduction in computational time, suggesting that GP adoption could make agricultural disease screening more accessible and operationally efficient. Beyond numerical gains, the work foregrounds Explainable Artificial Intelligence (XAI) approaches as indispensable for enhancing the interpretability and clarity of the disease detection framework. By visually pinpointing diagnostically relevant zones on foliage, XAI enhances the model’s comprehensibility, thereby nurturing user confidence and insight into how it arrives at its conclusions.
The opening statement stresses the absolute necessity of reliable disease diagnosis and control within the fundamental domain of agriculture [1]. Because crop vitality has a direct bearing on the global food supply, the capability to confront these obstacles competently becomes imperative. As detailed in the studies by [2], the deep learning paradigm addresses this issue by stepwise extracting high-level attributes from raw input. The convergence of machine vision with agronomic technology has notably intensified the drive to enhance crop health and productivity through automated pathology identification systems [3].
The farming sector has recently entered a revolutionary period termed Smart farming, defined by the pervasive infusion of sophisticated tools such as Big Data analytics, Machine Learning, and the Internet of Things [4]. These breakthroughs have overhauled rice cultivation practices, enabling substantial gains throughout every phase of production. The striking evolution in agricultural operations can be credited to the maturation of deep Convolutional Neural Networks (CNNs) powered by Artificial Intelligence (AI) [5-7]. In the agricultural sphere, CNNs have proven to be a formidable asset applicable to a wide array of tasks [8-10]. Such uses span the spectrum from diagnosing plant illnesses and distinguishing crop varieties to sorting fruit quality and cataloging land characteristics. Significantly, CNNs have matched the precision levels of trained human observers in these undertakings. CNN architectures have been refined to handle the complexities of multi-class scenarios better. This refinement has largely centered on deepening the network by expanding its layer count.
As a consequence, CNNs have become increasingly versatile and adept at handling complex classification tasks involving numerous categories [11]. The CNN landscape has undergone considerable transformation in recent years, giving rise to a suite of deeply impactful frameworks. Within this set, GoogleNet, AlexNet, Inception-V3, VGG-16, DenseNet, and ResNet-50 have surfaced as the most commonly adopted and celebrated designs. These pre-trained models have proven central to a variety of computer vision challenges, delivering outstanding results and expanding the horizons of what deep learning can achieve. The central challenge now is navigating computational bottlenecks, data scarcity, and farming-specific obstacles that require targeted remedies. Identifying and classifying these pathologies equips growers with an early intervention strategy, ultimately mitigating damage to apple harvests. The age-old practice of relying on unaided visual inspection for disease detection is prone to error [12].
Disease management in the agricultural arena presents distinct hurdles, stemming from constrained resources and the urgent need for swift responses. This is where a fresh tactic comes into play: a collective model built upon DenseNetMini that fuses the adaptable strengths of DenseNet’s advanced blueprint with bespoke gradient adjustments and adaptive learning cycles. In this manuscript, we evaluate our model’s performance across three distinct datasets on pathologies affecting the foliage of apple and tomato plants. The strategy rests on an ensemble framework anchored by DenseNetMini, spotlighting two vital mechanisms: the adaptive learning resizer function and the manipulation of gradient products. By weaving these components into the framework, the framework not only achieves greater accuracy but also accelerates learning. The operational efficiency examined here carries substantial weight in deep learning circles, notably regarding its implications for compressing training timelines. The inception of DenseNetMini arose as a targeted solution to the limitations of DenseNet, with a specific lens on its suitability for phytopathological screening in farming contexts. The DenseNetMini architecture excels at feature extraction while mitigating common pitfalls, such as the vanishing gradient problem, thanks to its hallmark dense interconnections and an intentionally orchestrated progression of convolutional, pooling, and transition stages. Saliency maps and Grad-CAM (Gradient-weighted Class Activation Mapping) are the two XAI tools woven into our study to enhance the clarity and accountability of our illness detection system. Saliency maps afford us a view of which image segments exert the greatest influence on the model’s decisions. Grad-CAM further deepens the interpretability of our framework.
This investigation scrutinized how DenseNetMini tackles and overcomes a range of shortcomings that plague its bulkier counterparts. Making rendering farm equipment with limited resources more feasible for real-world use hinges on curbing both computational load and memory consumption. Achieving this requires a deliberate reduction in the model’s architectural depth and complexity. The current inquiry delves into the potential merits of deploying DenseNetMini in farming environments, focusing on its slimmer parameter footprint and its inherent ability to curb overfitting, particularly when trained on limited data. Beyond merely strengthening interpretability, the stripped-down nature of the framework permits a more transparent window into the characteristics it assimilates. In weighing computational overhead against parameter frugality, this model stands out as a persuasive candidate for phytopathological surveillance. Striking an equilibrium between strong performance and minimal resource consumption, it offers a capable yet economical alternative. Our introduced architecture has carved out a notable niche in visual classification, serving as a pliable and powerful tool. Its ability to adapt to varied conditions while delivering striking outcomes positions it as a prime pick for such responsibilities. The design owes its renown for high-caliber feature extraction to a singular dense wiring scheme and a meticulously orchestrated cascade of convolutional modules, downsampling phases, and transitional blocks. By weaving in dense skip connections, the blueprint deftly sidesteps pitfalls like gradient decay. The driving force behind this study stems from the imperative to successfully implement disease-identification technologies in agriculture while simultaneously navigating the sector’s unique processing and data-scarcity challenges. Even where earlier initiatives have commandeered architectures such as DenseNet to address these issues, lingering headaches tied to baseline computational costs and expansion challenges persist. The DenseNetMini construct exerts a meaningful effect on cultivation workflows. Pinpoint-accurate and swift diagnosis of foliar disorders plays an indispensable role in farming, opening the door to early countermeasures that curb yield destruction and reinforce food supply stability. Harnessing this innovation could equip cultivators with the means to make data-informed decisions, thereby driving a substantial uptick in agrarian output. The implications of DenseNetMini radiate outward from agriculture, permeating a host of disparate disciplines. The trailblazing deep learning philosophy exhibited in this work harbors the power to trigger sweeping changes in model conditioning, resource husbandry, and knowledge portability. The supplied text spotlights farming’s function as a conduit for confronting a dire planetary challenge while simultaneously stressing the promise of wide-scale rollouts of nimble yet precise deep learning pipelines. Insights from this study have transferable value across alternative crop species or industrial sectors, potentially slashing development timelines.
Within the agrarian sphere, injecting AI—explicitly XAI—is fundamental to nurturing reliance on mechanized decision pipelines. XAI’s built-in capacity to illuminate the logic driving agricultural AI outputs ensures that growers and other stakeholders understand the genesis of specific advisories or forecasts. Such clarity is foundational for engendering the faith necessary to embrace AI-powered instruments in domains such as crop stewardship and pathogen detection [13, 14]. This manuscript aspires to reconcile the capabilities proffered by computer vision with the pragmatic constraints of on-farm realities. More pointedly, we unveil an original scheme for pinpointing agricultural maladies that remains parsimonious with resources yet elastic enough to accommodate the throughput demanded by expansive agribusiness ventures. By reconciling these two realms, we aim to raise the bar for field disease surveillance and advance the broader cause of plant health governance. Systematic uptake of such practices can tangibly amplify both the ecological integrity and productivity of farming operations. The subsequent dissection provides a comprehensive inventory of the relative strengths and weaknesses of incumbent-detection modalities in agricultural environments. Within the scope of the present research, our endeavors make consequential advances in both crop pathology identification and next-generation cultivation techniques. Our work delivers several cardinal contributions:
• DenseNetMini: We unveil DenseNetMini, a lightweight neural fabric tailored explicitly to spot crop afflictions, which directly confronts resource bottlenecks and supplies a blend of operational efficiency and dependable precision.
• Optimization techniques and reduction in complexity: Gradient-centric refinement procedures (GP) are deployed to elevate model fidelity and compress the duration of the training cycle. Architectural intricacy is markedly pared down via these optimization levers, enabling on-the-spot disease diagnosis for in-field deployment.
• Ensemble model: A composite ensemble framework is advanced wherein DenseNetMini is fused with bespoke optimization regimens, with empirical evidence demonstrating that the collective construct surpasses the output of any solitary model across an assortment of agrarian benchmarks. This tactic provides a robust, adaptable solution for reliable disease classification.
This segment outlines the breakdown of the experimental findings. It begins with a granular survey of prior scholarship, followed by a description of the procedural framework employed, spanning data acquisition and preparation, the network blueprint, convolutional layers, and other pivotal facets. The subsequent discussion presents the core pillars of the methodological scaffold. The results obtained are then presented, together with an appraisal of the proposed model’s efficacy, encompassing evaluation metrics and training and validation regimes. The takeaways and constraints identified during the inquiry are subsequently discussed. In closing, the study provides a synopsis and charts possible trajectories for future research.
Strides in deep learning have paved the way for inventive solutions to leaf-borne disease detection. In this section, we sift through seminal investigations and paradigmatic approaches that have shaped the genesis of our introduced model, DenseNetMini, while highlighting what sets their scholarly footprint apart. Experimenters have applied CNN paradigms to precision agriculture, reaping intriguing dividends.
Empirical evidence has confirmed that the proposed method effectively flags seven widespread cucumber maladies, achieving an aggregate recognition hit rate of 85.7%. This figure handily eclipses scores registered by competing methodologies [15, 16]. Scholars have bench-tested a suite of cutting-edge CNN skeletons against three distinct learning regimens for cataloging plant pathologies within an open-access image repository. These avant-garde blueprints push the envelope of plant disease taxonomy, achieving 99.76% accuracy. [17] pinpoint tomato leaf ailments using deep convolutional nets trained via transfer learning. The investigation enlists pre-trained heavyweights AlexNet, GoogLeNet, and ResNet, pitting them head-to-head under SGD and Adam optimizers. The ResNet–SGD pairing emerged triumphant, peaking at 96.51% accuracy. Subsequent dissection of ResNet’s transferred learning behavior examined the sway of batch volume and pass count. These patterns suggest that both beefier batch bins and longer iteration sequences can improve target-task precision. [18] endeavour to classify tomato foliage disorders using a range of CNN architectures, a task that requires rapid and accurate onset identification, taxonomic classification, and flagging. Ten distinct tomato pathologies are systematically classified leveraging Convolutional Neural Network configurations.
The study authored by [19] illustrates how effectively a deep learning framework can be harnessed to govern ATLDs. That said, the network we advance handily beats these rival designs (Inception-v3, MobileNet, VGG-16, DenseNet-201, Xception, VGG-INCEP), clinching a remarkable overall accuracy of 98.82%. Side-by-side evaluations were also carried out across convergence tempo, parameter volume, and sturdiness. When compared with the other candidates, our model showed the fastest convergence, a relatively low parameter count, and superior resilience. The contribution by [20] delineates two deep architectural schemes aimed at detecting infections across tomato foliage. The first scheme assimilates classification-oriented features via residual learning, whereas the second integrates an attention module directly into the residual deep backbone. Empirical tests drew on the early blight, late blight, and leaf mold categories housed within the Plant Village Dataset. The work presented harnessed an attention mechanism to exploit CNN-derived representations across multiple processing depths, ultimately achieving 98% accuracy on validation splits under 5-fold cross-validation. The treatise by [21] unpacks a deep learning-anchored route toward disease identification. A convolutional neural network-based pipeline is applied to discern and categorize pathological conditions. Within this model, three successive convolutional slabs and three max-pooling slabs are followed by a duo of fully connected layers. The empirical results show that the proposed construct outperforms three pretrained models—VGG16, InceptionV3, and MobileNet. Averaged over nine disease classes and a single healthy class, the recommended model’s classification accuracy settles at 91.2%, fluctuating between 76% and 100% according to the specific class under test. The article introduces an enhanced Faster R-CNN variant tailored to flag affected crop leaves, covering both healthy tomato specimens and four distinct pathological conditions. It draws on a more robust feature-extraction backbone, adjusts anchor-box dimensions via k-means clustering, and weighs alternative feature-extraction pipelines. The refined procedure leaves the baseline version behind, locking in a 2.71% accuracy uplift and faster inference [22]. This manuscript aimed to diagnose tomato foliage using AlexNet, VGG-16, GoogleNet, DenseNet-121, and ResNet-101, leveraging the publicly available PlantVillage dataset. VGG16, ResNet-101, and DenseNet-121 posted comparable scores for accuracy, precision, F1-score, and recall. Compared with the 89.6 MB footprint of DenseNet-121, ResNet-101, together with the other models, tip the scales more heavily. The investigators tapped deep learning to examine plant leaves for disease forecasting and spotting. Two cornerstone crops of Himachal Pradesh—tomato and potato—were selected as testbeds. Their methodology yielded a leaf-disease detection accuracy of 96.24% [23]. This article advances an AI-powered strategy for tomato disease diagnosis, aiming to build a real-time, precision-focused crop health assessment system. The paper leverages deep learning to anticipate illnesses driven by pathogens, pests, and dietary deficiencies. CNNs absorb patterns from expansive image collections of tomato leaves and fruits, comprising ShallowNet alongside leading-edge deep learning backbones (transfer learning models). In the experiments conducted, DenseNet turned in a solid showing, achieving 95.31% accuracy on the held-out test set. The evidence confirms that deep learning architectures characterized by modest parameter budgets, appropriate intricacy, and correctly tuned depth can raise performance [24]. [25] test their approach on PlantVillage, a challenging dataset featuring samples with severe brightness swings, color inconsistencies, and leaf captures spanning diverse sizes and outlines. They registered a stellar 99.98% accuracy mark on the dataset. They ran a battery of trials to establish that this technique for swift detection of tomato leaf complaints can enable growers to sidestep labor-intensive manual checks. The EfficientNet-MG CNN is scrutinized in this study. It fortifies the EfficientNet architecture by incorporating a multi-stage feature fusion (MSFF) technique alongside a Gaussian error linear unit (GELU) nonlinearity. Experimental results demonstrate that EfficientNet-MG outperforms five well-established CNN variants in ALD spotting, achieving 99.11% accuracy while keeping the parameter footprint trim (8.42 M) [26].The paper by [27] aims to broaden farmers’ awareness of modern technological interventions to prevent leaf-borne diseases. Diseased tomato leaf exemplars constitute the corpus for this exploration. Machine learning paradigms—particularly Support Vector Machine (SVM), Convolutional Neural Network (CNN), and K-Nearest Neighbor (K-NN)—are tasked with sorting the extracted descriptor sets. On disordered tomato instances, SVM (88%), K-NN (97%), and CNN (99.6%) are used to assess the fidelity of the proposed model.
The inquiry reported by [28] deploys VGG16 to separate damaged from healthy foliage across the stages of data collection, preprocessing, model conditioning, feature distillation, testing, and final categorization. Guided by the dataset, VGG16 combined with a regression-driven bounding-box procedure partitions leaves into sound or unsound categories. Accordingly, a Faster R-CNN-based architecture is designed to pinpoint and catalogue pathologies in every incoming tomato leaf snapshot, yielding sharper prognostic output. After 20 cycles of embedding the feature representations into the neural fabric, accuracy reached the 98% threshold. This paper dissects a single category of healthy tomato imagery from PlantVillage alongside nine possible afflictions that can affect such plants. In this evaluative overview, the lightweight CNN diagnostic module was benchmarked against standard identification metrics. The CNN-powered diagnostic apparatus developed in this study signals significant forward progress in diagnosing tomato leaf disorders. Gadgets of this nature stand poised to deliver rapid, pinpoint assessments of plant ailments, a boon for farmers in their day-to-day operations [29]. [30] rely on Brightness-Preserving Dynamic Fuzzy Histogram Equalization to enhance the visual appearance of apple leaves and on a bespoke extraction procedure to isolate unhealthy areas. Their scheme is validated against a living plant leaf database, where it achieves superior results compared to existing segmentation routines. The K-nearest neighbors classifier achieves a commendable accuracy of 96.4%. The empirical results reported by [31] indicate that the proposed model for leaf disease recognition yields mean precision, recall, and F1 Scores of 0.957, 0.958, and 0.957, respectively. The memory footprint is a trim 14.77 MB, with each frame processed in a brisk 25.84 ms. The end-to-end competence of the presented model eclipsed that of competing architectures. The framework outlined in this investigation is both remarkably effective and durable, providing technological muscle for the autonomous detection of apple leaf pathologies. The methodology espoused by [32] effectively separates diseased from uninfected apple leaves. Before recognition, the Otsu thresholding procedure, along with histogram equalization, is used for image preprocessing. Drawing on a segmented region corresponding to the affected tissue, a Multi-class SVM reliably identifies the disease variant from a set of 500 leaf images, achieving 96% accuracy. The infected area’s relative size within the apple leaf depiction is also shown. [33] present a deep learning-grounded pipeline to flag apple pathologies. The pipeline is purpose-built to efficiently and reliably identify the visual cues associated with such disorders and operates in two discrete phases. The opening phase consists of a custom, high-efficiency classification head that bins incoming captures into one of three possible states—diseased, healthy, or mechanically damaged. The second, termed the detection-oriented phase, comes into play only following a disease-positive outcome from the first step. The work by [34] and [35]leveraged AlexNet-derived convolutional backbones for five distinct ailments of apple tree leaves. The system distills coarse-grained pathological descriptors via dilated convolutions, preserving an extensive receptive field while reducing parameter count. Multi-scale disease signatures are gathered via parallel convolutional branches. The inclusion of 3×3 convolutional shortcut connections adds additional nonlinear capacity to the model.
Every aggregated output block applies an attention mechanism to heighten channel-wise feature alignment and dampen the performance penalty caused by cluttered backgrounds. In a final step, global pooling replaces the two fully connected layers, reducing the number of model parameters while preserving descriptive features. Recognition accuracy for the 5.87 MB model sits at 97.36%. XAI tools have found their way into a range of agricultural workflows, enhancing both interpretability and openness in decision-making. [33] evaluated three pretrained models against multiple performance metrics on a system designed to detect 38 leaf disorders across 14 botanical species. EfficientNetV2L came out on top, returning 99.63% accuracy. Beyond that, the framework wove in the XAI tool LIME to shed light on the forecasting rationale of EfficientNetV2L [36].
proposed a Convolutional Neural Network-based solution to pinpoint and distinguish various leaf maladies with both speed and accuracy. They subsequently turned to Deep Learning protocols to condition and probe an ensemble of apple leaf captures. Spanning a dataset of 5828 images, this study compares DenseNet with AlexNet. The evidence points to DenseNet being the stronger predictor of disease, yielding 98.17% correct classifications. The tomato pathology object detection pipeline described in this paper blends a prior-knowledge attention scheme with multi-scale representations. Initially, prior-information attention is called into play to intensify the diagnostic salience of visual attributes in tomato disease imagery. Next, a new feature fusion layer is added to the Neck to minimize representational attrition.
On top of that, a dedicated prediction layer is appended to sharpen the model’s grasp on smaller targets. Finally, an innovative loss formulation, A-SIOU (Adaptive Structured IoU), improves bounding box regression performance. Benchmarking on an internally compiled tomato disease dataset shows that the described methodology achieves a mean average precision (mAP) of 91.96%, which is 93.86% above the baseline pipelines [37]. The investigation by describes how a fusion of Feature Pyramid Networks (FPNs), ISResNet, and Faster RCNN lifts the detection of apple leaf disorders through deep feature propagation. The FPN-ISResNet-Faster RCNN model was tasked with identifying, examining, and validating these maladies. The FPN-ISResNet-Faster RCNN composite outranked SSD, VGG, GoogleNet, ResNet50, ResNeXt, and ISResNet-Faster RCNN on both average precision (AP) and its derived AP50 and AP75 figures. The FPN-ISResNet-Faster RCNN displayed faithful and generalizable detection capacity across apple leaf pathologies. Table 1 summarizes the methodologies for strength assessment currently available across diverse fields. (Figure 1).
Table 1. Comprehensive comparative analysis: strengths and weaknesses of current approaches in several domains.
Reference | Focused methods | Dataset | Challenges/Research gaps |
CNN | PlantVillage | Limited generalizability across diverse populations and imaging setups. | |
DenseNet-77 | PlantVillage | Need to address performance drop in images with large angular variations to enhance reliability and accuracy. | |
DenseNet & Classic 3D U-Net | – | Limited applicability in real-time scenarios or environments with constrained computational resources. | |
DenseNet201 | Tomato image dataset | Future research aims to tackle multi-class classification problems using additional pre-trained CNNs. | |
CNN | PlantVillage | Requires integration of environmental factors, thorough analysis, and adaptation of the model to ensure high-quality, comprehensive plant health diagnostics. | |
Lightweight CNN | PlantVillage | Development of a lightweight CNN tool for tomato leaf disease diagnosis on low-power embedded devices, considering disease impact on agricultural yield. | |
EfficientNetB7 & DenseNet | Apple leaf disease dataset | Seeks to replace labor-intensive, error-prone methods with efficient automated disease segmentation and diagnosis, thereby reducing global crop losses. | |
CNN | PlantVillage | Limited effectiveness in real-time use or resource-constrained environments. |
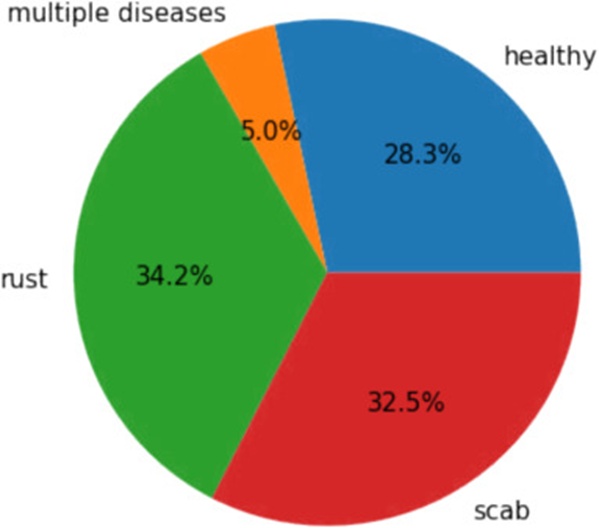
Figure 1. This pie chart shows the relative frequency of different plant problems and the distribution of diseases across the large PlantVillage dataset.
The performance gains achieved by our agricultural pathology detection framework stem from carefully orchestrated experimental protocols. This section lays out the foundational building blocks of our methodology, including the datasets we used, the preprocessing steps we applied, the architectural composition of our models, and the benchmarks we used to measure success.
Within the intersecting domains of deep learning and cultivation, three separate datasets were brought to bear on the task of measuring both the potency and the durability of our introduced model. Undertaking such a wide-ranging examination bolsters the model’s ability to extend its learnings to new contexts and to perform dependably across varying environments and farming scenarios.
By applying CycleGAN-based augmentation alongside supplementary refinements for apple malady prognostication, AL9EE was built on the foundation of the AppleLeaf9 [42] repository. AL9EE contains 26,755 depictions of diseased apple foliage. The data is partitioned across nine distinct designations: Alternaria leaf spot, Brown spot, Frogeye leaf spot, Grey spot, Health, Mosaic, Powdery mildew, Rust, and Scab.
The Tomato Leaf Disease Detection compilation brings together an expansive set of high-definition captures intended to enhance the surveillance of crop afflictions. Drawn from genuine tomato cultivation plots, the repository comprises numerous groupings, ranging from vigorous foliage to leaves compromised by various disorders, and qualified annotators have precisely tagged each entry. This collection (Kag) provides a pragmatic avenue for elevating farm yields and improving plant health governance, serving as an indispensable substrate for both training and rigorous testing of machine learning pipelines engineered to flag tomato leaf ailments at the earliest possible juncture accurately.
The PlantVillage dataset is a voluminous resource, housing images of ailing crop leaves paired with their diagnostic labels and encompassing 38 discrete categories and upwards of 56,000 individual samples. By tying each category to a specific plant pathology or condition, this exhaustive collection enables the creation and calibration of machine learning architectures that reliably recognize and categorize these illnesses from visual leaf data. The dataset holds substantial promise for advancing the detection and remediation of plant ailments, thereby reinforcing crop well-being and agricultural productivity. The pie chart labeled 1 provides a graphical breakdown of the distribution of plant afflictions across the expansive PlantVillage corpus. It shows that Rust commands the largest share, accounting for 34.2% of the instances.
Meanwhile, healthy specimens represent a significant segment at 28.3%, and scab accounts for a comparably sized 32.5%. The remaining 5% corresponds to cases manifesting more than one disease simultaneously, representing a smaller, though not negligible, subset. The chart cogently illustrates the relative frequency of various plant maladies, providing useful insights into the data set’s internal composition.
The body of data mobilized for this inquiry plays a pivotal role in our investigation, providing the substrate upon which our disease detection architecture is both erected and validated. The aggregate dataset knits together three separate components: Apple Leaf9, Tomato Leaf, and PlantVillage. Each component collection is partitioned into training, validation, and test sets to ensure the model is properly conditioned and unbiasedly assessed. To begin the process, 80% of the data was allocated to the training partition. Within each training subset, 90% of the material was used for actual parameter updates, while the remaining 10% was reserved to monitor the model’s behavior as training progressed. Resorting to this strategy helps prevent the model from latching onto idiosyncratic patterns in the training corpus, a pitfall commonly known as overfitting. A further segment, equivalent to 20% of the full dataset, was reserved for validation. This untouched portion was used to assess the model’s performance and to perform hyperparameter tuning in a manner isolated from the training process. Such an allotment assured that the model was furnished with a copious quantity of examples from which to extract patterns. As itemized in Table 2, the Apple Leaf9 compilation splits into 23,544 training exemplars, 5351 validation exemplars, and 2140 testing exemplars. The Tomato Leaf dataset consists of 7200 training instances, 2000 validation instances, and 800 test instances. The PlantVillage corpus is split into three groups: a training bloc containing 49,280 instances, a validation bloc containing 11,200 instances, and a testing bloc containing 4,480 instances. Providing granular enumeration details for each classification and split safeguards the validity of the model assessment process, enhancing the overall performance and reliability of our plant pathology detection system and thereby making it a valuable asset in the field of image-driven agricultural analytics.
Table 2. This table provides an exhaustive breakdown of the dataset, detailing how it was split into training, test, and validation sets and offering a granular count of the distinct categories it contains.
Dataset | Class | Training set | Validation set | Testing set |
Apple Leaf9 | 9 | 23,544 | 5351 | 2140 |
Tomato Leaf | 10 | 7200 | 2000 | 800 |
PlantVillage | 38 | 49,280 | 11,200 | 4480 |
The preparatory phase of the data draws upon a designated TensorFlow utility class. Once the raw visual data was split into 80% for training and 20% for validation, augmentation procedures were initiated. The training images undergo a battery of transformations—rotation, translation, shearing, zooming, and mirroring—while their pixel intensities are concurrently rescaled to the [0,1] range. The validation and test pools are subjected solely to pixel-intensity normalization. The preprocessing workflow entails trimming each picture, as illustrated in Figure 2, to a consistent bounding box of 300 × 300 pixels. Following this, a learning-based resizing module is used to telescope the images shown in Figure 3 to a compact footprint of 150 × 150 pixels. This dimensionality reduction step both condenses the data and prepares it for streamlined digestion by the neural fabric, thereby improving the model’s overall performance. The data generation utilities assemble large numbers of augmented and normalized images on the fly. While the training generator encodes class labels as one-hot categorical vectors, both the validation and test generators mirror this configuration without shuffling the sample order. Such a setup enables efficient, just-in-time preprocessing throughout both the training cycle and the subsequent assessment phase. By exposing the model to synthetic variations of the input imagery via augmentation, its capacity to generalize is sharpened, and its accuracy on novel, unseen samples is boosted. Constraining pixel magnitudes to the prescribed interval guarantees that the network’s computations stay within well-behaved numerical bounds. Taken as a whole, these purposeful measures facilitate superior model conditioning and validation, all aimed at dependable disease classification.
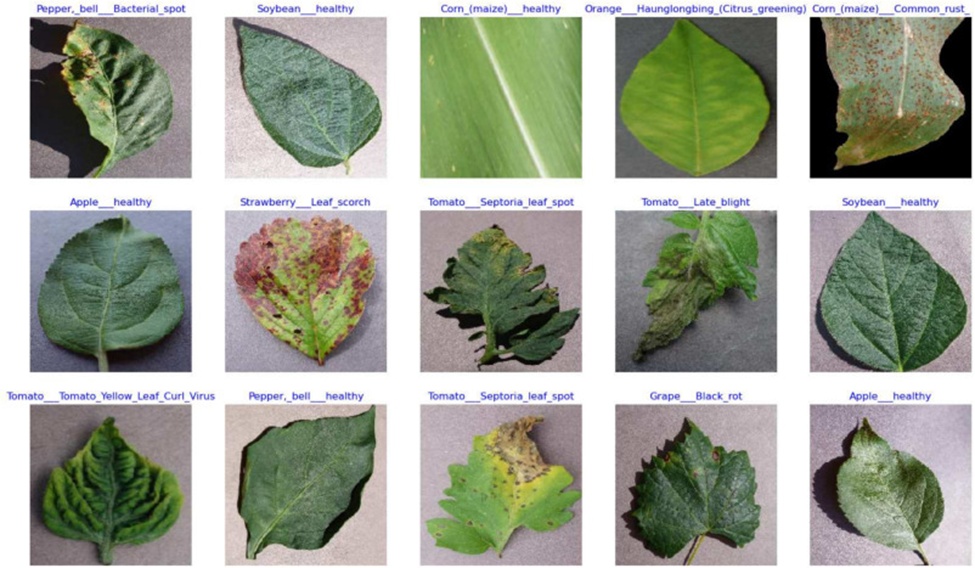
Figure 2. This figure presents a set of exemplary input photographs, each offering an insightful view of the dataset’s content from a different angle. These photos provide context for the rich visual data under investigation and serve as the basis for the further analysis and insights offered in this work.
The structural design of the proposed learning resizer, as shown in Figure 4, is characterized by two signature attributes: bilinear feature interpolation and the integration of a skip conduit. Bilinear feature interpolation equips the model to ingest representations computed at the source resolution, thereby increasing its versatility when handling a spectrum of incoming dimensions and aspect ratios. The built-in skip conduit reduces the learning burden by forwarding the bilinearly interpolated image directly to the downstream objective task. This design choice diverges from standard encoder-decoder paradigms by offering considerable freedom to rescale images into any desired target dimensions and proportions. It is also worth noting that the choice of bilinear interpolation is far from obligatory; the design readily admits the substitution of other resampling filters, such as bicubic interpolation or a Lanczos kernel. Drawing inspiration from prior art, residual blocks are embedded throughout the model’s internal wiring. The architecture permits a variable tally of these blocks (r = 1 or 2) and incorporates convolutional layers outfitted with 16 kernels, each spanning 3 × 3. Batch normalization operations and LeakyReLU activation functions, set with a negative slope parameter of 0.2, appear uniformly throughout the construction. Of particular note, the resizer punches well above its weight class, maintaining a decidedly lightweight profile and adding only a trivial handful of learnable parameters to the core task, especially when contrasted with substantially more cumbersome alternatives.
 (1)
(1)
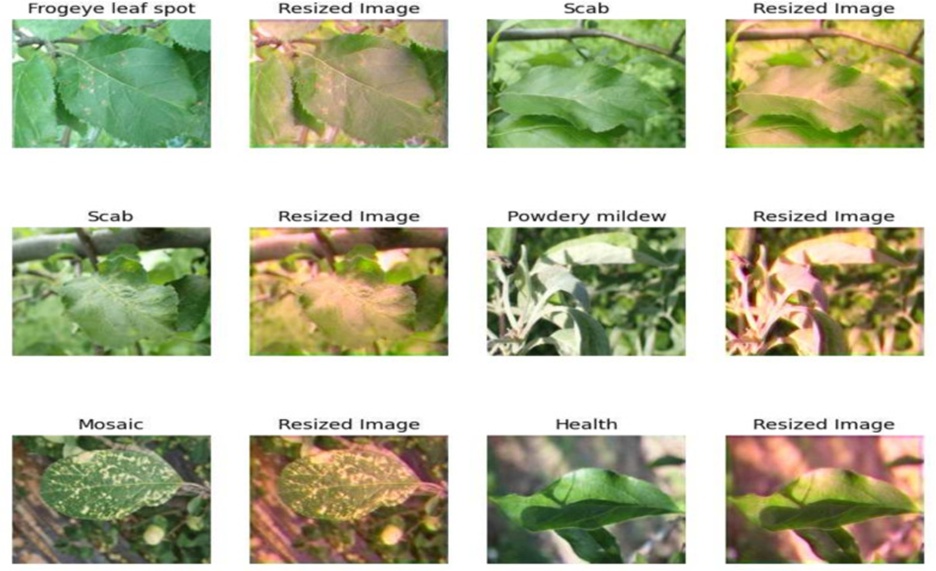
Figure 3. This depiction lays bare the transformational impact of rescaling on pictorial content by placing the original capture (on the left) next to its downsized counterpart (on the right).
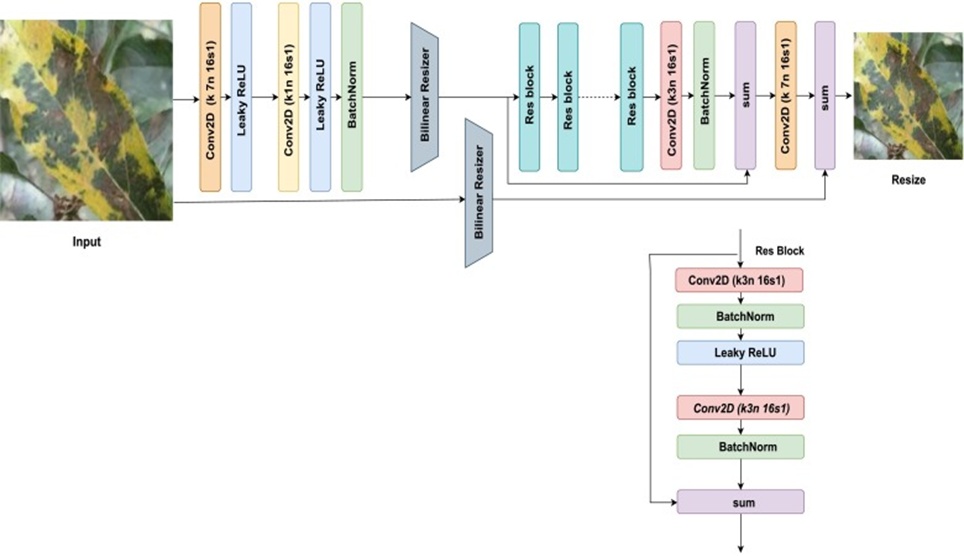
Figure 4. This diagram captures the essence of a Learning Resizer, a technologically advanced module that dynamically calibrates and redistributes resources across a complex processing pipeline.
The mathematical expression given encapsulates the operating logic behind a learning-based resizing module. At the outset, the source image x is scaled to match the designated target output dimensions, an essential preparatory step before further computation can proceed. This dimensionally adjusted version, referred to as z, is subsequently fused with the original input x through element-wise addition. Blending the size-altered and untouched images in this manner preserves key structural details from the original signal throughout the spatial transformation. The resultant composite representation is then subjected to another resizing pass to snap it back to the stipulated target dimensions. This two-stage resizing regimen, augmented by skip connections, ensures the preservation and meaningful assimilation of diagnostically relevant features in the final resampled output. In the final step, the intermediate quantity z is added to the terminal resized image y, thereby cementing the net contribution of the resizing sequence.
As illustrated in Figure 5, the DenseNetMini blueprint is a streamlined yet powerful deep neural network tailored for computer vision workloads, accepting inputs of 150 × 150 pixels. It comprises four dense blocks, each containing multiple convolutional strata densely interconnected to aid feature extraction and representation. The opening dense block contains six tiers, subsequently followed by dense blocks comprising 12, 16, and 8 tiers, respectively. Once these dense blocks have done their work, the accumulated feature maps are fed into a 7 × 7 convolutional layer and then passed to a 3 × 3 max-pooling layer, which compresses the spatial footprint. A supplementary 7 × 7 convolutional layer further polishes the extracted features, while transition layers interspersed between the dense blocks keep the parameter count in check. A fully connected layer is used for classification or analogous downstream tasks, and the terminal output layer is customized to the specific use case.
 (2)
(2)
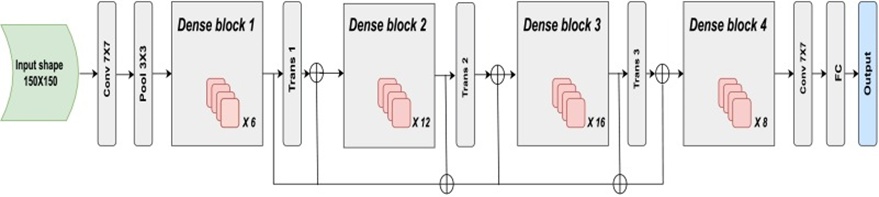
Figure 5. This illustration outlines the cutting-edge design of DenseNetMini, representing a significant leap in the deep learning landscape. With a unique architectural design optimized for performance, operational efficiency, and flexibility across a range of tasks, the DenseNetMini framework reflects ongoing progress in neural network research. The graphical portrayal offers a window into the inner workings of this advanced model, hinting at compelling future directions within the domain of artificial intelligence.
The design incorporates a 7 × 7 convolutional layer that handles features emerging from the upstream dense blocks. This layer sweeps 7 × 7 kernels across the feature maps, performing spatial computations that latch onto high-order patterns and representations embedded in the incoming data. Convolutional layers play an indispensable role in feature extraction in deep neural architectures, enabling the network to acquire hierarchical representations from the raw input progressively.

After the 7 × 7 convolutional layer, a 3 × 3 max-pooling operation is applied. Max pooling functions as a downsampling mechanism that contracts the spatial extent of feature maps while preserving the most critical information. During this operation, a movable 3 × 3 window scans across the feature maps and, at each placement, picks out the maximum value found within that window. The effect is a deliberate coarsening of spatial granularity, which helps the network zero in on the most salient cues while simultaneously tempering the computational burden.
As depicted in Figure 6, the ensemble framework combines purposefully engineered components to maximize both feature extraction and architectural adaptability. Bilinear feature scaling is applied to the incoming data so that representations computed at the native resolution can be effortlessly woven into downstream processing. This dimensionally adjusted data is then routed into our learning resizer (A), which competently recalibrates image dimensions and leverages skip connections to quicken the learning trajectory, facilitating a direct handoff to the core objective. Upon completion of the resizing step, the data passes through DenseNetMini (B), a compact yet highly capable neural network for feature extraction. Following this stage, a gradient product optimizer (C) is applied, incorporating tensor-based gradient product (D) operations to improve accuracy and reduce training time, yielding a well-balanced, resource-efficient model suited for disease detection. The ensemble pipeline concludes by producing the intended output. This architectural formulation is equipped to accommodate imagery of assorted dimensions and aspect ratios and remains compatible with alternative scaling techniques. Owing to judicious design choices, the model maintains a lightweight character, ensuring that only a modest set of trainable parameters is appended to the baseline function, thereby positioning it as a powerful yet resource-conscious option for computer vision applications.
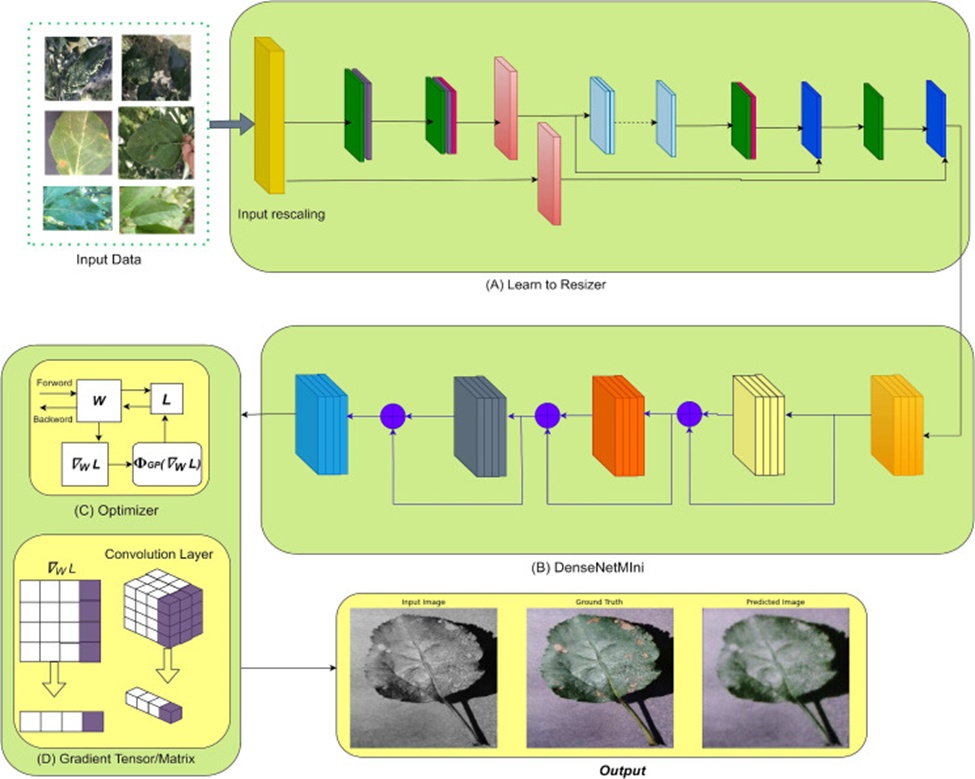
Figure 6. The figure presents our novel ensemble methodology, developed through extensive investigation and inventive thinking. The figure lays bare both the ensemble’s foundational components and the intricate interplay among the individual models that collectively form it. Delivering a workable answer to a broad spectrum of intricate challenges, our proposed ensemble approach bears witness to the enduring pursuit of enhanced performance in data science.
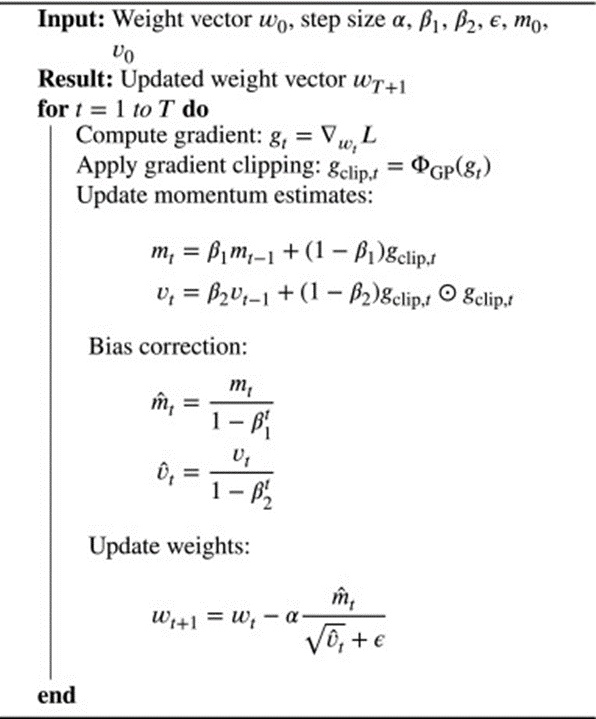
The behavior of the GP-enhanced Adam algorithm is shaped by the specific demands of the deep learning task at hand, making it a viable alternative to the standard Adam optimizer. Our introduced gradient product optimizer outperformed the energy-modeled Adam optimizer proposed by [43]. The algorithm harnesses the gradient product rule to condition gradients before calculating moving averages, aiming to improve convergence in deep learning settings. Furthermore, adopting this procedure reduces the time spent on computational steps while sharpening the accuracy of the outcomes. These properties make it a highly beneficial choice for guiding neural network optimization.
Adam optimizer algorithm.
 (3)
(3)
Given a convolutional layer, suppose the gradient has been obtained through backpropagation. Then, for a weight vector Wi whose gradient is ∇WiL (i = 1, 2, …, N), the GP operator is signified by ΦGP.
∏∇(WiL) denotes the product of gradients. Since only the product of the column vectors composing the weight matrix needs to be computed, after which the product is subtracted from each column vector, a matrix-based representation of Eq. 3 can also be formulated.
Algorithm 1 combines Gaussian Processes (GP) with the widely used Adam optimization scheme and incorporates weight decay. The procedure begins by initializing a weight vector w0. It also requires specifying hyperparameters, including the step size α, the exponential decay factors β1 and β2 governing moment estimates, a small constant ϵ for numerical stability, and the initial moment estimate vectors m0 and v0.
Table 3 provides a comparative summary of the deep learning architectures deployed in the study, focusing on their storage footprint and trainable parameter count. These indicators are pivotal for gauging the memory requirements and computational throughput of the models. As the table makes plain, conventional architectures such as VGG16 and VGG19 pack a hefty number of parameters—138.8M and 143.7M, respectively—and their storage sizes exceed 500 MB. By contrast, ResNet50, ResNet101, and ResNet152 emerge as more storage-friendly alternatives, thanks to their slimmer proportions and relatively modest parameter tallies. The InceptionV3 and DenseNet variants likewise display moderate storage sizes and parameter volumes. Standing out for its striking economy and compact footprint, the proposed ensemble model carries just 4M parameters and occupies the smallest footprint at 16MB, a trait that proves particularly advantageous in resource-constrained agricultural deployments. A summary of our model is also presented in Table 4, where the specifics of our introduced ensemble architecture are catalogued.
Table 3. This table provides detailed, side-by-side comparisons across multiple models, highlighting key metrics such as parameter count and model size. The data compiled here aid in appraising and selecting suitable models for specific computational assignments by shedding light on the intricacies underlying model design.
Model | Params(Million) | Size(MB) |
VGG16 | 138.8 M | 528 |
VGG19 | 143.7 M | 549 |
ResNet50 | 25.6 M | 98 |
ResNet101 | 44.7 M | 171 |
ResNet152 | 31.1 M | 232 |
InceptionV3 | 23.9 M | 92 |
DenseNet121 | 8.1 M | 33 |
DenseNet169 | 14.3 M | 57 |
DenseNet201 | 20.2 M | 80 |
Ensemble proposed model | 4 M | 16 |
Table 4. This table supplies an itemized view of the architectural components and technical specifications that define our model.
Layer (Type) | Output Shape | Parameters |
input (InputLayer) | [(None, 300, 300, 3)] | 0 |
rescaling (Rescaling) | (None, 300, 300, 3) | 0 |
resizer (Functional) | (None, 150, 150, 3) | 12,163 |
DenseNetMini (Functional) | (None, 10) | 4,225,226 |
The investigation probed a range of hyperparameters, catalogued in Table 5, alongside their influence on the behavior of deep learning architectures. These hyperparameters were systematically explored within predefined search spaces to pinpoint the most effective model setups and tuning approaches for the various experimental configurations. The choice of hyperparameter values exerts a decisive effect on model outcomes. Among the hyperparameters examined were the selection of the foundational architecture (VGG16 or DenseNet201), batch dimensions (8, 16, 32, 64, or 128), the type of optimization algorithm (SGD, Adam, RMSprop, Nadam, Adamax, Adaw), the form of loss function (Categorical cross-entropy and Kullback-Leibler divergence), kernel dimensions (3 × 3, 5 × 5, 7 × 7), learning rate values (spanning from 0.1 down to 0.00001), and dropout fractions (0.1, 0.2, 0.3, 0.5).
Table 5. This table provides a concise yet comprehensive account of the methodical exploration of hyperparameter settings for each experimental model. The findings reflect the meticulous effort invested in tailoring the network structures to secure the highest attainable performance, underscoring our commitment to advancing the frontiers of data science and machine learning.
Hyperparameter | Search/Optimization space |
Model | [VGG16, VGG19, ResNet50, ResNet101, ResNet152, InceptionV3, DenseNet121, DenseNet169, DenseNet201] |
Batch size | [8, 16, 32, 64, 128] |
Optimizer | [SGD, Adam, RMSprop, Nadam, Adamax, Adaw] |
Loss Function | [Categorical Cross-Entropy, Kullback–Leibler Divergence] |
Kernel Size | [3 × 3, 5 × 5, 7 × 7] |
Learning Rate | [0.1, 0.001, 0.0001, 0.00001, 0.002] |
Dropout Rate | [0.1, 0.2, 0.3, 0.5] |
The hyperparameter values were deliberately chosen to align with the distinct characteristics of each agricultural dataset, reflecting a targeted strategy to boost disease detection capability. For the Apple dataset, the following configuration was adopted: the Adam optimizer with a learning rate of 0.0001, a batch size of 16, a kernel size of 5 × 5, and a dropout rate of 0.2. The Categorical Cross-Entropy loss function was also utilized. For the Tomato dataset, the Nadam optimizer was used, with a learning rate of 0.001, a batch size of 8, a kernel size of 3 × 3, and a dropout rate of 0.1. The model continued to rely on the Categorical Cross-Entropy loss function. The PlantVillage dataset was tuned using the Adam optimizer set to a learning rate of 0.00001. This model also used a batch size of 32, a kernel size of 3 × 3, and a dropout rate of 0.5, while the Categorical Cross-Entropy loss function remained in place.
The hyperparameter settings were meticulously chosen and iteratively refined through extensive analysis and adjustment. The overarching aim was to improve model performance and predictive accuracy while accommodating the unique attributes and inherent challenges of each agricultural dataset.
This segment provides an in-depth examination of the experimental results from rigorous testing and benchmarking of deep learning architectures for disease detection in agricultural environments.
Leveraging the PlantVillage corpus and focusing on disease identification in farming contexts, multiple deep learning architectures were trained for 20 epochs and assessed, with the findings tabulated in Table 6. VGG16 achieved a respectable 96.07% accuracy, closely trailed by VGG19 at 96.88%. ResNet50 turned in an exceptional accuracy figure of 99.62%, while ResNet101 and ResNet152 recorded equally noteworthy accuracies of 99.56% and 99.23%, respectively. ResNet50 achieved the highest accuracy among the ResNet family at 99.62%. InceptionV3 likewise demonstrated impressive results, attaining an accuracy of 99.46%. The DenseNet variants—DenseNet121 at 98.07%, DenseNet169 at 99.45%, and DenseNet201 at 99.51%—yielded results on par with those of the other architectures. By contrast, the introduced ensemble model outperformed all competitors, achieving a striking accuracy of 99.83%. Beyond achieving peak accuracy, this ensemble construct also demonstrated efficient time complexity, enabling it to surpass every standalone model and cementing its status as the premier choice for disease identification in agricultural settings.
Table 6. This table presents a consolidated view of training and validation accuracy over 20 epochs for the PlantVillage dataset, along with an appraisal of temporal complexity. The figures here illuminate the nuanced interplay between computational efficiency and model performance, offering a holistic assessment of the model’s learning trajectory across the designated training window.
Model | Training time | Valid_Accuracy | Train_Accuracy |
VGG16 | 11,299 | 94.29% | 96.07% |
VGG19 | 11,374 | 95.68% | 96.88% |
ResNet50 | 9434 | 95.87% | 99.62% |
ResNet101 | 15,074 | 99.01% | 99.56% |
ResNet152 | 16,240 | 98.10% | 99.23% |
InceptionV3 | 7377 | 94.83% | 99.46% |
DenseNet121 | 9733 | 97.23% | 98.07% |
DenseNet169 | 13,343 | 97.64% | 99.45% |
DenseNet201 | 14,023 | 97.92% | 99.51% |
Ensemble proposed model | 6138 | 99.44% | 99.83% |
A granular assessment of deep learning architectures was undertaken after 20 training epochs within the scope of tomato disease classification, using the Tomato dataset as shown in Table 7. The objective was to ascertain how well each model performed. VGG16 and VGG19 both achieved 68.72% accuracy, with VGG16 achieving 56.09% validation accuracy and VGG19 58.73%. In a standout performance, ResNet50 achieved 98.73% accuracy and 91.00% validation accuracy. Both ResNet101 and ResNet152 achieved strong results, with accuracies of 97.86% and 98.11%, respectively, and validation accuracies of 96.33% and 96.83%, respectively. InceptionV3 delivered an inspiring performance, achieving 98.59% accuracy and 93.97% validation accuracy. DenseNet models spanned a range of competitive accuracies—DenseNet121, DenseNet169, and DenseNet201 all fell between 98.66% and 99.08%. Yet the proposed ensemble model distinguished itself from the pack, clinching the highest accuracy among all evaluated models at 99.17%, complemented by a stellar validation accuracy of 98.57%. Furthermore, it maintained a comparatively modest time complexity of 4702, placing it ahead of all individual models and confirming it as the most effective solution for tomato disease classification.
Table 7. This table lays out in detail the training and validation accuracies and the corresponding time complexities for the classification of tomato leaf disorders across a 20-epoch training schedule. It captures the intricate balance between model performance and computational cost, providing a thorough view of the learning process over this training interval.
Model | Time complexity | Valid_Accuracy | Train_Accuracy |
VGG16 | 5332 | 56.09% | 68.72% |
VGG19 | 5742 | 58.73% | 68.07% |
ResNet50 | 5257 | 91.00% | 98.73% |
ResNet101 | 5774 | 96.33% | 97.86% |
ResNet152 | 6479 | 96.83% | 98.11% |
InceptionV3 | 5138 | 93.97% | 98.59% |
DenseNet121 | 5482 | 95.47% | 98.87% |
DenseNet169 | 5609 | 95.03% | 98.66% |
DenseNet201 | 6012 | 96.48% | 99.08% |
Ensemble proposed model | 4702 | 98.57% | 99.17% |
A wide-ranging appraisal of deep learning architectures was conducted after 20 training epochs to classify apple pathologies using the Apple dataset, as documented in Table 8. This evaluation unfolded within the framework of the Apple dataset. Notably, VGG16 and VGG19 achieved accuracy rates of 78.83% and 76.74%, respectively, along with validation accuracies of 53.47% and 56.92%, respectively. ResNet50 achieved excellent performance, achieving 98.54% accuracy and 62.18% validation accuracy. ResNet101 and ResNet152 achieved remarkable results, with accuracies of 99.03% and 98.10% and validation accuracies of 95.84% and 94.49%, respectively. InceptionV3 performed robustly, achieving 98.18% accuracy and 94.26% validation accuracy. The DenseNet family exhibited a range of competitive accuracies—DenseNet121, DenseNet169, and DenseNet201 ranging from 98.65% to 99.30%. Nonetheless, the proposed ensemble model surpassed all competitors, achieving the highest accuracy across the board at 99.85% and a notable validation accuracy of 97.35%. Additionally, it demonstrated an impressively low time complexity figure of 4948, enabling it to outperform every standalone model and establish itself as the superior solution for apple disease classification.
Table 8. This table charts the progression of training accuracy, validation accuracy, and the associated temporal complexity over a 20-epoch training regimen for apple leaf disease classification. It vividly portrays the dynamic relationship between computational demands and model performance, furnishing a deep exploration of the learning process across this specified training duration.
Model | Time complexity | Valid_Accuracy | Train_Accuracy |
VGG16 | 6858 | 53.47% | 78.83% |
VGG19 | 6976 | 56.92% | 76.74% |
ResNet50 | 5633 | 62.18% | 98.54% |
ResNet101 | 7591 | 95.84% | 99.03% |
ResNet152 | 7809 | 94.49% | 98.10% |
InceptionV3 | 6357 | 94.26% | 98.18% |
DenseNet121 | 5996 | 95.72% | 99.30% |
DenseNet169 | 6875 | 95.95% | 98.65% |
DenseNet201 | 6521 | 93.98% | 98.87% |
Ensemble proposed model | 4948 | 97.35% | 99.85% |
The trajectories tracking training accuracy, validation accuracy, training loss, and validation loss across the PlantVillage, tomato, and apple leaf collections are portrayed in Figures 7-9, respectively. Table 9 provides a graphical depiction of how the proposed ensemble architecture performed classification-wise across three agrarian repositories—PlantVillage, Tomato leaf, and Apple leaf9—rendered as percentages. Despite operating without gradient-based optimization, the framework still achieved a very respectable level of correctness. In numerical terms, it achieved training and validation accuracies of 99.36% and 99.00%, respectively, on the PlantVillage dataset. When evaluated on the Tomato leaf corpus, training accuracy reached 99.03% and validation accuracy 97.12%. Turning to the Apple leaf9 body of data, training accuracy and validation accuracy settled at 95.30% and 95.10%, respectively. Yet the time spent on the training procedure proved substantial. Shifting to gradient centralization yielded higher computational throughput while maintaining a strong precision profile, as evidenced by recorded figures of 99.57% for PlantVillage, 98.23% for Tomato leaf, and 97.76% for Apple leaf9. The most eye-catching showing, however, stemmed from the deployment of gradient product optimization, which conferred extraordinarily high accuracy values. To be precise, training accuracies of 99.83% on PlantVillage, 99.17% on Tomato leaf, and 99.85% on Apple leaf9 were achieved. In parallel, the PlantVillage, Tomato Leaf, and Appleleaf9 collections yielded test accuracy rates of 99.65%, 99.79%, and 98.11%, respectively.
Most importantly, this identical strategy dramatically compressed the training time, yielding time complexity scores of 6138 for PlantVillage, 4702 for Tomato leaf, and a striking 4948 for Apple leaf9. The collected evidence highlights the significant impact that gradient-centric optimization regimens can have on both prediction fidelity and resource efficiency, underscoring their tangible value in crop disease surveillance. Our empirical findings foreground the pronounced influence that gradient-refinement techniques exert over model precision and computational frugality. In turn, this body of work underscores the practical benefits of such approaches for pinpointing agricultural maladies. Figure 10 demonstrates the discriminative power of a leaf disease prognostication apparatus, highlighting the advanced procedural mechanisms used to generate stable, trustworthy readouts for plant wellness oversight.
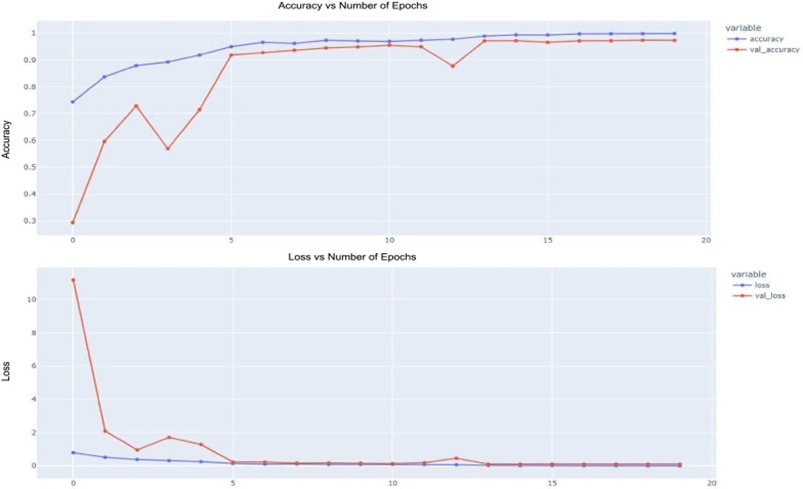
Figure 7. This panel presents a layered view of model dynamics and learning progression in the context of apple leaf disease sorting, graphically showing how training and validation accuracy and loss evolve over the learning phase.
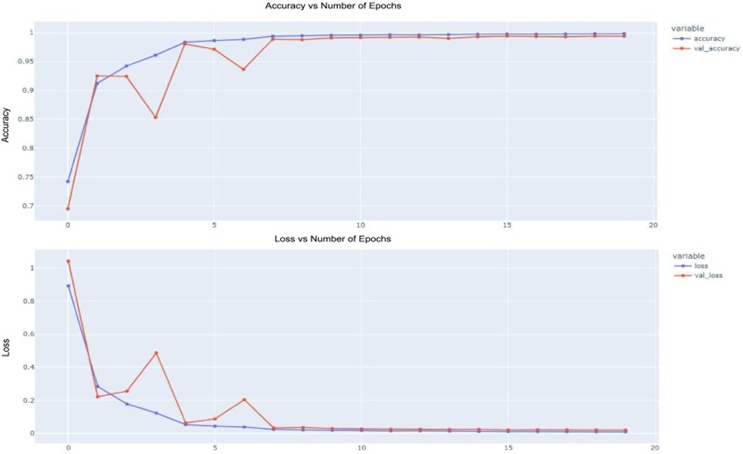
Figure 8. An all-around summary of model behavior on the PlantVillage corpus is presented here, including the accuracy curve alongside training and validation accuracy, as well as training and validation loss. The panel delineates the model’s learning odyssey, clarifying how accuracy and error trajectories evolve during the conditioning phase.
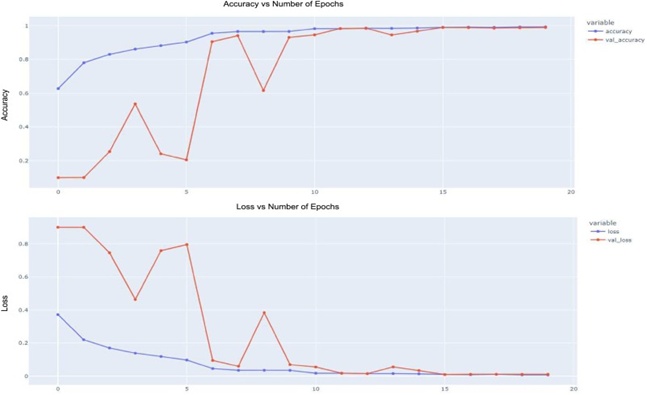
Figure 9. A digest of the model’s competence at distinguishing tomato leaf disorders is relayed in this figure. The accuracy curve, training and validation accuracy, and training and validation loss are all plotted, providing a clear window into the model’s learning trajectory and its ability to classify tomato leaf pathologies.
Table 9. This entry distills a thoroughgoing assessment of the model’s proficiency at categorization and discrimination, highlighting the perceptual scrutiny of its operational output vis-à-vis the target classification problem.
Model | AppleLeaf9 | Tomato leaf disease | PlantVillage | ||||||
Train Acc. | Val. Acc. | Time | Train Acc. | Val. Acc. | Time | Train Acc. | Val. Acc. | Time | |
Ensemble without gradient | 95.30% | 95.10% | 5872 | 99.03% | 97.12% | 4935 | 99.36% | 99.00% | 8734 |
Ensemble gradient centralize | 97.76% | 97.07% | 5471 | 98.23% | 97.77% | 4756 | 99.57% | 98.21% | 6576 |
Ensemble gradient product | 99.85% | 97.30% | 4948 | 99.17% | 98.57% | 4702 | 99.83% | 99.44% | 6138 |
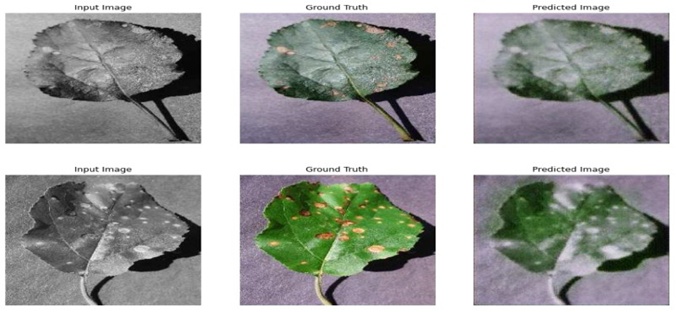
Figure 10. This caption captures the methodical scrutiny and precision of a leaf disease prediction engine, highlighting the sophisticated analytical routines and processing pipelines that are marshaled to generate conclusions that one can rely on in plant health monitoring.
A stringent side-by-side appraisal of our ensemble construct against earlier scholarly contributions is undertaken. The evaluation unfolds across three tables—Tables 10-12—each reporting accuracy levels achieved on a different data pool. Apart from the AppleLeaf9 compilation, the PlantVillage and Tomato Leaf repositories are likewise enlisted for comparative testing against prior art. The tabulations reveal exactly how substantially our ensemble model surpasses alternative pipelines when assessed on these datasets. The figures obtained attest to both the potency of our model and its role in plant health assessment, whether for flagging diseases across diverse foliage types or for other diagnostic applications in phytosanitary evaluation.
Table 10. This tabulation presents a systematic, detailed head-to-head comparison of our original apple leaf disease detection methodology with those documented in the literature, teasing out the comparative merits and shortcomings of each. The comparison spans multiple features and performance metrics, charting the advances and the novel value our solution introduces to plant health diagnostics.
Reference | Focused methods | Dataset | Accuracy |
ensemble of pre-trained DenseNet121, EfficientNetB7, and EfficientNet NoisyStudent | images of apple leaves | 96.25% | |
DenseNet-121 | Apple leaf image dataset | 93.71% | |
EfficientNetB7 & DenseNet | Apple Leaf Disease Dataset | 99.8% 99.75% | |
CNN | Apple leaf images from PlantVillage | 98.54% | |
CA-ENet | ALDID | 98.92% | |
Our proposed model | Our Ensemble model | AppleLeaf9 | 99.85% |
Table 11. This tabulation provides a granular comparison between the operational methodologies reported to date and our newly conceived approach, which was purpose-engineered for the PlantVillage repository. The analysis spans a broad suite of evaluation metrics, characteristics, and functional capabilities, highlighting the meaningful innovations and unique contributions our proposed system makes to plant disease identification and ecologically sound farming.
Reference | Focused methods | Dataset | Accuracy |
CNN | plantvillage | 98% | |
ResNet-50 | NA | 92.61% | |
CNN | plantVillage | 95.31% | |
Lightweight CNN | plantVillage | 99.04% | |
CNN | PlantVillage | 99.17% | |
Our proposed model | Ensemble model | plantVillage | 99.65% |
Table 12. This tabulation presents a deep and exacting comparison of our trailblazing tomato leaf disease detection pipeline against established alternatives. The appraisal spans a wide range of performance metrics, operational features, and capacities, offering perspective on the substantial leaps forward and singular contributions our proposed framework brings to the practice of agricultural pathology diagnosis and crop welfare stewardship.
Reference | Focused methods | Dataset | Accuracy |
Transfer Learning | Self collected | 95.65% | |
Transfer Learning | Self collected | 97.10% | |
R-CNN | Tomato leaf images are a subset of the PlantVillage | 98.0% | |
AlexNet | Tomato leaf images from the PlantVillage dataset | 97.22% | |
LeNet | Self collected | 95% | |
EfficientNetB5 | tomato leaf disease (TLD) dataset | 99.07% | |
Our proposed model | Ensemble model | Tomato leaf diseases | 99.17% |
Occlusion-centric investigative paradigms tend to consume both substantial time and computational power. As a consequence, an alternative methodology is sorely needed for gauging the differential significance of various pictorial regions. One commonly used analytical tool is the saliency map, which computes a per-pixel relevance measure by performing a single forward and a single backward traversal through the network architecture [54]. Occlusion-based studies numerically approximate the saliency map matrix by perturbing individual pixels and recording the consequent fluctuations in the output signal. In Figure 11, saliency maps prove markedly less computationally intensive than the thermal maps generated during occlusion experimentation, since discrete gradient estimation requires repeatedly altering individual pixels or patches. To compute the gradient in closed form, a single backward pass is sufficient to determine the partial derivatives for every pixel in the image. In a manner comparable to occlusion experiments, saliency maps offer practical utility by helping human observers recognize disease indicators. Since this technique analytically determines each pixel’s contribution rather than relying on sequential masking, it remains stable even when diagnostically significant regions are non-contiguous. The saliency map is derived by pushing the input image x forward through the network to produce the output f(x). Subsequently, a backward pass evaluates the gradient of f(x)y with respect to the input image x, where y stands for the ground truth category. The resulting gradient G(x) is constructed via a formulation that assigns an importance value to each pixel in the image x. This gradient tensor G(x) inherits the same dimensional layout as the source picture x. If x is characterized by a width W, a height H, and three spectral channels, G(x) materializes as a tensor of shape 3×W×H, addressed by the indices i for the channel axis and j,k for the spatial pixel coordinates.
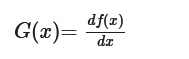
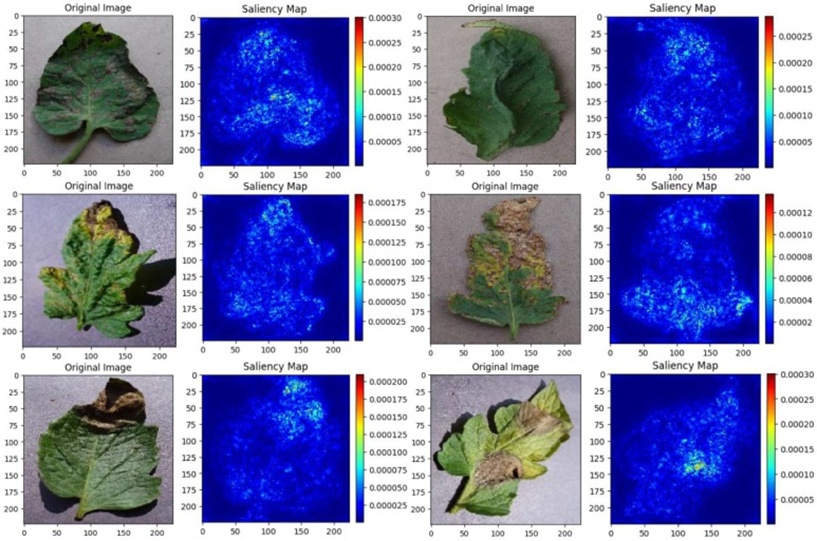
Figure 11. A saliency map, functioning as a high-impact interpretability device, is exhibited within this figure, which renders plainly visible the zones and attributes of greatest consequence inside a diseased leaf depiction. This refined form of scrutiny enriches our understanding of the image’s core properties and helps pinpoint decisive visual signatures for pathological diagnosis.
As depicted in Figure 12, Grad-CAM (Gradient-weighted Class Activation Mapping) carries considerable promise within our proposed ensemble framework for agricultural disease identification. The incorporation of Grad-CAM enhances the model’s transparency and explainability, enabling a richer understanding of the reasoning that underpins its predictions. When pinpointing diagnostically relevant zones in an input image, the ensemble construct leverages Grad-CAM to generate visual heatmaps that highlight these salient areas. This methodology empowers agronomic experts to precisely identify which components of a photograph influenced the model’s output. Such a capability is profoundly consequential in farming environments, as it supports the exact localization of specific portions of a plant or crop that may be under disease stress. Beyond this, employing Grad-CAM helps surface latent biases embedded in the training corpus that the model may have internalized, thereby aiding dataset refinement. The approach also yields important clues about which individual neurons within the network play a pivotal role in disease-linked decision-making. The degree of clarity demonstrated here is immensely valuable for fostering trust in AI pipelines and for enabling productive synergistic work between human domain experts and these computational systems toward the shared goals of bolstering crop vitality and agricultural output.
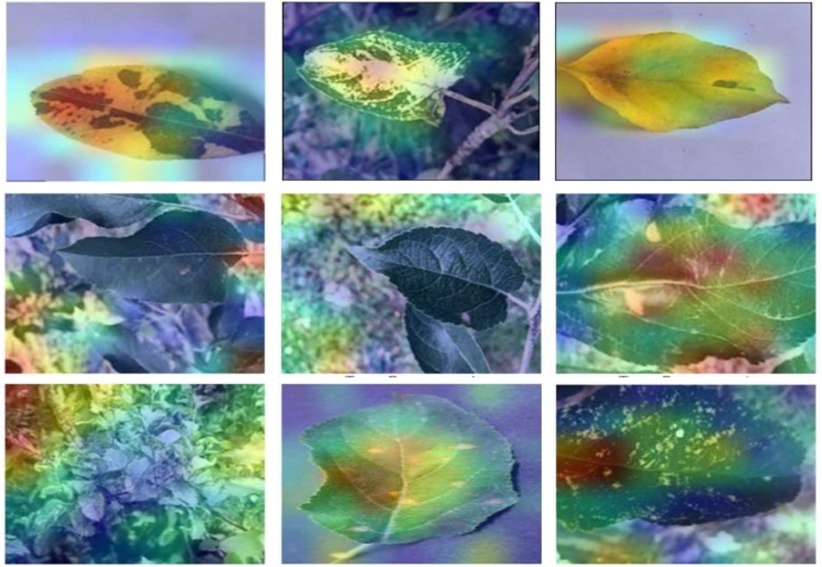
Figure 12. Within this illustration, we bring Grad-CAM to bear to shed light on the critical spatial zones and attributes inside a leaf disease depiction. Grad-CAM provides a refined means to understand where the neural network directs its attention and how it arrives at decisions, thereby deepening our understanding of the image-based disease classification process.
The investigation chronicled in this paper represents a deep-seated effort to reconcile the complex realm of deep learning with the tangible obstacles of phytopathological surveillance in farming. Within the agricultural sphere—where the condition of crops directly shapes worldwide food availability—the importance of swift and accurate disease diagnosis can scarcely be exaggerated. Deep learning methodologies present a powerful answer to this pressing challenge by progressively distilling high-order representations from agricultural imagery. Even so, deploying efficacious disease-detection technologies in agrarian contexts while simultaneously addressing the computational and data-centric hurdles specific to the domain remains a nontrivial undertaking.
To meet this need, the present study proposes a novel solution: the DenseNetMini blueprint, purpose-built to overcome these very obstacles. DenseNetMini is an ensemble model painstakingly engineered to excel at detecting foliar disorders across a range of crops, including tomato and apple leaves. Test accuracy figures registered on the Plantvillage, Tomato leaf, and Appleleaf9 collections have reached striking highs of 99.65%, 98.96%, and 98.11%, respectively. A distinctive pipeline was advanced, in which DenseNetMini is fused with a learning resizer within an ensemble to boost training precision further and accelerate the learning cycle. In addition, this study advocated using the gradient product as an optimization mechanism to reduce training time while improving overall model performance. The overarching intent is to strengthen both efficiency and fidelity, making the tool valuable to agricultural practitioners worldwide. Crop production introduces singular challenges, among them scarce resources and the imperative for well-timed interventions. Normalization and the learning resizer both serve indispensable roles in suppressing noise within the proposed construct. Normalization brings input features onto a consistent scale, ensuring uniform ranges and enabling more productive model conditioning. By facilitating better gradient propagation and improved generalization, normalization contributes directly to noise attenuation. The learning resizer, conversely, adaptively modulates input dimensionality during training, equipping the model to handle images of varying dimensions and aspect ratios. Such adaptive rescaling homogenizes input geometries, thereby sharpening feature extraction and fortifying resistance to noise. The pairing of normalization with the learning resizer produces a noise-robust model, a property that proves critical for dependable agricultural disease recognition.
Furthermore, the ramifications of DenseNetMini radiate well past agriculture alone. Its inventive design philosophy carries the potential to overhaul how models are trained, how resources are utilized, and how knowledge is transferred across a multitude of fields. The discoveries reported here may be extrapolated to other crop species and industrial sectors, accelerating the development of bespoke models tailored to specific requirements. The undertaking seeks to bridge the capabilities of computer vision with the real-world constraints of farm settings, ultimately advancing more sustainable, higher-yielding cultivation practices.
This inquiry constitutes a holistic effort to catalog the virtues and shortcomings of prevailing methodologies while simultaneously unveiling a novel tactic that can reshape disease detection in agricultural milieus. By drawing on three independent datasets, the study corroborates the proposed model’s robustness and generalizability, confirming its suitability across a range of agricultural scenarios. The architectural composition of the ensemble construct harmoniously blends feature extraction with adaptability, accommodating imagery of varied sizes and proportions and remaining compatible with a range of scaling operations. Its slender profile results in a low count of trainable parameters, making it both a potent and resource-parsimonious candidate for computer vision tasks. XAI instruments, notably saliency maps and Grad-CAM, are marshaled to endow our disease detection framework with interpretability. These techniques reveal which picture subregions carry the most weight in the model’s decisions, fostering user confidence and opening the door to a more nuanced comprehension of disease identification in agricultural practice. Empirical evidence supports the superiority of the proposed ensemble model, which outperforms standalone architectures across all datasets, achieving remarkable accuracy with shorter training periods. The bespoke selection of optimizers further amplifies model behavior while respecting the idiosyncrasies of each dataset. Looking forward, the research program aims to leverage the potential of generative adversarial networks (GANs) for data augmentation, thereby enhancing the model’s flexibility across diverse agrarian contexts and contributing to more efficient, ecologically mindful farming operations.
The study focused on evaluating the capacity of deep learning architectures to detect diseases in agricultural settings, with a specific emphasis on identifying pathological conditions in tomatoes, apples, and other plants using the PlantVillage, Tomato Leaf, and AppleLeaf9 collections. Benchmarking against well-established architectures such as VGG, ResNet, Inception, and DenseNet reveals that these designs deliver robust classification performance, suggesting their suitability for disease screening. Nevertheless, our introduced ensemble model outperformed them all. The empirical results reveal that the ensemble construct, which amalgamates the complementary strengths of varied architectures, consistently surpasses any single model operating in isolation. XAI utilities such as saliency maps and Grad-CAM enabled us to make our disease detection framework more transparent and open to interpretation. Saliency maps reveal which image regions exert the greatest influence on the model’s decision-making. This ensemble model achieves loftier accuracy while maintaining computational parsimony. The importance of purpose-built ensemble strategies tailored to agricultural disease identification is underscored here. The investigation provides a reliable and streamlined approach to improving crop health and productivity. The findings underscore the importance of selecting an appropriate model for agricultural deployments. Progress in agrarian disease diagnostics could be propelled forward by future inquiries that refine ensemble methodologies and incorporate broader, more heterogeneous datasets. The rollout of this initiative carries far-reaching consequences for sustainable agriculture and data-informed practices, with the potential to meaningfully affect global food security and sharpen crop management tactics.
The authors would like to thank the Advanced Machine Intelligence Research Lab (AMIR Lab) for its supervision and resources.
The authors declare that they have no known competing financial interests or personal relationships that could have influenced the work reported in this paper.
American International University Bangladesh provided Dr. M. F. Mridha’s report. Dr. M. F. Mridha reports a relationship with American International University, Bangladesh, including employment.
None
None
Open Access The author(s) retain copyright. This article is licensed under the Creative Commons Attribution-NonCommercial-ShareAlike 4.0 International License. It may be shared and adapted for non-commercial purposes with appropriate attribution, an indication of changes, and distribution of adaptations under the same license. Third-party material may be subject to separate terms identified in its credit line. View the license at https://creativecommons.org/licenses/by-nc-sa/4.0/.
 Agro Intelligence Research Press