The advancement of motion-sensor technology for observing cattle behavior has enabled farmers to assess their animals’ welfare more efficiently. Whereas the bulk of existing research focuses on single-dimensional outputs and separate behavioural classifications, superior predictive precision can be achieved by integrating intricate movements and enhancing sensor algorithms that detect multidimensional activity, that is, more than one movement executed concurrently. This article presents a machine-learning methodology for analyzing overlapping yet independent motions. The system’s output comprises automatically identified complex behaviour sequences that may be used to gauge animal welfare, forecast calving, or detect early disease indicators. The investigation pairs automated motion-sensing equipment (namely, a halter and a pedometer) developed for ruminants and sold under the name RumiWatch with video-based surveillance. It places it upon a Charolais fattening bull. Fourteen distinct categories of complex motion were catalogued: defecating-urinating, eating, drinking, getting up, head movement, licking, lying down, lying, playing-aggression, rubbing, ruminating, sleeping, standing, and stepping. Owing to the deployment of several parallel binary classifiers, the platform proved capable of identifying concurrent behavioural patterns with high fidelity. Two machine learning methods, Support Vector Classification (SVC) and Random Forest, were applied to distinguish various generalised and non-generalised motion types. Outputs produced by these two supervised learning frameworks were placed side by side for comparison. An uninterrupted forty-eight-hour video stream was labelled to serve as training material for the systems and to corroborate their predictive outputs. The performance levels of both classifiers in pinpointing specific motions, whether using both sensors or each sensor individually, and under varying parameter configurations (i.e., window size and padding), were scrutinised. Although the two classifiers yielded divergent results, the optimised parameter configurations indicated that each motion category exhibited by the subject animal was successfully identified with substantial accuracy. Further research encompassing a greater number of individual subjects and different ruminant species would broaden the knowledge base regarding improvements to the system’s efficacy and precision.
Grasping the motions, conduct [1] and affective responses [2] of bovine animals contributes to the design of rearing frameworks that uphold animal well-being, a factor fundamental to elevating output [3]. During the formative period of cattle behaviour observation [4, 5], no instruments existed to enable herd-scale, uninterrupted behavioural tracking. With technological progress, ever more penetrating investigations [6] have been harnessed to examine the habits of ruminant creatures. Early on, reliance rested solely on direct visual appraisal, experience-based methodologies [7], or scrutiny of ambient parameters (e.g., thermal conditions, moisture levels, illumination). Today, sensing devices enable the measurement of multiple behavioural variables, such as endocrine concentrations and various haematological markers. Within intensively managed livestock settings, sensors can track health parameters and, accordingly, be deployed to safeguard their welfare [8].
The emergence of precision livestock farming (PLF) has expanded the supply of non-invasive sensor technologies suitable for use with agricultural animals [9, 10]. The principal merit of sensor-driven observation lies in its ability to continuously monitor an animal throughout the day, providing precise and unbiased data [11-13]. A sensing unit may take the form of an apparatus secured to the bovine or an externally positioned device, such as a camera stationed to monitor the group. [14] used photographs obtained from imaging devices in their trials on bovine posture estimation using deep learning algorithms.
Motion-detecting devices are designed to ascertain the state and activity of cattle. These units can be affixed to the jaw/head region or the legs and help herd managers interpret animal behavior more clearly. The motion patterns captured by the sensors can be linked to specific behavioural expressions. Furthermore, physiological conditions associated with characteristic behaviours, such as oestrus (heat), pregnancy loss, parturition, and hostile interactions, can also be forecast. Collected data streams can be processed and utilised to better meet cattle’s requirements better and facilitate earlier recognition of departures from the normative physiological baseline, encompassing a variety of illnesses or dysfunctions.
The majority of off-the-shelf sensor products incorporate proprietary software that derives novel metrics from raw data using manufacturer-encrypted algorithms. Access to the raw data is withheld from the client [15]. One departure from this norm is the RumiWatch system, a product of the Swiss enterprise Itin+Hoch, purpose-built for cattle research. The apparatus was initially conceived for the prompt detection of health disturbances and metabolic or nutritional complications in lactating cows [16]. Even so, the sensor holds broader promise. Several scientific inquiries address the prospective utilisation and verification of RumiWatch sensors [17, 18]. The apparatus comprises a noseband incorporating a pressure-sensitive element, together with an accelerometer-based pedometer worn on a limb. During validation, [19] detected no meaningful divergence between the data stream from the RumiWatch noseband pressure sensor and that from an autonomous accelerometer affixed to the same animal. The practical effectiveness of the RumiWatch sensors has additionally been trialled on pastured stock [20, 21]. Even though the RumiWatch was engineered specifically for cattle, it has also been tested on alternative taxa, including horses [22], water buffalo [23], and ovines [24].
Notwithstanding the abundance of scholarship on deploying motion sensors to identify and decode bovine behaviour, considerable untapped capacity persists, for instance in discerning more elaborate conduct and multidimensional motion (that is, dissimilar movements unfolding at the same moment). By way of illustration, antecedent research utilising accelerometers [25, 26] could detect forms of movement yet was confined to a single form at any one instant or to variations occurring within that single movement. In actual practice, however, given behaviour can be constituted of several motions taking place simultaneously, for example, cud-chewing whilst recumbent or whilst upright; belligerent displays whilst cud-chewing and whilst upright. The capacity to detect such multidimensional movements may prove critical in animal husbandry management. To illustrate, belligerent conduct, in combination with cud-chewing and upright postural movements, manifested by a lactating cow, may be read as antagonistic social interaction that restricts another cow’s opportunity to feed, with the consequence of lowered milk yield [27].
Enhancing the sensor algorithm to identify intricate movements and the simultaneous occurrence of multiple motions has the potential to yield superior outcomes that better mirror real-world conditions. Accumulating additional data on specific animals will lead to a better understanding of their requirements, thereby expanding opportunities to improve their condition. This investigation employed RumiWatch sensors fitted on a model bovine subject to trial an original approach for detecting complex and concurrent movements by addressing the following inquiries:
(1) What influence does noise filtering exert on the detection of distinct movement types?
(2) Does the devised approach prove suitable for identifying more elaborate movement categories (e.g., standing up, lying down, defecating-urinating, licking, rubbing) compared to RumiWatch sensors, which capture only a handful of general movement types?
(3) Does the devised approach prove suitable for identifying these movement categories in parallel (i.e., several movements occurring simultaneously)?
(4) How does the efficacy of utilising two sensor combinations (i.e., halter and pedometer) compare against employing individual sensors for detecting these movement categories?
The approach put forward in this study can discern multiple specific movements that may co-occur at any given moment, as the analysis was conducted in a multidimensional manner, employing a distinct classifier model for each movement category. The findings of this study will enhance the RumiWatch algorithm’s ability to recognise more elaborate and multidimensional movements, thereby boosting precision in predicting increasingly complex cattle behaviour. This can contribute to clearer comprehension by providing a suitable setting and serving as an early alert mechanism to avert cattle-associated illnesses.
This investigation broadly encompasses three principal tasks (Figure 1), namely data gathering, transformation, and examination. Data were acquired from RumiWatch sensors affixed to the subject animal and from video cameras positioned within the animal housing area. Subsequently, the collected data were transformed and temporally aligned. Following this, data were imported into bespoke software (i.e., cownalyse), which allowed visual camera review to validate specific movement sequences logged by RumiWatch. Finally, the data were processed using two supervised machine learning classifiers, i.e., SVC and Random Forest. These conventional learning algorithms were chosen for their superior performance on structured data with comparatively modest sample sizes [28].
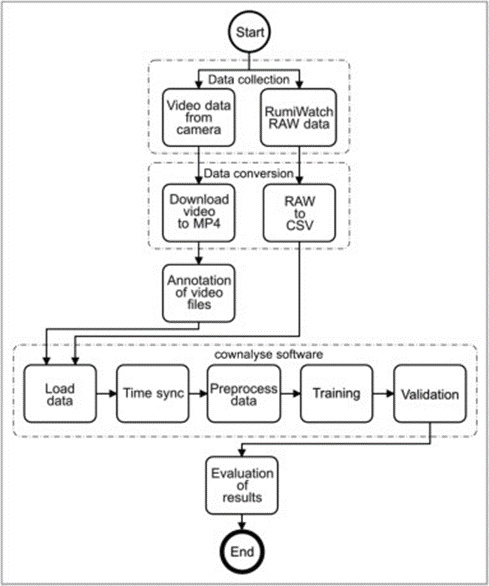
Figure 1. The workflow of this study with three main tasks: data collection, conversion, and analysis.
The experimental location was the beef production facility of Gazdatrend Ltd., located in Várvölgy, in Hungary’s Western Transdanubian region. The animal under observation was an 18-month-old Charolais fattening bull, accommodated alongside its 9 pen-mates in a stable measuring 6 × 11 m and an adjoining outdoor enclosure measuring 5 × 9 m. The bull under study was outfitted with a RumiWatch (Itin+Hoch GmbH) set: a halter secured to the head and a pedometer fastened to the left rear leg (Figure 2). The instruments logged pressure, acceleration, and temperature at a 10 Hz sampling rate. The unprocessed data were post-processed and converted to CSV format, preserving the 10 Hz frequency, using the RumiWatch Converter V0.7.4.13. The devices were mounted on the animal ahead of the observation window to allow for acclimatisation. The instruments stayed in place for one month (29.03.2021–29.04.2021). Out of this timeframe, we chose 24 h (18/04/2021) for the investigation. As several movement categories were underrepresented, the subsequent 24 h were also included in the annotation dataset, with particular attention paid to these movements.
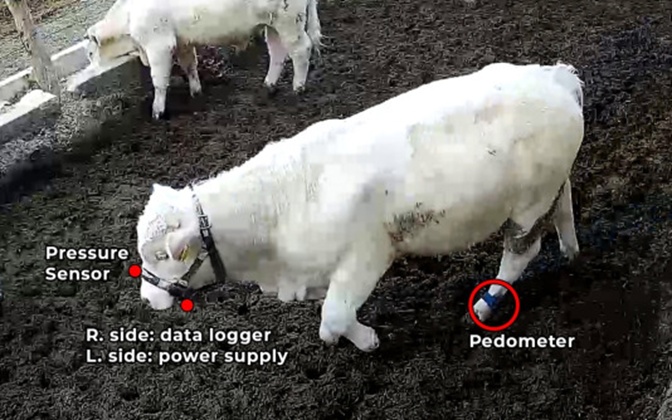
Figure 2. The observed bull mounted with two RumiWatch sensors, as seen from Camera 1.
Visual monitoring was carried out using four high-resolution, wide-angle digital cameras (Milesight MS-C2964-PB; FW: 40.7.0.79-r7), which captured video streams of the animals around the clock (Figure 3). A pair of cameras observed the stable, while the remaining two observed the outdoor enclosure. The date stamp, together with the current time, was imprinted within the upper right-hand corner of the camera frames. The camera streams were relayed via Wi-Fi antennae to the data-logging unit (Milesight MS-N1004-UC; FW: 73.9.0.14-r3) housed within the farm’s central structure. During the work, an additional central unit was utilised to handle archived video footage (Milesight MS-N1009-UNT; FW: 72.9.0.14-r3). Video was captured at full-HD (1920 × 1080) resolution, at 12 fps (frames per second) VFR (variable frame rate), and at 800–1300 kb/s VBR (variable bit rate).
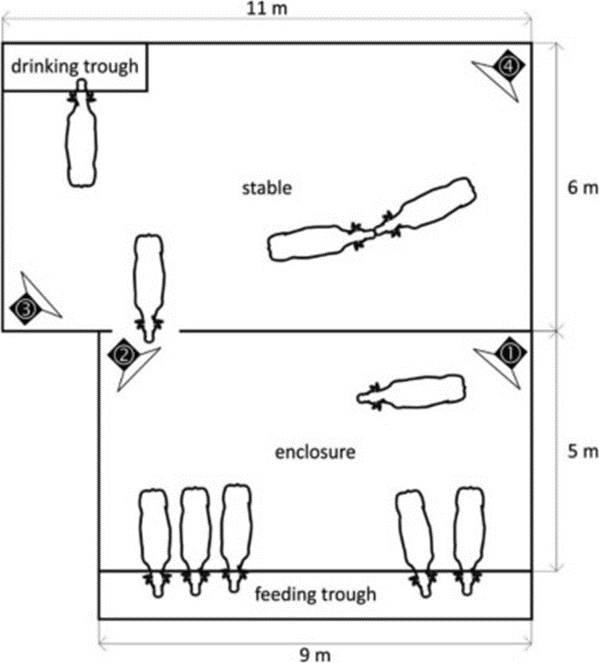
Figure 3. Floor plan of the stable and enclosure and the location of the four cameras installed for monitoring.
Reflective sheeting was affixed to the halter to permit accurate identification of the subject animal during nighttime sequences (Figure 4).
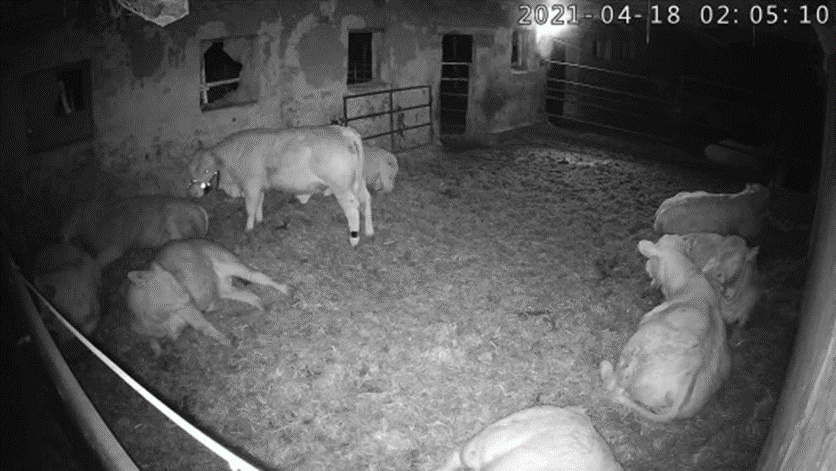
Figure 4. Snapshot from the video used for annotation (camera 4). The subject animal can be easily and accurately identified even during the night due to the reflective halter.
To achieve a successful experimental assessment, strict and precise temporal synchronisation of the video footage and sensor readings was pursued. The internal clocks of the RumiWatch units were aligned with the computer’s clock that powered their user interface, and the computer’s clock was kept correct via an online time service provider (UTC + 1:00 time zone). The cameras obtained the time signal from the system’s central unit, which lacked automatic synchronisation and necessitated periodic manual correction. As the central unit’s clock persistently gained time, the two devices fell out of alignment. To rectify this, the following steps were executed: 1) during video capture, the time stamp registered by the camera was superimposed via the software responsible for saving the footage; 2) by manually juxtaposing and aligning the video with the sensor data, the momentary discrepancy between the visible clock in the footage and the logged sensor time was gauged at several junctures exhibiting characteristic movements (Figure 5); 3) upon graphing the offset magnitude against elapsed time, it was discovered that the divergence between the two clocks exhibited a linear progression over time with notable precision between the synchronisation points (exhibiting a drift of roughly 5.2 s/day, Figure 6); 4) by fitting line segments between the measured datapoints to the temporal variation of the offset, it became feasible to cross-reference the two datasets at any given instant by factoring in this offset (fitted compensation).
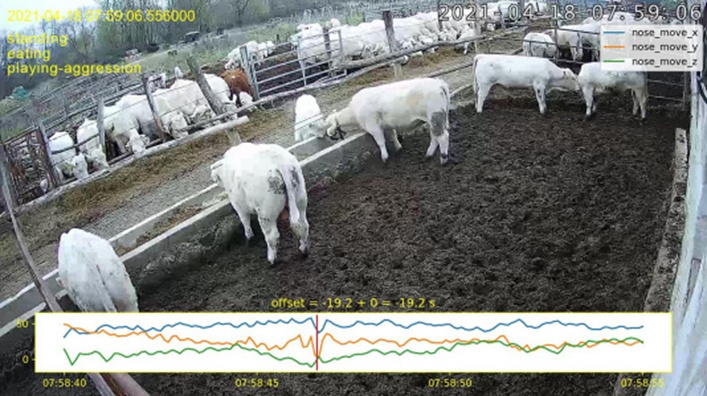
Figure 5. Manual determination of time synchronization at a given moment: the equipped animal at the trough, with the 3D gyroscope data from the sensor shown in the video. A custom Python script was used to estimate clock skew between the video and motion sensor data by visually matching motion in the video with corresponding spikes in the motion sensor data. In this case, for example, one of the clocks had to be set 19.2 s earlier for the animal to push the calf away from the trough in the video, as indicated by the gyroscopes during the intense movement.
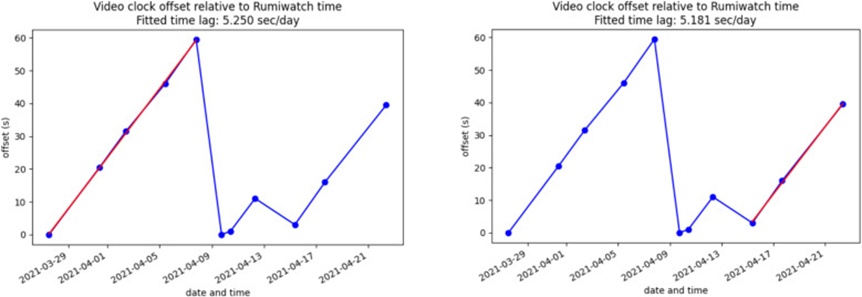
Figure 6. Time difference between RumiWatch and video recordings as a function of time. The figure has sawtooth wave characteristics. The points corresponding to offset 0 are the points of the manual time synchronization of the video recording system. The fitted rate of deviation is about 5.2 s/day.
The “variable framerate” setting in the camera settings also compromised time-synchronisation precision. The camera’s image capture software proved imprecise in logging timestamps at the start of video files, displaying the most recent keyframe rather than the actual start time. Taking all these elements and adjustments into consideration, an overall temporal synchronisation of approximately 1–2 s was maintained between the sensor outputs and the camera recordings across the complete dataset.
The stored video footage was retrieved from the camera infrastructure via the Milesight CMS (2.4.0.14). For labelling, we selected the camera angle that provided the most unobstructed view of the bull carrying the RumiWatch instruments during each time block. The labelling workflow was completed within BORIS version 7.10.5 [29]. The training and inference stages relied on the purposely engineered cownalyse (1.2.2) environment, which was tailored specifically to the needs of this investigation. It is a Python-driven, cross-platform command-line scripting foundation that executes automated data manipulation and model-fitting sequences, relying heavily on the open-source Python stacks numpy, scikit-learn, pandas, and matplotlib.
The core functional units making up Cownalyse are as follows:
• Process: Scanning, preparing, verifying, rectifying, and screening RumiWatch halter, pedometer, and BORIS data streams.
• Learn: Fitting the learning procedure with RumiWatch sensor feeds and BORIS-labelled video annotations, resting on the open-source estimator classes: sklearn.svm.SVC, sklearn.svm.linearSVC, and sklearn.ensemble.RandomForestClassifier [30].
• Predict: The motion inference modality of the fitted framework applies to any incoming RumiWatch data.
• Render/plot: Creating informative, one-of-a-kind visual and text-form summaries from the dataset to confirm fitting soundness or to gauge the synchronisation offset manually.
The hyperparameter choices governing the execution of SVC and RandomForest estimators corresponded to the factory presets of the aforementioned Python toolkits, except for the adjusted class weight parameter and the C regularisation strength, which were optimised internally. A single set of parameters was fixed and applied consistently across all models and motion classes.
As a point of departure, we specified 14 motion classes and provided them to the BORIS environment, serving as the bedrock of the ethogram. In addition to the motion classes distinguishable by the RumiWatch’s own categorisation (namely drinking, ruminating, standing, stepping, lying, eating), nine further motions were examined: getting up, lying down, defecating-urinating, play-aggression, licking, rubbing, head movement, and sleeping. RumiWatch relied exclusively on a pedometer and a halter to register and categorise motion events (Figure 7). By contrast, our categorisation harnesses streams from both sensing modules to register and categorise every motion.
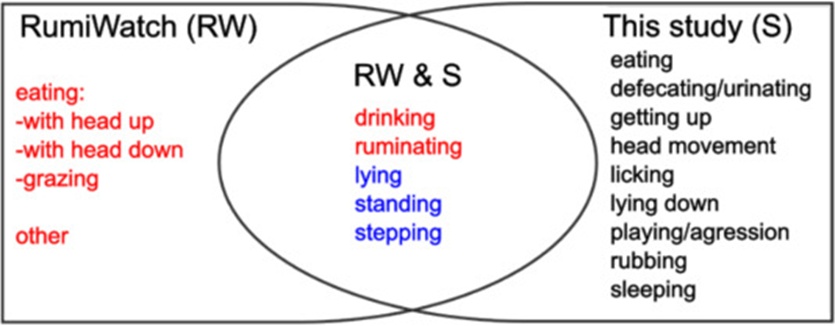
Figure 7. The forms of movement classified by different classifications: RumiWatch’s classification (left), this study (right), and both (middle). RumiWatch defines three types of eating movement and uses data from the halter (red) and the pedometer (blue) for classification. This study used data from both sensors and analyzed them together and separately (For interpretation of the references to colour in this figure legend, the reader is referred to the web version of this article).
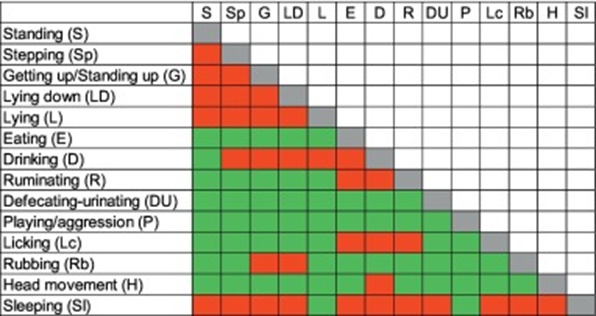
An indispensable segment of the ethogram table is the matrix specifying which motion forms cannot co-occur (Table 1). At any discrete moment, the focal animal may carry out a single motion or several motions (i.e., 2–3) at once. For example, motions such as eating, standing, stepping, getting up, lying down, and lying can occur in parallel (Table 1). Where this occurred, the onset and offset of each motion were nonetheless registered individually and concurrently within BORIS. Crucially, the matrix displayed in the table was applied solely during the data entry stage; the classifiers paid no attention to it throughout the multidimensional inference step.
Table 1. Exclusion matrix of the movements included in the ethogram. Movements indicated in green were marked parallel in BORIS. Events indicated in red are mutually exclusive and cannot be marked in parallel.
|
Seventy-seven video blocks originating from the selected day’s 24-hour span, plus 21 video blocks drawn from the day that followed, were brought into BORIS, yielding a combined sum of 98 video blocks sourced from two observation days. BORIS holds the assembled materials (ethogram, video location path, and annotations) in the JSON (JavaScript Object Notation) format. Annotating a particular video block requires entering the correct date and the exact time, as displayed on the video’s embedded stamp, as input arguments to the processing pipeline, with a precision of one second. A vital condition for labelling the diverse motion classes during video inspection is establishing the exact initiation and termination times of the genuine event. For this purpose, the “frame-by-frame” functionality in BORIS was utilised, enabling frame-by-frame traversal of the footage.
While conducting observations, logging every motion at any given instant is of considerable importance. Multi-label classifiers (Tsoumakas and Katakis, 2006) can detect multiple motions concurrently. That said, only those temporal points at which the animal’s actions could be reliably and entirely pinpointed were retained. Given the multidimensional character of the categorisation, motions that are absent from a given moment must likewise be represented in the training corpus. Expressed another way, for every labelled time point, it is necessary to establish, for each motion class, whether it is presently taking place or not.
The frequency of occurrence, the cumulative and mean lengths of the motion classes captured in BORIS, together with the proportion of total labelled time each represents, are laid out in Table 2. The statistics indicated that the most frequently marked motion is ‘standing’. In contrast, the motion exhibiting the greatest cumulative length is ‘lying’, followed by ‘stepping’ in number of occurrences and ‘eating’ along with ‘ruminating’ in duration terms. Head movement was recorded infrequently and for short periods.
Table 2. The length of the fourteen movement forms identified in this study.
Movement | % of total length | Mean duration | Total duration | Total duration | Total number |
Defecating-urinating | 0.4 | 24.362 | 0:08:32 | 511.603 | 21 |
Drinking | 0.4 | 28.511 | 0:09:30 | 570.210 | 20 |
Eating | 6.2 | 140.119 | 2:29:28 | 8,967.630 | 64 |
Getting up | 0.2 | 12.834 | 0:04:17 | 256.684 | 20 |
Head movement | 0 | 3.191 | 0:00:16 | 15.957 | 5 |
Licking | 1.2 | 24.155 | 0:28:11 | 1,690.879 | 70 |
Lying | 12.6 | 247.996 | 5:05:52 | 18,351.722 | 74 |
Lying down | 0.1 | 11.152 | 0:03:32 | 211.892 | 19 |
Playing-aggression | 0.7 | 18.605 | 0:16:45 | 1,004.684 | 54 |
Rubbing | 0.9 | 26.325 | 0:21:56 | 1,316.252 | 50 |
Ruminating | 8.6 | 367.585 | 3:28:18 | 12,497.885 | 34 |
Sleeping | 1.9 | 139.773 | 0:46:35 | 2,795.463 | 20 |
Standing | 11.4 | 38.596 | 4:36:36 | 16,596.071 | 430 |
Stepping | 1.3 | 5.101 | 0:30:52 | 1,851.552 | 363 |
Supervised learning paradigms [31] were placed side by side for fitting to real-world annotated input data. Regarding the annotation repository, RumiWatch’s own classification output served as a benchmark, and the video footage we labelled later served as ground truth. Throughout the supervised machine learning routine, a “black box” [32] construct is adjusted, one that, on its first pass, attempts to link incoming sensor readings to annotation targets at a high success rate, subsequently generating motion labels for previously unseen sensor data streams. Without attempting an exhaustive catalogue, the following provisos ought to be heeded during the fitting process: 1) an appropriate compromise between rote retention and generalisation aptitude must be secured by correctly configuring the learning framework and compiling a training repository of proper scope [33]. 2) Satisfactory noise suppression [34] and temporal alignment/coupling must be upheld, as remarked upon earlier.
Assuming the temporal alignment is adequate, the fitting unit of the supervised learning system will take the shape of the following two matched data constituents: (1) the existence or absence of a targeted motion class (for instance, “lying”) at a designated moment, rendered as binary true/false data; (2) the assortment of descriptors harvested from the sensor readings corresponding to that moment, that is, what is termed the feature vector, which is computed over a time window of a given duration leading right up to the moment in question. Every individual classifier delivers a forecast (a binary true or false) for its assigned motion class, and the collective assembly of these 1-bit binary classifiers yields the multidimensional outcome (Result).
The fitting algorithm requires a substantial volume of precisely paired data entries covering both active and inactive motion categories. If the learning system is furnished with a sufficient supply of high-grade data, it can tune its internal configuration to discriminate between active and non-active conditions for a designated motion, regardless of the feature vector inputs supplied.
The protocol outlined by [35] served as the starting point for building the feature vector. The opening move is to set the time window parameter span, from which the sensor data is drawn, typically 2–10 seconds, yielding 20–100 data readings from the 10 Hz RumiWatch stream. Thereafter, the following descriptors were pulled from each category of raw (pressure, motion, temperature) and computed (scalar products and derivatives) data channels: arithmetic mean, standard deviation, skewness, lowest reading, highest reading, spread (max minus min), tally of peaks, frequency-domain features (the real-valued components yielded by the discrete Fourier transform; [36]. A collection of computed descriptors is tied to each moment in time, the totality of which makes up the “feature vector”.
The fitting procedure for disparate motion components is undertaken separately (that is, multi-label categorisation via a suite of binary classifiers). The arrangement of feature vector patterns proceeds as follows: 1) Every time window corresponding to the active or inactive state of a given motion is pinpointed; 2) These windows are assigned sequential numbers, and from this ordered set, a predetermined amount is drawn in a balanced fashion from both active and inactive intervals; 3) A specific subset is extracted at random following a deterministic randomness scheme out of this bounded (yet kept uniform in size across the various motion components) collection for fitting; 4) The soundness of the fitting is then assessed against a held-out portion of the labelled dataset, one that remained unseen by the fitting procedure.
Configuration of the feature vector collection was controlled through three core parameters:
• Count: How many training samples linked to a given motion are drawn from the full timeline by means of uniform selection across the motion’s total span. Our goal was to secure 1000 sample points (time windows and feature vectors) per motion type within the experiment. The choice of 1000 sample points rested on empirical judgment, striking a suitable balance between sampling granularity and computational runtime while ensuring that distinct motion categories were represented on an equal footing. Owing to the multi-label nature of the classifiers and to whether the TS (train size) and VS (validation size) switches are engaged, the actual sample point tally varies. This extra parameter pair specifies the proportions of the annotated material used for training (TS, train size) and held back for validation (VS, validation size). We set this division to 50–50%, thereby ruling out any overlap between the training and validation pools. Through this arrangement, the ability of the fitted model to generalise to unfamiliar data can simultaneously be appraised in a supervised framework.
• Window: The temporal breadth of the window, stated in seconds, over which feature vectors are consolidated for a specific time point (the applied figure sat between 2 and 10 s; the feature vector assigned to any moment was invariably compiled from the readings falling within the window-sized segment directly ahead of that moment).
• Padding: The length of the interval sheared off both the start and the tail of each motion occurrence. Where employed, exclusively the residual span inside the sheared boundaries contributes samples for training, so the corrupting noise arising from the lingering 1–2 s of synchronisation drift is suppressed, at the price of relinquishing a portion of the source material.
To graphically portray the findings, three performance measures were adopted: Recall [37], Precision ([38], and F1-Score. Computation of these measures relied upon the Confusion Matrix [39], within which the annotated and predicted counts are housed. Chart production was undertaken in R version 4.2.3 [40], with support from the ggplot2 package [41].
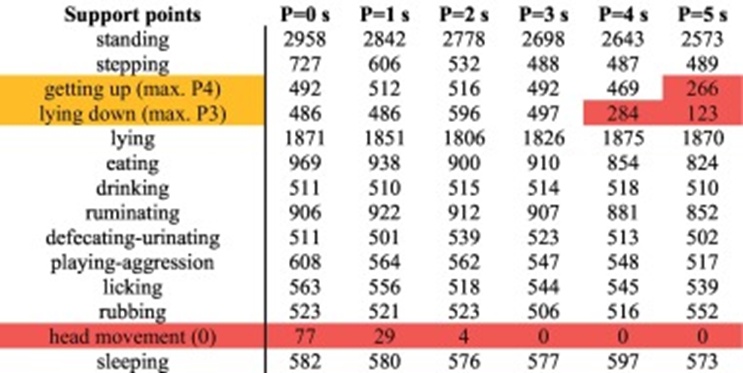
Alongside the varied Padding specifications, Window extents were also examined under three separate conditions. Padding durations ranged from 0 to 5 s, and Window extents were set to 2, 5, and 10 s. This assessment was performed on readings coming from both apparatuses (halter and pedometer), making use of SVC and RandomForest learners, at Count = 1000 points, meaning 1000 support points, and with a 50–50% split of training against validation material, requiring 500 learning points together with 500 prediction points for a valid run. Activating padding alters the pool of available support points due to trimming. The resulting supply of support points is catalogued in Table 3.
Table 3. The number of support points available for the comparative experiment (target: minimum 500; marked with red: insufficient sample points; P: Padding).
|
The lying down motions (P = 4) as well as the standing up and lying down motions (P = 5) were inadequately represented, a reflection of the relatively limited duration of these two motion forms. The evidence indicates that getting up unfolds somewhat more gradually (the bull gathers force before rising), whereas lying down was accomplished within a handful of seconds. As events showed, “head movement” (including lateral and vertical swinging and head shaking) manifested only sporadically and for such fleeting spells across the 24 hours, prompting us to discontinue further application and detection of this motion type in the current study. Positive departures above the 500 support point mark arise from the multi-label design of the classifiers: at moments where the bull concurrently performed multiple labelled behaviours. The framework lists all annotated motions for both training and prediction. This accounts for standing and lying occurrences commanding far more support points, since every other motion the bull executes—apart from getting up and lying down—entails either standing or lying. While running the tests, we sorted the motion forms by the average percentages obtained from the figures. The outputs that follow constitute one facet of the multidimensional breakdown, in which the individual motion forms are identified in parallel by the classifiers.
Tests conducted with the SVC classifier (Figure 8) disclosed that even the most fragile parameter set (P = 0; W = 2) returns a recall score no lower than 75%. Yet correct identification (i.e., precision) for stepping sank to merely 35.3%, implying widespread false labelling of stepping. The runner-up in mislabelling frequency was rubbing, clocking a recall score of 61.3%. Modifying the parameter choices resulted in the greatest increase in stepping, with a recall score of 97.8% (P = 5; W = 10).
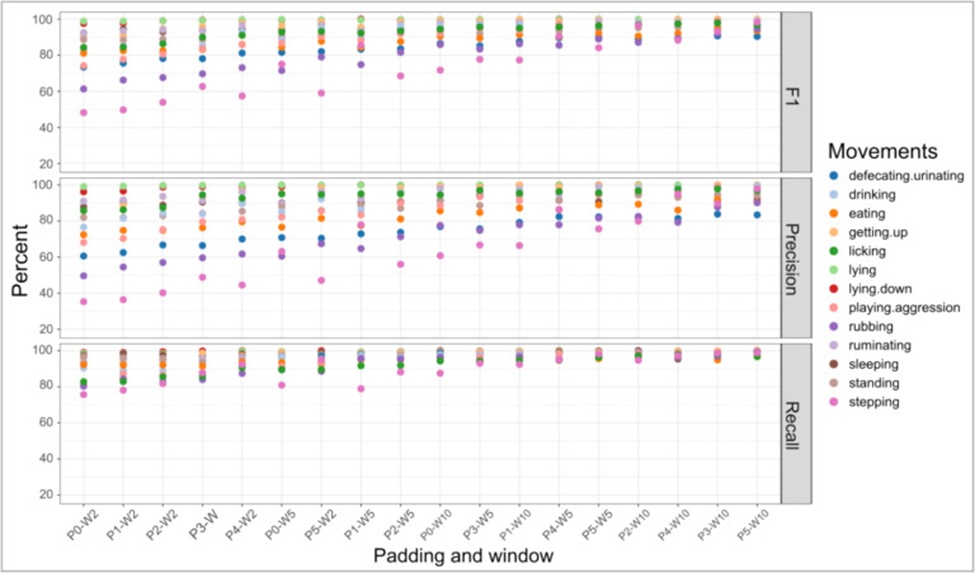
Figure 8. F1 score, precision, and recall results of the SVC classifier from the different Padding (P) and window (W) treatments in 14 complex movements. The treatment sequence shown was arranged from lowest to highest values.
Tests using the RandomForest classifier (Figure 9) yielded the poorest results for the P = 0, W = 2 treatment, whereas the P = 5, W = 10 treatment yielded the strongest results. Hence, boosting P alongside W heightens training fidelity. However, considering that enlarging P leads to a sacrifice of data (the initial and final segments of each motion label are discarded), committing to P = 5 is not unequivocally advisable. Weighing the evidence, the combination W = 10 and P = 3 supplies adequate outcomes. All but 3 motion forms (stepping = 94.5%; rubbing = 94.5%; licking = 94.8%) surpassed the 95% threshold under this parameter pair. Augmenting P yielded only a slight uptick in training and prediction exactness.
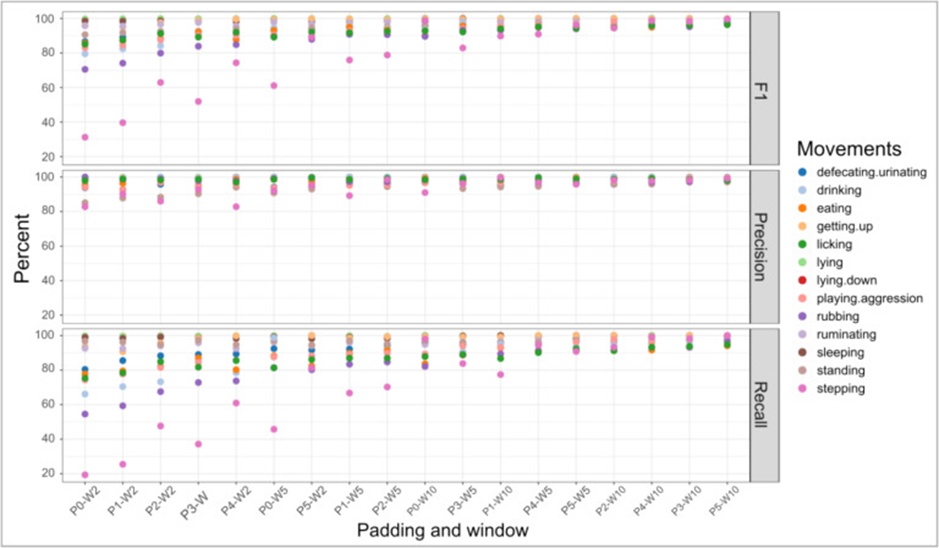
Figure 9. F1 score, precision, and recall results of the RandomForest classifier from the different Padding (P) and window (W) treatments in 14 complex movements. The treatment sequence shown was arranged from lowest to highest values.
Detection values under the optimal parameter pair (P = 3 and W = 10) indicated that the RandomForest learner picked up all motion categories with a capability exceeding the 90% mark within the selected parameter space (Figures 10 and 11). For the SVC learner, precision dropped just below 90% for eating. They slumped further for stepping, defecating-urinating, and rubbing motions, signalling a comparatively high quotient of false categorisations. Inching P upward for stepping, eating, and rubbing propelled precision past the 90% boundary; still, even with the most extreme tested figures (P = 5; W = 10), defecating-urinating manages only 83.4% (precision figures: stepping P = 4: 89.6%, P = 5: 97.8%; eating P = 4: 92%, P = 5: 90.4%; rubbing P = 4: 87.7%, P = 5: 90.1%).
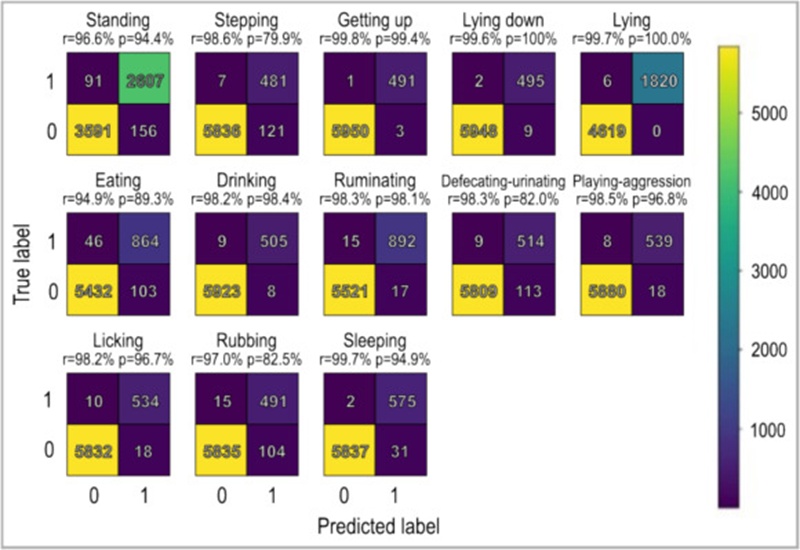
Figure 10. Precision and recall values of the SVC classifier with the optimal settings (Padding = 3, Window = 10, Train size = Validation Size = 0.5).
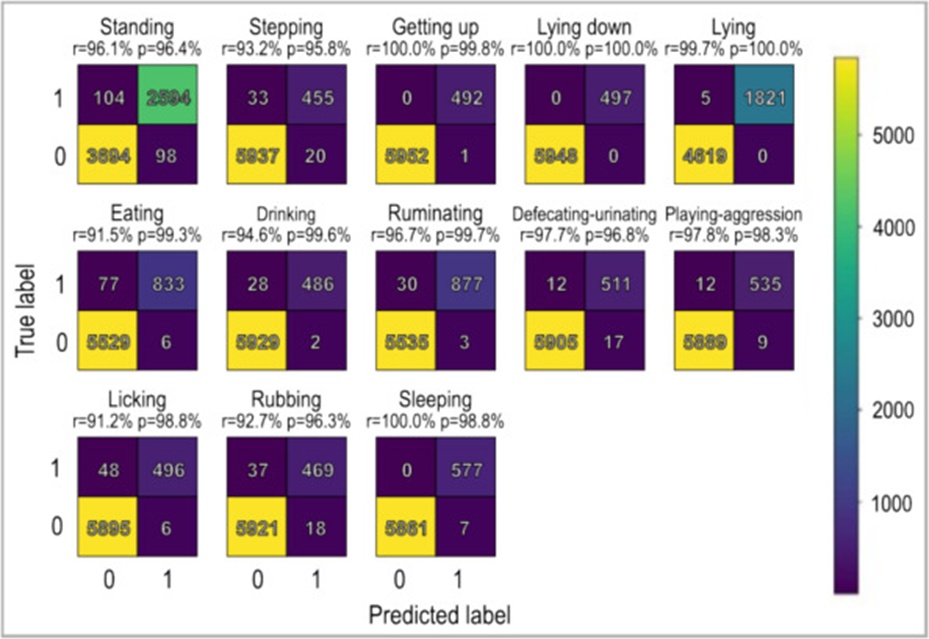
Figure 11. Precision and recall values of the RandomForest classifier with the optimal settings (Padding = 3, Window = 10, Train size = Validation Size = 0.5).
The divergent detection capacities displayed by the two algorithms (Figure 12) revealed that SVC yields a high recall score (lowest: eating, 94.9%) paired with a low precision score (lowest: stepping, 79.9%). This relationship stands reversed for RandomForest (lowest recall: eating, 91.5%; lowest precision: stepping, 95.8%). Drawing upon these observations, SVC adopts a more generous stance but suffers a larger miss count. RandomForest, in contrast, asserts the presence of a motion with greater caution, yet registers it with elevated exactness. When the harmonic mean (F1 Score) serves as the yardstick, the RandomForest procedure surpasses SVC.
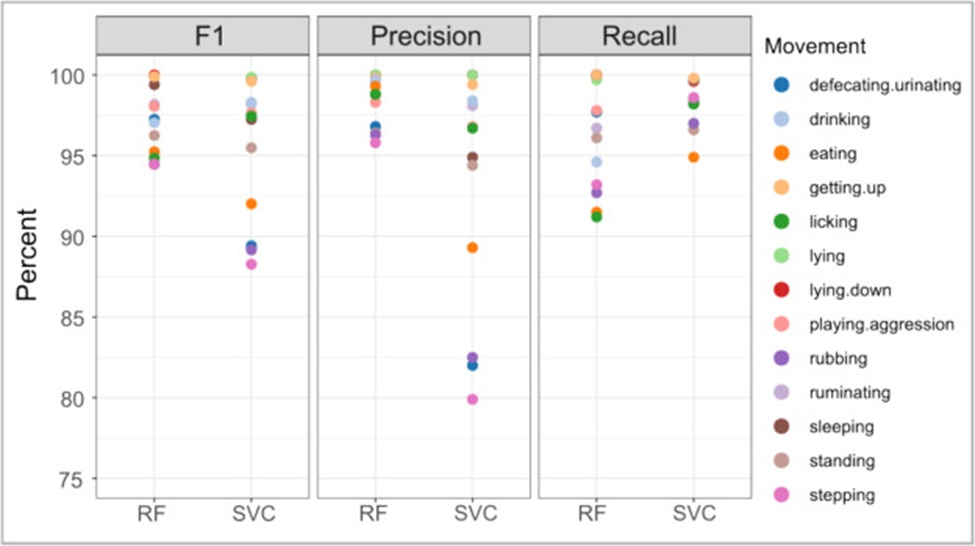
Figure 12. Recall and precision values of SVC and RandomForest classifiers for different forms of movement with settings Padding = 3; Window = 10 and Train size = Validation Size = 0.5.
What we have witnessed in the field is that neighbouring cattle operations seldom invest in more than a single sensor category for their herds. Acting on this premise, we conducted a set of evaluations in which each of the two sensing units was used independently for the motion categories under study, and the findings were then compared with those obtained when the information streams from both units were merged. These evaluations were conducted with Padding fixed at 3, Window at 10, and Training Size equal to Validating Size at 0.5, using both the SVC and RandomForest learning algorithms.
The F1 Score metrics delivered by the SVC classifier indicated that, when the two sensors were used jointly, the figures either sat near or exceeded the 90% boundary universally (Figure 13), except for stepping, which registered 88.3%. Activities dominated by the legs (namely standing, stepping, standing up, lying down, lying) were resolved more reliably from the pedometer signal. Even so, the concurrent inclusion of the halter data stream elevated recognition performance in every single case. Behaviours originating predominantly from the head (such as eating, drinking, ruminating, playing-aggression, licking) were identified with greater fidelity when sourced from the halter. That being said, the fused data from the two sensors also yielded gains in correctness for these very motion types. The halter underperforms marginally compared with the pedometer during leg-centric activities (e.g., standing up; pedometer: 98.3%; halter: 91.7%). In stark contrast, the pedometer fares markedly worse on head-centric activities (e.g., drinking, halter: 97.4%, pedometer: 61.1%).
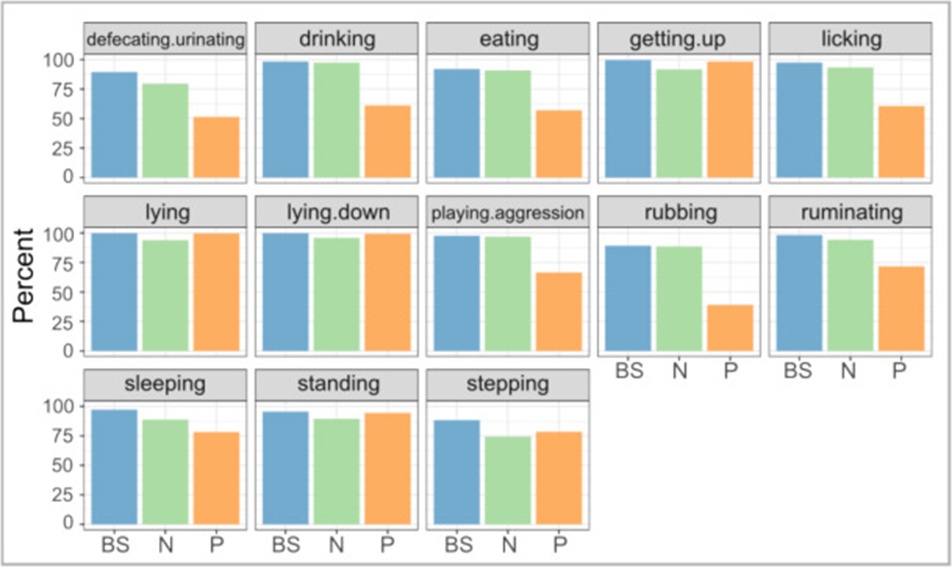
Figure 13. F1 Score values of the SVC classifier with different sensors: both sensors (BS), Noseband (N), and Pedometer (P) with settings Padding = 3; Window = 10 and Train size = Validation size = 0.5. Most movements were better recognized with the noseband than with the pedometer.
When benchmarked against SVC, the RandomForest learner displayed a keener aptitude for discerning both head- and leg-associated motions drawing solely on the halter (Figure 14). The joint exploitation of both sensing channels delivered the highest scores without exception, a trend visible across every F1 Score logged by RandomForest. Furthermore, when tasked with detecting eating behaviour using the pedometer, RandomForest also cleared the 90% hurdle across the entire set of motion categories, even with a single sensor. A particularly intriguing observation was that stepping was anticipated with greater success from the halter data than from the pedometer data.
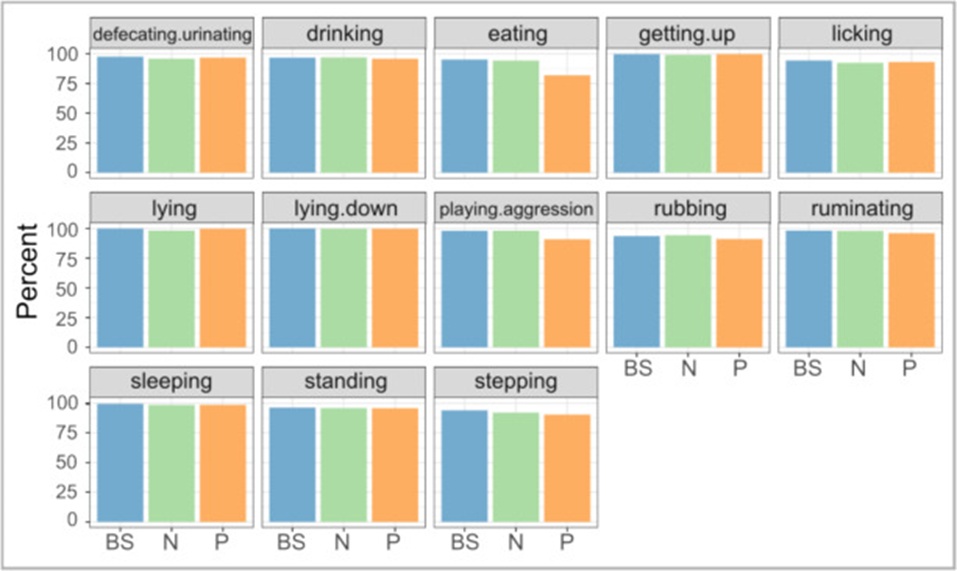
Figure 14. F1 Score values of the RandomForest classifier with different sensors: both sensors (BS), Noseband (N), and Pedometer (P) with settings Padding = 3; Window = 10 and Train size = Validation size = 0.5. Most movements were better recognized with the noseband than with the pedometer.
In light of these patterns, the Random Forest technique stands out as more effective for motion category identification. It exhibits superior generalisation, whether supplied with a single sensor stream or a combination of both.
The application of motion-sensing instruments to monitor the fitness and comfort of husbandry animals is advancing rapidly, driven by their increasing accuracy. Within the confines of this study, centred on a commonplace domesticated farm specimen such as a bull, alterations in demeanour stemming from pathology, tension, or eroded welfare are often nuanced. Keeping watch over their movements with body-worn detectors equips the herdsman with the means to detect departures that unaided visual scrutiny could easily miss. Expanding the inventory of discernible motion forms—embracing those that arise in tandem—within the detection algorithm promises to further enrich our understanding of bovine condition and, in so doing, tighten the system’s reliability. Intelligence of this kind may well prove compelling to manufacturers of motion-sensing hardware as they iterate on their commercially distributed products, weaving in more elaborate motion repertoires to provide a richer, more faithful forecast of cattle welfare status. By way of example, an uptick in how often “defecating/urinating”, “lying down”, or “sleeping” episodes occur might point to deteriorating welfare or an incipient disorder. A growth in “playing/aggression” can be construed as signalling the bull’s period of heat, thereby flagging a prime window for gathering semen destined for artificial insemination programmes.
The findings of this investigation demonstrated that the method deployed for capturing multidimensional, temporally overlapping yet independent motions correctly classified 14 distinct complex movement varieties. The pipeline adopted from [35] functioned adequately for shaping the feature vector. A shortcoming did nonetheless emerge: the technique is restricted to quantifying motion forms whose persistence exceeds roughly 8–10 s and which manifest regularly. As a result, ephemeral actions such as coughing and head movements were excluded. A high degree of temporal congruence between the video recordings and the sensor logs is vital for both monitoring and data refinement. Despite the considerable effort devoted to securing optimal synchronisation, model fitting derived clear benefit from excising 3 s from both the commencement and termination of each annotated segment, and from broadening the analysis interval to 10 s. Behaviours of very short duration, such as coughing, might be more aptly targeted via acoustic signature recognition [42].
Where classifier performance is pitted against one another, the verdict rests on the inherent properties and richness of the underlying data. The outcomes reported here indicated a meaningful edge in precision for the RandomForest model over its SVC counterpart. Corroborating this, a contemporaneous paper [43] similarly concluded that Random Forests deliver stronger results than SVC when working with accelerometer-generated datasets.
The RumiWatch platform, in concert with the analytical approach outlined herein, achieves the detection of increasingly intricate movement sequences—concurrent movements among them—at a hit rate exceeding 90% compared with what today’s off-the-shelf sensors can provide. RumiWatch’s native classification assigns no more than a single motion designation to any discrete time slice. It maps head-dominant activities to the halter feed, while the pedometer captures foot-dominant activities. Throughout our experimental protocol, conversely, every motion class was evaluated separately against each sensor and also against the unified sensor pair. The data indeed showed that, under single-sensor conditions, the halter captured head-dominant activities with superior accuracy.
In contrast, foot-dominant activities were captured with superior accuracy by the pedometer. Drawing on the two sensors in unison enabled robust detection across the full motion spectrum, as the richer data foundation enabled more reliable inference. In a parallel vein, work conducted on sheep with inertial measurement modules on the jaw, neck, and leg [44, 45] reported improved classification performance across six behavioural classes when readings from two modules (jaw and leg) were combined. In scenarios restricted to a single instrument, the halter alone outperformed the pedometer when the full range of motion was considered. One potential rationale is that the animal’s cranium relays motion impulses originating in the limbs more forcefully than in the opposite direction (for example, upon rising, the head likewise shifts; however, when recumbent and engaged in cud-chewing, the legs remain inert).
On top of this, the accelerometer housed within the halter is backed up by a pressure-sensitive component, thus swelling the pool of data available to build the feature vector. Given that rumination stands as the single most critical barometer of bovine health (during health perturbations, rumination duration contracts precipitously), the adoption of a neck- or ear-borne transponder is advocated for real-world deployment. A pedometer is better suited to detecting variations in limb movement cadence or gait, as lameness is a prime example. It follows that the fused deployment of both sensor classes extends the catalogue of detectable movements and, thereby, the timely spotting of pathological conditions.
As noted earlier, the central purpose of this investigation is to test a new approach for identifying intricate, multidimensional motion patterns. Accordingly, the logical progression would involve conducting studies to corroborate these outcomes using richer, more varied data corpora, encompassing, for instance, a larger number of replicates to account for differences between individuals, alternative classifier architectures, and distinct subject types, such as other bovine categories or lactating cows.
Extra classification models could be woven into the processing pipeline so that the inquiry can be extended with additional algorithmic approaches, such as Naïve Bayes and Logistic Regression. Building on the present experiment, it would be worthwhile to scrutinise the feature vectors produced by the classifiers through ROC analysis (Fawcett, 2006). Such a technique can reveal which sensing unit, measured quantity, and derived attributes contribute most to distinguishing any given motion category. Where the calibre of the data permits, identifying a movement on the strength of just one or a very small handful of feature vector elements may become feasible.
How effectively these motion forms are detected can additionally be probed across different animal subjects, given that individuals display distinct behavioural repertoires and responses to ambient conditions. This could be undertaken with creatures of varying age brackets and both sexes. By way of illustration, charting the female bovine’s conduct in the window around oestrus or parturition holds considerable importance, particularly within production systems that rely on natural mating (with bulls) or low-input operations that forgo hormonal synchronisation protocols, settings in which pinpointing the timing of calving and conception presents a genuine difficulty [46, 47]. Should the classifiers converge on recurring behavioural signatures—such as heightened rumination and resting preceding calving or the onset of oestrus—anticipating these events could become practicable.
Additional ethologically oriented investigations are likely to yield insights into welfare and health status inferred from physiological movement patterns. An animal’s health trajectory is intimately bound up with its productive output and overall state of welfare, in that healthier specimens tend to deliver stronger performance. Earlier research efforts have produced encouraging signals when it comes to capturing behavioural perturbations in young bulls harbouring the parasite Ostertagia ostertagi [47], neonatal calves afflicted with scours [48], cattle suffering from bovine respiratory complex [49], and lactating cattle confronted with welfare and health challenges [50]. Nonetheless, a more refined algorithm with a broader palette of motion categories could amplify these findings by detecting subtle shifts in behaviour, thereby enabling the detection of emerging issues before the manifestation of clinical signs.
Harnessing non-invasive sensing apparatuses on livestock opens the door to assembling the most faithful representation of an individual animal’s current physiological state. Doing so allows the flagging of detrimental trends at a juncture where corrective intervention remains viable. In parallel, the favourable effects of any management measures become apparent and may subsequently spread throughout the entire herd.
Our findings demonstrate that the methodology trialled here can reliably discern intricate, multidimensional motion types that are significant for animal fitness and well-being. The suppression of noise, together with the joint deployment of two sensor modalities, enhances precision. The framework is amenable to expansion to register additional motion categories, a development that will aid in constructing an ever more faithful portrait of animal behavior.
The research is supported by the Hungarian National Rural Network (Magyar Nemzeti Vidéki Hálózat-MNVH): www.videkihalozat.eu, grant number [VP-20.2.-16-2016- 0001]. The authors thanked the farm owners of Gazdatrend Kft.: János HÉRI and Miklós VANCSURA, for permitting the data collection on their farm, and agronomist Zoltán ZAHORECZ for helping during the data collection.
None
None
None
Open Access The author(s) retain copyright. This article is licensed under the Creative Commons Attribution-NonCommercial-ShareAlike 4.0 International License. It may be shared and adapted for non-commercial purposes with appropriate attribution, an indication of changes, and distribution of adaptations under the same license. Third-party material may be subject to separate terms identified in its credit line. View the license at https://creativecommons.org/licenses/by-nc-sa/4.0/.
 Agro Intelligence Research Press