Precision livestock farming depends critically on the ability to identify individual animals. One practical route for marking individual livestock is freeze branding with liquid nitrogen. With the march of technological progress, deep learning pipelines have begun to be deployed for reading such individual markings. The present work introduces a deep-learning-based pipeline for the localization and interpretation of oriented horse brands. In the first stage, Rotational YOLOv5 (R-YOLOv5) was harnessed to pinpoint the oriented brand, after which YOLOv5 processed the extracted brand patches to read the digits. Within that first stage, R-YOLOv5 departed from standard detection frameworks by embedding orientation directly into the YOLO architecture through Circle Smooth Label (CSL). In addition, Coordinate Attention (CA) was woven into the network to sharpen its focus on spatial positioning cues. These design choices boosted the fidelity with which oriented brands were detected. The second stage reframed digit reading as an object-detection problem, given the need for precise identification. The full brand number was then assembled by ordering the detection boxes according to their spatial coordinates. Experimental comparisons revealed that R-YOLOv5 outpaced competing rotating target detection methods, achieving an AP (Average Accuracy) of 95.6%, FLOPs of 17.4 G, and an inference rate of 14.3 fps. The digit reading stage delivered an mAP (mean Average Precision) of 95.77%, a weight footprint of 13.71 MB, and an inference rate of 68.6 fps. Through this two-stage design, brand numbers can be read reliably even against cluttered backgrounds, offering a robust yet lightweight solution for individual livestock identification.
Modernized farming operations rest on the foundation of accurate individual animal identification [1] Beyond being the bedrock of farm management [2], it is also a prerequisite for monitoring animal behavior [3, 4] Approaches that rely on deep learning and biometric cues—such as facial features or body markings—are susceptible to external noise and require substantial computational resources. Moreover, the set of individuals they can recognize is bounded. Each time new animals enter the population, the network’s size swells exponentially, and the entire model must be retrained from scratch [5].
Manually applied individual markings serve as an alternative, with freeze branding being the method of choice on a subset of farms. Freeze branding leaves a permanent mark on livestock [6]. The technique uses liquid nitrogen to destroy melanin-producing cells while sparing the hair follicles; the regrown hair emerges white [7]. Reading such markings significantly reduces the required network size and offers greater resilience than techniques anchored in biometric traits.
The branded area typically takes the shape of an inclined rectangle. Mainstream object detection algorithms nearly always encapsulate targets within axis-aligned bounding boxes. When forced to handle oriented horse brands, these horizontal boxes fail to capture the true morphology of the brand [8]. A further drawback is that horizontal boxes bundle in a large amount of irrelevant background, which can undercut the model’s training efficacy [9]. The tighter and more accurate the annotation, the less superfluous information seeps into the training process. Arbitrary-oriented object detection was explicitly conceived for targets that exhibit directional variety and scale differences. Scene text and overhead imagery are the primary domains in which rotation-sensitive detectors have been applied. For scene text, RRPN (Rotation Region Proposal Networks) [10] generates rotated proposals via a rotated RPN and performs rotated bounding box regression. On the MSRA-TD500 benchmark, RRPN achieved 82% precision and 69 recall. Successive advances such as R3Det [11] and SCRDet [12], along with other rotation-aware detection frameworks, were deployed on remote sensing images and achieved strong results on publicly available datasets. Breaking from the dominant strategy of directly regressing box angles, Oriented RepPoints propose an adaptive point. Its mAP reached 77.63% on the DOTA aerial dataset. Rotating detection also extends to other angle-bearing object categories. [13] developed OSWSDet, a deep learning method for detecting oriented and diminutive wheat spikes in UAV images, achieving an AP of 90.5%, an RMSEz of 17.0, and an MAEz of 7.2.
The digits branded onto the horse encode its identity. The central thrust of the current work is digit recognition, a field rich with mature solutions. Traditional image-processing pipelines—template matching, threading, five-segment feature extraction, among others—tend to be brittle in the face of environmental variation and offer limited robustness. Digit recognition can also be tackled with straightforward CNN (Convolutional Neural Network) architectures; the LeNet network famously achieved 98 % accuracy on the MNIST dataset [14]. More contemporary character recognition systems generally exploit sequential feature representations, such as CRNN [15] and the aforementioned RRPN. Yet deploying such algorithms in unconstrained, cluttered real-world scenes remains a nontrivial challenge. Given how brand digits appear under realistic, messy conditions, framing the problem as an object detection task may yield a more stable and appropriate solution. To address the tendency of detection algorithms to miss or misclassify digits and decimal points on substation instruments, [16] used the YOLOv4 (You Only Look Once) object detection framework to read instrument numbers. This approach served as a reference point for this investigation.
The overriding goal of this research was to read brand numbers accurately for equine identification. A two-stage methodology was therefore formulated: R-YOLOv5 would first locate the oriented freeze brand, after which the cropped brand regions would be trained with YOLOv5 to recognize the individual digits.
Field collection took place at the Xilin Gol League Animal Husbandry Station in Inner Mongolia throughout 2021. A Mi10 device was used to capture 1012 original photographs, each measuring 3648 × 2736 pixels (Figure 1). The legibility of the digit characters was often poor. A host of unfavorable conditions plagued the dataset. As hair gradually regrew, the brands grew fuzzy and increasingly difficult to interpret. When hair heavily overlaid portions of the brand, fragmentation set in. Additionally, certain adjacent digits were prone to severe merging, further elevating the recognition difficulty.
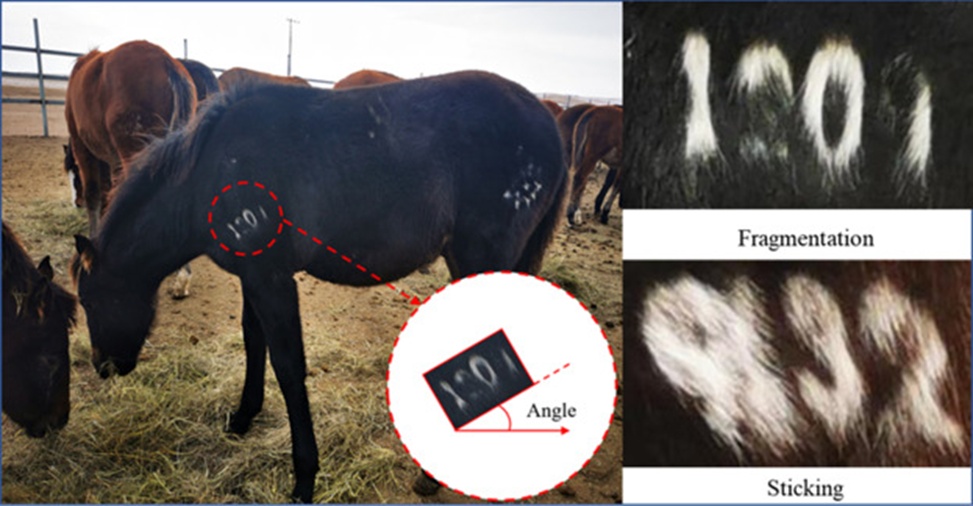
Figure 1. Brand location dataset.
An 8:1:1 split was adopted to partition the dataset into training, validation, and test sets. The original photographs were taken at distances ranging from roughly 0.4 to 2 meters from the horses, always ensuring a clear line of sight to the brand. Grouped by coat color, the horses fell into white, brown, and black categories, distributed in an approximate 1:6:5 ratio. Numerous distractors resembling brands—such as white-colored blemishes and farm insignias—appeared on the horses’ bodies. The orientation angle of the brand region was defined as the angle subtended by the x-axis and the brand’s longer side, bounded by 180°. The RoLabelImg annotation tool [17] was employed to label the oriented horse brands, and the distribution across angle classes was tabulated (Figure 2a). Since the brand is customarily applied to the left shoulder, the angle distribution was concentrated primarily in the 0–90° range.
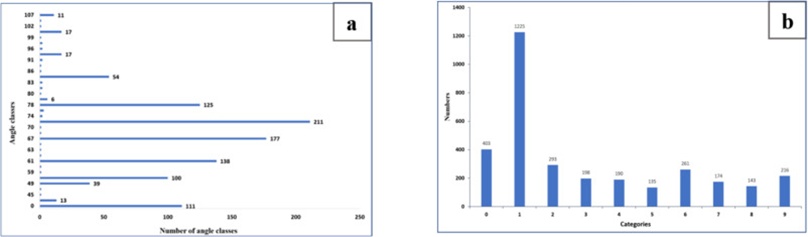
Figure 2. Statistical condition: (a) number of angle classes, and (b) number of categories from 0 to 9.
R-YOLOv5 was then tasked with automatically cropping brand regions out of the original frames. After manual curation of 979 cropped patches, these were assembled into the number recognition corpus. The same 8:1:1 training-validation-test split was applied. A frequency count of each digit class from “0” through “9” was also performed (Figure 2b). Because the brand region occupies only a tiny fraction of the original image, the resulting cropped patches had extremely limited pixel dimensions.
Figure 3 sketches the two-stage architecture that constitutes the proposed approach. Stage one deploys R-YOLOv5 to detect horse brands in raw images; its outputs are oriented bounding boxes specified by center coordinates, angular orientation, height, and width. The brand patches cropped from these detections are then handed to stage two, where YOLOv5 has been trained to perform digit recognition. Assembly of the full brand number follows from the predicted class of each digit and the positional ordering of its detection box.
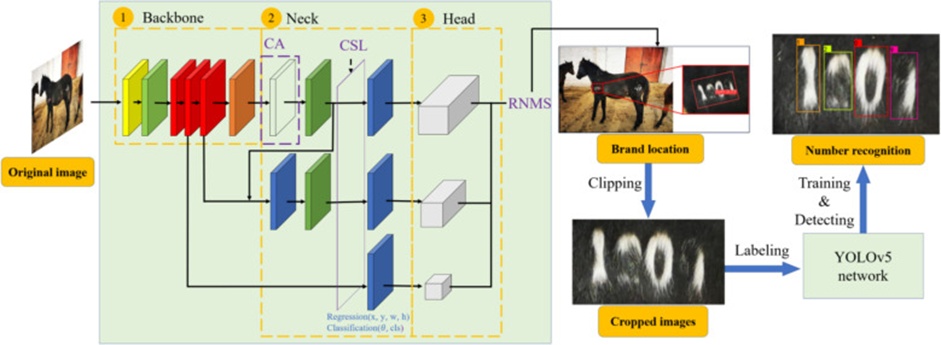
Figure 3. Overview of the proposed method.
When compared with its predecessors, the YOLOv5 object detection framework strikes a favorable balance: a compact parameter count, high inference throughput, and improved accuracy, all of which facilitate real-time detection on resource-constrained embedded platforms [18, 19]. The internal organization of YOLOv5 can be partitioned into four segments [20, 21]. Before training, incoming images of arbitrary dimensions are resized to a fixed 640 × 640-pixel canvas, a standardization that accelerates convergence. The pipeline further applies Mosaic augmentation and random affine deformations upstream of the network. Feature extraction is the responsibility of the Backbone, which is built from a cascade of residual convolutional blocks culminating in an SPP (spatial pyramid pooling) unit. Three feature maps, extracted at distinct spatial scales, are routed into the Neck for further assembly; across these maps, spatial resolution contracts while channel count expands. The Neck ultimately emits three refined feature representations. The cross-layer fusion enabled by the FPN (Feature Pyramid Networks) + PAN (Path Aggregation Network) architecture ensures that these refined representations integrate fine-grained visual detail with coarse semantic context [22]. Three YOLO Heads, acting jointly as classifiers and regressors, generate the final predictions. Boxes whose confidence falls below a configurable cutoff are eliminated, after which NMS (Non-Maximum Suppression) culls those that redundantly fire on the same object.
To transplant YOLOv5 into the rotating detection domain, one must first specify how rotating targets are formally represented. Regression-based rotation detectors are bedeviled by the issue of discontinuous decision boundaries—an artifact traceable directly to the cyclic nature of angular quantities. A different conceptual route circumvents the boundary problem by reformulating angle estimation as a classification exercise rather than a regression one. This recharacterization necessitates adding an angle classification term to the overall loss. Because orientation is taken into account, the IoU formulation for rotated boxes must be revised accordingly. Likewise, the NMS procedure must be re-engineered to sensibly suppress duplicate detections that carry distinct angular values [23].
The oriented bounding box introduces angular metadata absent in its horizontal counterpart, and it is precisely this added dimension that gives rise to the boundary discontinuity rooted in angular periodicity. Figure 4 illustrates the 180°-regression-based formulation, in which counterclockwise rotation is deemed positive, and the box angle is taken as the acute angle between the positive x-axis and the box’s long side, clamped to 90°. Under this regime, the network outputs a predicted value of α−θ against a ground truth of θ. The deviation the network is effectively penalized for is 2θ−α, whereas the genuine deviation is α. At the periodic cutoff, the loss value can surge abruptly, steepening the optimization landscape.
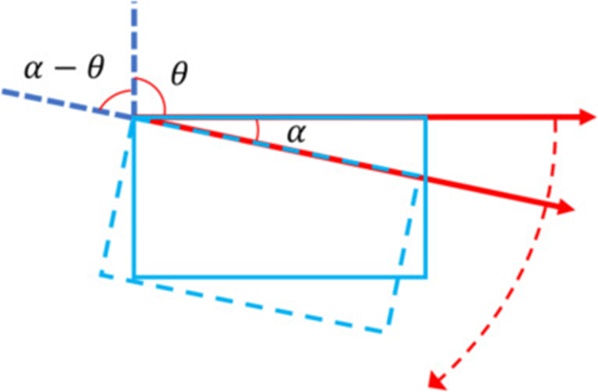
Figure 4. The 180°-regression-based method of oriented bounding box.
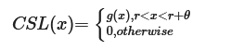
Into this gap steps CSL, which R-YOLOv5 incorporates to neutralize the boundary difficulty. CSL repositions angular prediction as a classification problem. Here, θ indexes the angular bin of the oriented box, with each integer degree treated as a distinct class—180 classes in total. The oriented box is parameterized through the tuple (x, y, w, h, θ), where (x, y) pinpoints the box center, w and h denote the short-edge and long-edge lengths, respectively, and θ is dictated by the alignment of the long edge (h) with the x-axis. Eq. 1 provides the CSL functional form.
 (1)
(1)
Within this expression, g(x) stands for a window function endowed with periodicity and symmetry, and r controls the window radius. Four attributes characterize an ideal window function: periodicity, symmetry, a ceiling (g(x) < 1), and monotonicity. Gaussian functions, which satisfy the full set of desiderata, were chosen.
The periodic nature of the window function resolves the boundary problem. Two angles positioned on opposite sides of a boundary can still have their true angular separation faithfully gauged by the model, even when they are numerically far apart.
Standard YOLOv5 optimizes a multi-task loss that consolidates Localization Loss, Classification Loss, and Confidence Loss [24]. R-YOLOv5 augments this with an Angle Classification loss. Taking a cue from [25], R-YOLOv5 employs RIOU (Figure 5), a metric that captures the overlap-to-union ratio specific to oriented detection boxes.
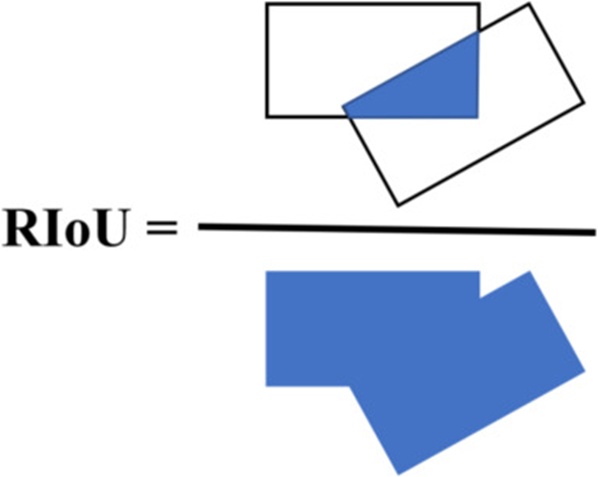
Figure 5. RIoU of two rotated boxes.
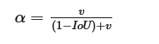
For Localization Loss, YOLOv5 defaults to CIoU (Complete Intersection over Union) Loss, detailed in Eq. 2. CIoU Loss addresses the issue of gradient propagation when anchor and target boxes are disjoint. It also avoids the ambiguity in which boxes of differing sizes yield identical IoU scores despite dissimilar overlap configurations [26]. In R-YOLOv5, the standard IoU is replaced with RIOU when computing CIoU.
 (2)
(2)
 (3)
(3)
 (4)
(4)
In this expression, l(Ob,Ogt) measures the Euclidean distance between the centroids of the anchor box and the ground-truth box; wgt and hgt specify the ground-truth box dimensions, while wb and hb specify the anchor box dimensions.
Concerning Angle Classification Loss, the ground-truth angle label is first transformed via CSL before the loss is evaluated.
Classification Loss, Confidence Loss, and Angle Classification Loss are all realized through BCE (Binary Cross Entropy) loss.
Conventional NMS is widely deployed to eliminate superfluous horizontal detection boxes [27]. The difficulty is that oriented brands each possess a unique angular attribute, and standard NMS is ill-equipped to adjudicate among them correctly. The RNMS algorithm was therefore introduced to weed out redundant oriented detection boxes [25]. Its operational steps are as follows.
Step 1: All predicted rotated boxes are ranked in descending order of their confidence scores, forming an ordered sequence.
Step 2: The sequence is traversed from the top. For the current rotated box, RIOU is computed against each remaining box below it in the list. Those whose RIOU exceeds a designated cutoff are discarded.
Step 3: From the boxes that survive this filtration, the one with the highest score is promoted, and the process loops back to Step 2.
The very inclusion of angular extent in an oriented box—information that a horizontal box lacks—tends to erode spatial precision. To remedy this, the CA attention mechanism [28] was inserted between the C3_1 and SPPF blocks in the network. The internal design of CA is shown in Figure 6. It splits global pooling into a pair of one-dimensional feature-encoding streams. These two branches compress features along the horizontal and vertical axes independently, producing paired feature maps that are simultaneously directionally tuned and position-sensitive. In doing so, they capture long-span dependencies along one coordinate while conserving exact positional detail along the other, empowering the model to pinpoint objects of interest with heightened accuracy.
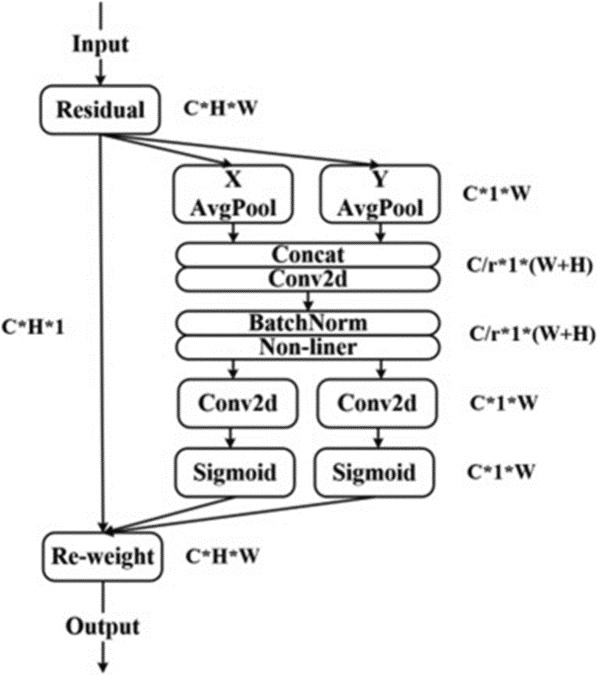
Figure 6. CA structure.
The experimental work was executed on a workstation powered by two Intel(R) Xeon(R) Gold 5217 CPUs running at 3.00 GHz, equipped with an Nvidia Tesla V100-PCIE-32GB graphics accelerator (32 GB VRAM) and 500 GB of RAM. The software stack consisted of Ubuntu 18.04.5 as the operating system, PyTorch 1.8 as the deep learning framework, PyCharm as the integrated development environment, and Python 3.8 as the implementation language. All benchmarked algorithms were subjected to the identical hardware and software configuration.
The established object detection metrics—P, R, and mAP—were applied to assess the trained models’ capabilities [29]. The IOU metric quantifies the overlap between the predicted and ground-truth boxes. Within the brand localization task performed by R-YOLOv5, IOU specifically refers to the RIOU formulation described earlier. Predictions are classified into outcome categories according to their IOU: an IOU of 0.5 or above qualifies as a true positive (TP), an IOU below 0.5 is deemed a false positive (FP), and an IOU of exactly zero constitutes a false negative (FN) [30].
P gauges prediction fidelity, expressing what proportion of all positively flagged samples are genuinely positive (Eq. 5).
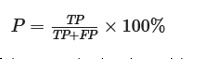 (5)
(5)
R, by contrast, is oriented toward the ground-truth population and conveys the proportion of actual positive instances successfully recovered (Eq. 6).
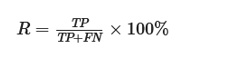 (6)
(6)
AP is the integral beneath the P-R curve and is estimated through interpolation (Eq. 7); larger AP values correspond to greater model accuracy.
 (7)
(7)
mAP—the mean across category-level APs—functions as an omnibus performance metric (Eq. 8).
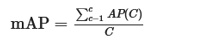 (8)
(8)
In this notation, C denotes the number of detection categories. Since brand localization involves a single category, mAP collapses to AP. For digit recognition, numerals “0” through “9” define C = 10.
Model footprint and inference throughput (Frames Per Second, FPS) were also incorporated into the assessment. FLOPs (Floating-Point Operations Per Second) serve as a proxy for model size. Weight file size provides a partial, though not fully commensurate, indication of model bulk.
The SGD (Stochastic Gradient Descent) optimizer governed the learning rate schedule during training [31] The learning rate was initialized at 0.01, and mini-batches of size 8 were used. A weight decay coefficient of 0.0005 and a momentum term of 0.9 were applied. Training extended across 300 epochs. The Nano edition of YOLOv5 was chosen for its ability to match the accuracy of larger variants while offering superior speed.
The trajectories of each loss component and performance indicator during training are plotted in Figure 7. In the earliest phase, all loss quantities decreased rapidly. Owing to the presence of only a single target class, Classification Loss remained fixed at zero. By epoch 20, Confidence Loss had fallen to 0.01, signifying that the predicted boxes were assigned high target-presence probabilities. Angular Classification Loss and Localization Loss both descended to 0.1 at epoch 100, reflecting the model’s acquisition of strong positional fidelity. Learning was effectively saturated by epoch 200, at which point P, R, and mAP reached approximately 86%, 91%, and 90%, respectively.
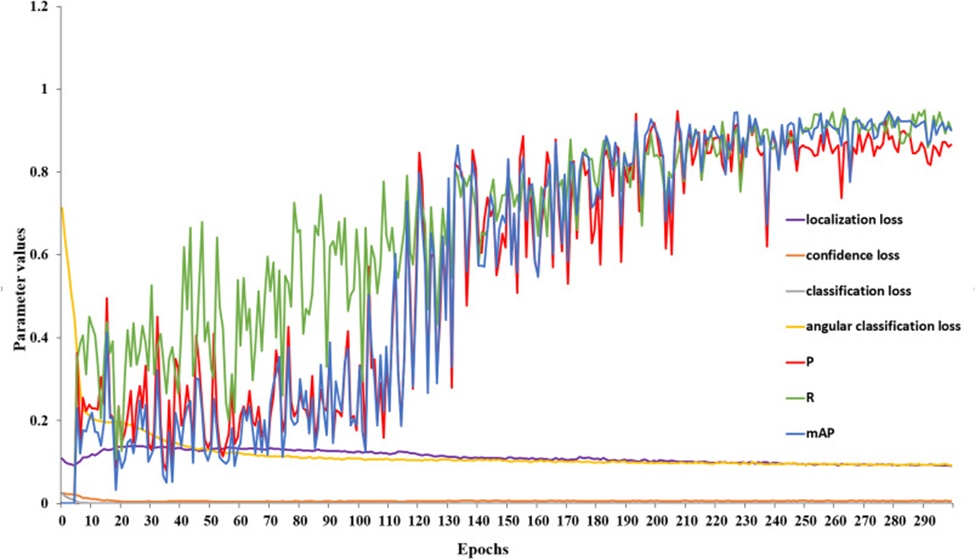
Figure 7. Training curves of R-YOLOv5.
When the trained model was evaluated on the test partition, it achieved P, R, and AP scores of 94.9%, 94.0%, and 95.6%, respectively. The weight file was 14.6 MB, and the inference speed was 14.3 fps. Figure 8 displays sample detections produced by the trained model under conditions spanning varied coat pigmentation, different standoff distances, and scenes containing multiple targets. Across all settings, the oriented prediction boxes consistently enclosed the horse brands with high confidence. These findings confirm that R-YOLOv5 can robustly localize horse brands across a spectrum of challenging conditions.
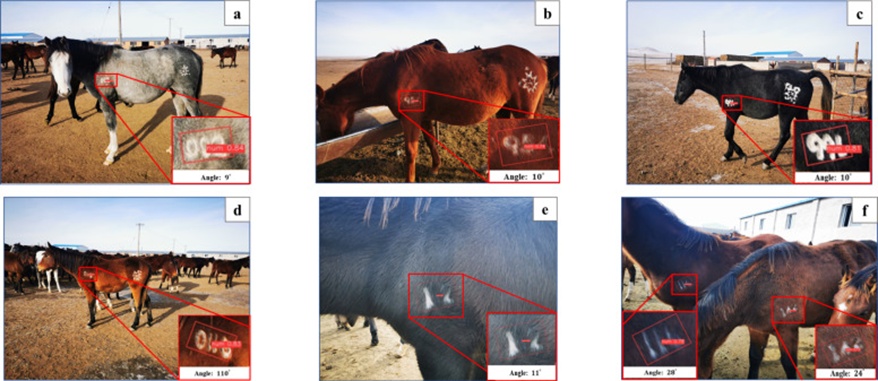
Figure 8. Effects under different conditions: (a) white hair, (b) brown hair, (c) black hair, (d) far distance, (e) short distance, and (f) multiple brands (For interpretation of the references to colour in this figure legend, the reader is referred to the web version of this article).
A comparative evaluation was conducted against three alternative rotated detection architectures—RetinaNet (CSL-Based) [32], R3Det, and Rotated Faster R-CNN [33]—to confirm the practical value of R-YOLOv5 for brand localization. Each competing algorithm was trained on the identical dataset under the same hardware and software conditions. The resulting performance figures, measured on the test partition, are assembled in Table 1 alongside those of R-YOLOv5.
Table 1. Comparison between the proposed method and other oriented object detection approaches.
Algorithm | AP (%) | FLOPs /G | Detection speed (fps) |
RetinaNet (CSL-Based) | 90.7 | 236.3 | 0.6 |
R3Det | 90.7 | 333.2 | 2.1 |
Rotated Faster R-CNN | 90.6 | 198.4 | 9.1 |
R-YOLOv5 | 95.6 | 17.4 | 14.3 |
Across the four detection frameworks, the AP scores were 90.7%, 90.7%, 90.6%, and 95.6%, respectively. Their computational budgets, expressed as FLOPs, were 236.3, 333.3, 198.4, and 17.4 G, while frame processing rates were 0.6, 2.1, 9.1, and 14.3 fps, respectively. Put differently, R-YOLOv5 surpassed RetinaNet (CSL-Based), R3Det, and Rotated Faster R-CNN by AP margins of 4.9, 4.9, and 5.0 percentage points. Its FLOPs were lighter by 218.9 G, 315.8 G, and 181.0 G relative to those three baselines. The throughput advantage stood at 13.7 fps over RetinaNet (CSL-Based), 12.2 fps over R3Det, and 5.2 fps over Rotated Faster R-CNN.
What these numbers collectively demonstrate is that R-YOLOv5 not only claimed the highest AP—satisfying the core requirements of brand localization—but also operated with a markedly leaner computational profile and brisker inference cadence, attributes that strongly favor downstream model migration onto practical platforms.
Once the brands had been localized in the prior stage, 979 brand patches were automatically extracted from the source imagery to serve as the number recognition corpus. The optimization hyperparameters were set to a learning rate of 0.01, a batch size of 32, a weight decay of 0.01, and a momentum of 0.9. The network underwent 300 training epochs.
Table 2 summarizes the metrics logged when the trained model was run against the test set. The mAP was 95.77%, the weight file was 13.71 MB, and inference ran at 68.6 fps.
Table 2. Evaluation results of the trained model on the test dataset.
Class | Precision (%) | Recall (%) | AP (%) |
0 | 100 | 95.74 | 97.74 |
1 | 99.30 | 97.93 | 99.95 |
2 | 92.86 | 100 | 99.86 |
3 | 85.71 | 85.71 | 79.59 |
4 | 100 | 100 | 100 |
5 | 85.71 | 92.31 | 92.31 |
6 | 90.32 | 96.55 | 97.91 |
7 | 94.12 | 100 | 100 |
8 | 100 | 85.71 | 90.36 |
9 | 96.15 | 100 | 100 |
Sample model outputs are visualized in Figure 9, where digits receive correct class assignments within tightly fitted bounding boxes across the spectrum of coat colors. The displayed images also contain instances of degraded character quality—blurring, conjoined strokes, and fragmented numeral segments. Even under these adverse conditions, YOLOv5 detected the brand numbers without error, underscoring that the object detection formulation has sufficient resilience to cope with such complex real-world variability.

Figure 9. Detection effects under different hair colours: (a) white hair, (b) brown hair, and (c) black hair (For interpretation of the references to colour in this figure legend, the reader is referred to the web version of this article).
Errors of both the false-positive and false-negative variety surfaced in the brand localization and number recognition tasks alike. Figure 10 flags these failure cases with red arrow markers.
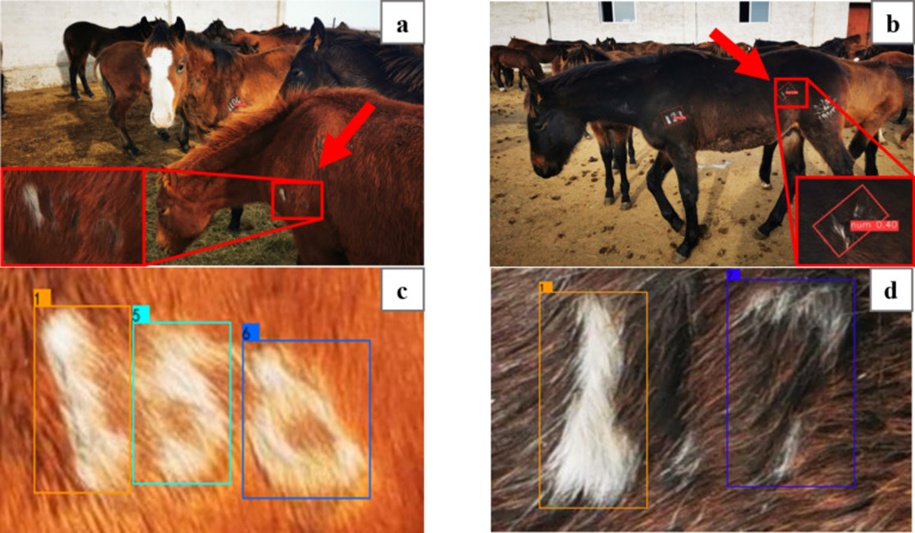
Figure 10. Problems of false-detection and miss-detection: (a) brand false-detection, (b) brand miss-detection, (c) number character false-detection, and (d) number character miss-detection.
The origins of brand-level false and missed detections can be traced to the following: (1) Naturally occurring white patches on the horse’s coat act as visual confounds, closely mimicking the appearance of a brand and thereby provoking false alarms (Figure 10a). This distinction strains even the model’s discriminatory capacity. (2) The particular brand flagged as missed in Figure 10b is captured from an extremely acute viewing angle, and the mark itself has deteriorated into a blur so severe that it confounds human visual interpretation.
Within the number recognition stage, plausible explanations include: (1) Morphological similarities between certain numeral classes—most notably 6 and 8 (Figure 10c)—blur the inter-class boundaries for the model. (2) The same degradation pattern of character-level blurring recurs (Figure 10d).
It should be emphasized that these erroneous detections are concentrated in extreme outlier scenarios that remain within tolerable limits. Under routine field conditions, the system reads brand numbers without fault.
The landscape of established digit recognition techniques includes template matching, threading-based methods, and related classical pipelines. Lightweight CNN models such as LeNet and AlexNet [34] also represent viable options. The binding constraint across all these approaches, however, is that they operate on isolated single characters, meaning a segmentation preprocessing stage is mandatory before recognition can commence.
Newer paradigms for character recognition are predominantly sequence-driven—PRNN and CRNN stand as prominent examples—and they deliver impressive results on scene text benchmarks. Their Achilles’ heel lies in handling irregular, deformed characters set against noisy real-world backdrops. Furthermore, these pipelines incur unnecessary processing overhead, resulting in sluggish throughput and exacting expectations for input image fidelity. A telling data point from the present study: a CRNN-based recognizer achieved a paltry 30.6% accuracy on the same number recognition dataset, a figure wholly inadequate for the demands of faithful brand number transcription.
What sets digit recognition apart from the recognition of alphabetic scripts or Chinese characters is the exceedingly compact label space—a mere ten classes. This property makes the problem a natural fit for object-detection formulations. Accordingly, YOLOv5 was pressed into service for number recognition in this work, a choice motivated by its well-known trifecta of high predictive accuracy, rapid inference, and deployment simplicity.
To illuminate the rationale behind the two-stage design, a direct end-to-end baseline was constructed: both R-YOLOv5 and classical YOLOv5 were trained on the original, uncropped images, with each digit individually annotated in place (Figure 11). Training hyperparameters were identical to those used in the brand localization experiments.
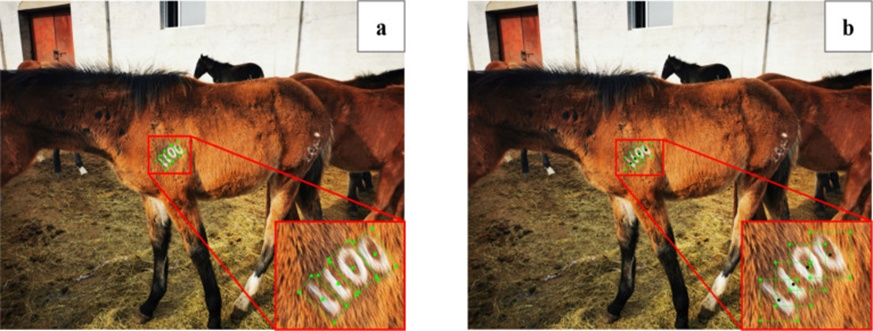
Figure 11. Direct labeling methods: (a) R-YOLOv5 and (b) classical YOLOv5.
Post-training evaluation on the test set yielded digit-wise AP scores for “0” through “9” under both R-YOLOv5 and classical YOLOv5 (Table 3). The aggregate mAP for R-YOLOv5 was only 22.9%, while classical YOLOv5 achieved 84.37%. Tellingly, the AP for every single-digit class from 0 to 9 under the direct training regime fell beneath the corresponding figure obtained when training on cropped brand patches. Detection accuracy at these levels cannot support the precision required for reliable horse brand reading. The direct strategy also triggered a proliferation of missed and spurious detections.
Table 3. AP values range directly from “0” to “9”.
Class | AP values (%) | |
R-YOLOv5 | Classical YOLOv5 | |
0 | 37.1 | 83.91 |
1 | 80.6 | 92.37 |
2 | 14.7 | 93.04 |
3 | 5.8 | 75.15 |
4 | 19.1 | 79.28 |
5 | 7.9 | 85.71 |
6 | 21.9 | 93.99 |
7 | 4.5 | 91.35 |
8 | 33.8 | 96.74 |
9 | 3.8 | 80.14 |
A confluence of factors likely drove these disappointing outcomes. First, the feature signature of an isolated digit is far weaker than that of the entire brand region, rendering the model more susceptible to being fooled by visually similar bodily artifacts. Second, the full-frame images teem with irrelevant visual clutter, and distilling discriminative features from such a complex background poses a formidable learning obstacle. Third, the orientation distribution across separate digit characters within a single frame is wider than that of the brand as a cohesive unit, further complicating training. Fourth, the direct paradigm cannot associate a group of detected digits with the specific horse that bears them; it merely spots numbers without performing the crucial binding step that links a number sequence to its host animal.
Taken together, these observations validate the two-stage architecture pursued in this research. Isolating the brand region via cropping enabled the oriented detection box to enclose the horse brand tightly, capturing its true geometric form while discarding surrounding background noise. This approach proved unequivocally superior for digit detection compared to the monolithic, single-pass alternative. Trading away a modest amount of inference speed was a justified cost for the substantial gains in detection fidelity and overall reliability.
(1) CSL was deactivated during data preprocessing to assess its contribution, at which point AP fell to 78.7%, a drop of 16.9%. Without CSL, the remaining modifications within R-YOLOv5 can still perform oriented object detection by treating angle prediction as a classification task. Still, they lack the means to compute angular separation between predictions and ground truth, and the boundary discontinuity problem remains unaddressed. CSL introduces a circular encoding scheme based on periodicity, in which assigned label values are smoothed and incorporate a degree of tolerance [35].
(2) When the CA block was removed, brand localization accuracy settled at 92.5%. The CA block operates by distilling and fusing features via a pair of complementary one-dimensional encoding pathways; its inclusion lifts AP by 3.1%. The parameter overhead introduced by the CA block amounts to a mere 0.7% increase, a cost that is negligible compared to the corresponding gain in network recognition performance.
Beyond CA, the SE, ECA, and CBAM attention mechanisms were also evaluated through comparative experiments. Table 4 collates the outcomes, with CA securing the highest AP—surpassing SE by 2.9%, ECA by 0.7%, and CBAM by 0.4%. While the numerical advantage of CA over ECA and CBAM was modest, its rotated detection boxes demonstrated superior alignment with real-world object orientations during actual inference, a benefit attributable to CA’s intrinsic sensitivity to spatial direction and positional cues.
Table 4. AP values of R-YOLOv5 with different attention mechanisms.
Attention mechanisms | SE | ECA | CBAM | CA |
AP (%) | 92.7 | 94.9 | 95.2 | 95.6 |
For the task of reading horse brands, a deep-learning-based two-stage methodology was put forward. The principal findings of this investigation can be distilled as follows:
(1) By integrating CSL into the YOLO framework, R-YOLOv5 captured the geometric shape of the branding region more faithfully than classical YOLOv5 and outperformed other rotating target detection algorithms. It achieved an AP of 95.6%, FLOPs of 17.4 G, and an inference rate of 14.3 fps. This level of accuracy proved sufficient for R-YOLOv5 to cleanly extract brand patches from the source images, preparing them for the subsequent number recognition phase.
(2) Given the stringent requirement for exact identification, the number recognition stage abandoned conventional character recognition pipelines and instead reformulated the problem as an object detection task. The YOLOv5 model trained for digit recognition achieved an mAP of 95.77%, a weight footprint of 13.71 MB, and a processing rate of 68.6 fps. Compared with annotating brand digits directly on the original, uncropped images, training on extracted brand patches was better aligned with the demands of precise recognition.
(3) The 180 discrete categories CSL employs for angle classification inevitably increase the network’s parameter count and slow down training. A promising direction for future investigation is to devise a fundamentally new representation for rotating targets—one that eliminates the boundary problem at its root without resorting to framing-angle prediction as a classification task.
This work was supported by the National Key Research and Development Program of China (Grant No. 2023YFD1301801) and the National Natural Science Foundation of China (No. 32272931). The authors appreciate the funding organization for its financial support. The study was approved by the Medical Ethics Committee (MEC) of the NWAFU Experimental Animal Management Committee of Northwest A&F University. The authors would also like to thank the helpful comments and suggestions provided by all the authors cited in this article and the anonymous reviewers.
The authors declare that the research was conducted in the absence of any commercial or financial relationships that could be construed as a potential conflict of interest.
None
None
Open Access The author(s) retain copyright. This article is licensed under the Creative Commons Attribution-NonCommercial-ShareAlike 4.0 International License. It may be shared and adapted for non-commercial purposes with appropriate attribution, an indication of changes, and distribution of adaptations under the same license. Third-party material may be subject to separate terms identified in its credit line. View the license at https://creativecommons.org/licenses/by-nc-sa/4.0/.
 Agro Intelligence Research Press