Vegetation cultivated in aquaponics environments is prone to multiple diseases or biotic pressures throughout its development, similarly to conventional farming. Timely identification of these diseases is essential to maintaining the effectiveness of the aquaponics setup and advancing its development. Aquaponics merges recirculating aquaculture with soilless hydroponic cultivation and has the potential to ensure food security, alleviate water shortages, and reduce carbon emissions. To facilitate the widespread adoption of this agricultural method, an integrated platform is required to identify plant ailments and assist scientists and growers in identifying potential causes and remedies at an early stage. This research introduces an automated plant diagnostic framework for recognizing biotic pressures and controlling diseases in four leafy green vegetables—lettuce, basil, spinach, and parsley—cultivated within an aquaponics environment. Initially, a collection of 2640 images is assembled. Subsequently, a disease identification system operating in three stages is created. The initial stage involves a crop classification mechanism that determines the plant species. The second stage comprises a disease identification mechanism that assesses the plant’s health condition. The concluding stage is a disease-detection mechanism that pinpoints diseased and healthy areas on foliage and classifies the illness. The suggested method has yielded encouraging results, achieving accuracies of 95.83%, 94.13%, and 82.13% in the three stages, respectively. The ultimate disease-detection mechanism is then combined with an ontology framework via a cloud-based interface. This ontology framework includes domain expertise concerning plant pathology, specifically the origins and remedies for various ailments of the examined leafy green vegetables, which can be automatically retrieved upon illness detection, enabling farm operators to implement preventive actions. The suggested application is important as a decision-support tool that automates health surveillance in aquaponics facilities and helps agricultural practitioners make decisions on crop and disease control.
An aquaponic setup is the fusion of two established technologies: a recirculating aquaculture system (RAS) and a hydroponic system (soilless plant cultivation), operating together within a unified system [1]. The principle behind this soilless cultivation method is the mutual benefit of shared resources, including water and nutrients, between fish farming and crop growing. Fish consume feed and expel waste containing ammonia (NH3+) along with other elements, which specific microorganisms then transform into nitrates (NO3−). This nutrient-laden effluent is then circulated to the hydroponic section of the setup, where nutrients are readily available for absorption. Based on this core concept, aquaponics can be regarded as an environmentally friendly and sustainable method of food production [2].
Despite the numerous benefits of this emerging technology, several obstacles require particular attention, especially regarding its large-scale deployment. Operating as a greenhouse and a mutually beneficial environment, the variables and elements (light, temperature, pH, moisture, etc.) requiring regulation are numerous [3]. For the system to operate effectively and efficiently, a careful balance among these variables must be maintained [4]. Ideal conditions must be met for the growth and maturation of all three organism types in the system (fish, microbes, and plants). Another major hurdle involves crop ailments stemming from either nutritional shortfalls or improper system oversight, affecting crop quality and resulting in plant loss [5, 6]. As noted by [7], recognizing crop diseases and implementing disease control measures are essential to avert reductions in both output and the quantity of agricultural goods. Consequently, early detection of disease onset is vital to advancing aquaponics operations. Traditionally, plant diagnosis is carried out by agricultural professionals who visually inspect the foliage. This method, however, tends to be subjective, damaging, slow, and labor-intensive [8].
Furthermore, it requires that experts have a deep familiarity with a wide range of diseases, their signs, and treatments [9]. Alternative techniques include chemical testing, leaf color chart (LCC) comparison, soil plant analysis development (SPAD), hyperspectral imaging, and spectral remote sensing, all of which are either labor-intensive, expensive, or harmful [10]. To tackle these issues, diverse automated crop disease identification platforms built upon artificial intelligence (AI) methods like machine learning and deep learning have been created, as they provide non-contact, fast, eco-friendly, and precise means for performing a non-destructive assessment of plant well-being and condition [11, 12]. Deep learning techniques present two notable benefits over machine learning approaches. First, the feature extraction step is performed automatically, and second, the time required to handle extensive high-dimensional datasets is greatly reduced [11].
Beyond illness identification, it is equally critical that farm operators and investigators have access to pertinent data concerning crop management approaches, enabling them to select methods and treatments suitably to avert diseases, thus securing both financial and ecological advantages [13]. Typically, such data is scattered across multiple sources — creating a need for a consolidated model that houses knowledge about the origins and remedies of various crop ailments. Semantic tools such as ontologies have demonstrated effectiveness for information integration across various fields [14]. An ontology constitutes a formal, explicit description of a shared conceptualization [15]. The logical foundations of ontological models enable autonomous entities to understand the data they handle [16]. Ontologies can be used to build a knowledge repository containing pertinent details on causes and recommended remedies for crop diseases, which can be accessed upon illness detection [14]. Armed with this information, farm practitioners can obtain clear directions for efficiently carrying out crop surveillance and disease management.
In this research, an automated deep learning platform is introduced to identify and classify illnesses in four leafy green vegetables—lettuce, basil, parsley, and spinach—grown in an aquaponics system. Utilizing semantic tools, an ontology model named ‘AquaONT’ was previously created by the authors [3], which encompasses knowledge regarding the origins and remedies of various ailments. This ontology model is combined with a disease identification platform via an interface built on a cloud-based application.
The remainder of the document is organized as follows. First, the latest research on crop disease identification platforms is reviewed, followed by an outline of the methodology used to develop the proposed system. The experimental outcomes and observations are then examined, and the paper concludes with a discussion of the main findings and future directions.
Rapid breakthroughs in artificial intelligence have triggered a transformative leap in deep learning (DL) and computer vision (CV), tackling complex problems ranging from image classification, object detection, speech recognition, and voice recognition to natural language processing and medical imaging [1, 17]. Convolutional neural networks (CNNs), in particular, have proven their value across domains such as automotive, healthcare, and retail and are increasingly being applied in agriculture for automated crop disease identification, serving as a credible alternative to traditional approaches [18]. A variety of models and applications for crop disease recognition and diagnosis have surfaced in recent years. This segment delves into some of the most current contributions in the literature.
[19] developed a deep convolutional neural network (DCNN) framework for automated recognition and classification of diverse biotic and abiotic paddy crop stresses, employing the pre-trained Visual Geometry Group (VGG) model VGG-16 [19]. Field imagery captured during the booting growth stage is utilized in their approach. [11] proposed a hybrid architecture combining a convolutional autoencoder (CAE) with a CNN to automatically detect bacterial spot disease in peach plants from leaf images sourced from the publicly accessible ‘PlantVillage’ dataset. [20] engineered a CNN-based method that harnesses the pre-trained VGG-16 to distinguish healthy, unhealthy, and diseased leaves across tomato and grape plants. [21] merged ResNet with Faster R-CNN, R-FCN, and SSD, delivering a technique for detecting diseases and insect pests in tomato plants that achieved effective identification of 9 distinct disease and pest types. [22] proposed a method for rice plant disease detection based on the DenseNet model of deep transfer learning.
To detect cucumber disease spots in greenhouses, [23] developed a CNN-based system that combines a compound color feature with a region-growing algorithm. A disease recognition algorithm anchored in VGGNet and InceptionV3, with trimmed model size and boosted recognition accuracy, was advanced for rice plants. [24] presented a disease classification algorithm based on a refined VGG network for accurate and rapid identification and classification of spots on potato crops. [25] proposed an improved CNN-based method for recognizing nine common corn diseases from image sets with complex backgrounds. [9] rolled out an apple disease detection system operating in two steps. The first step, driven by the Xception model, determines whether a leaf is healthy or diseased, while the second step, built on Faster-RCNN, handles disease detection.
[26] introduced a disease recognition system leveraging an enhanced YOLOv5 model with an incorporated squeeze-and-excitation (SE) module to pinpoint tomato virus diseases under greenhouse conditions. [27] formulated a deep learning model that fused RNNs and CNNs for disease classification and early forecasting in Plantain trees. [28] described a deep learning-based tomato disease detection strategy that leverages a Conditional Generative Adversarial Network (C-GAN) to generate synthetic images of tomato plant leaves. A DenseNet121 model was subsequently trained on both synthetic and real images via transfer learning to sort tomato leaf images into ten disease categories. An efficient detection model (EFDet), comprising an efficient backbone network, a feature fusion module, and a predictor, was proposed by [29] for detecting cucumber leaf diseases amidst complex backgrounds. In a similar vein, a YOLOv5-based disease detection model was developed to identify bacterial spot disease in bell pepper plants using leaf symptoms [30].
A framework tailored for an aquaponics system was put forward based on image processing and decision tree methodology, carrying out disease detection across four leaf species—eggplant, chilli, citrus, and mandarin—and auto-generating a report sent to the owner through a mobile app if a disease is found [13]. Along the same lines, a CNN-based strategy for detecting plant disease in smart hydroponics provides farmers with a tool capable of performing the duties of an agricultural extension worker, achieving even higher precision [31]. An application that uses image processing and SVMs was developed to classify apple diseases [32]. [33] developed a model based on Faster R-CNN with the Inception V2 architecture to recognize diseases in hydroponic lettuce.
The literature survey has shown that researchers have widely deployed deep learning techniques for plant or crop disease detection and classification. Scrutiny reveals that most disease-detection systems are designed for open-air farms. Only isolated systems are suitable for modern farming setups such as aquaponics or hydroponics. The bulk of models address multiple diseases within a single crop. Furthermore, to the best of the authors’ knowledge, no all-encompassing, unified disease-detection system has been developed for identifying diseases across several leafy green crops cultivated in aquaponics facilities.
Disease detection in leafy greens introduces multiple obstacles. For one, the foliage of different leafy green crops closely resembles each other, which may undermine the detection system’s accuracy. Secondly, differing light conditions during image capture can make the visual indicators of distinct diseases appear similar. Another bottleneck is the shortage of leafy green crop datasets suited for disease detection. Deep learning models demand vast amounts of training data, and to the best of the authors’ knowledge, no sufficiently large-scale open-source dataset is available to underpin this research. A handful of datasets exist, among them PlantVillage, PlantDoc, and CropDeep [34-36] PlantDoc and PlantVillage are open-source collections that lack categories devoted to leafy green crops. The CropDeep dataset contains images of specific leafy greens, but it is not open source. Finally, none of the systems mentioned above supply information on the causes and treatments of detected diseases.
Beyond AI methodologies, ontology-based systems have also been cultivated over the years for plant disease diagnosis and treatment guidance. [37] developed an ontology-driven expert system, ‘RiceMan’, for disease identification and control recommendations in rice crops. In a comparable effort, [14] proposed a decision-support system based on an ontology model for crop pest and disease recognition, which also provides details on agricultural practices and sanctioned pest control measures. Within these systems, users are obliged to manually pick the crop and observe symptoms from a list to proceed, an inherently time-intensive step. In deep learning models, however, such information can be extracted directly by analyzing crop images. Deep learning techniques can be integrated with ontology models to build efficient decision-support systems for crop disease management. The notion of marrying these two techniques is still relatively fresh in the agriculture domain. Consequently, scant work has been conducted in this vein, with the limited existing efforts largely focused on enabling smart services (monitoring and control) in IoT-based farming systems or on detecting cyber-attacks [3].
With these research gaps and potential opportunities in mind, this study aims to build a high-quality dataset of RGB images (healthy and diseased) of four leafy green crops: little gem romaine lettuce, spinach, parsley, and basil. This study further endeavors to develop a crop diagnostic system anchored in deep learning and ontology models to detect diseases and pinpoint causes and potential treatments for the stated crops, respectively.
Figure 1 presents a block diagram of the three successive modules that constitute the research methodology. The first module handles dataset construction alongside the training of classification and object detection models. Functionally, the disease detection system unfolds across three phases. Phase one and phase two each use compact classification models—the former to determine which of the four crops is present, and the latter to assess whether that crop is healthy or ailing. Phase three serves as the detection tier, deploying an object detection model to locate and demarcate healthy and unhealthy regions on leaves and to sort diseased areas by type. Placing two classification phases upstream of the detection phase serves three distinct purposes.
To begin with, it improves detection reliability by suppressing spurious detections that could otherwise occur when the model is forced to simultaneously spot and classify disease lesions of widely differing sizes. Next, it allows the system to pull up design-relevant attributes of the crop identified in phase one by querying the knowledge model. Finally, it reduces total computational overhead by discarding irrelevant inputs during the second phase. The second module is dedicated to retrieving instances of pertinent classes—including probable triggers and suggested interventions for diagnosed diseases—from ‘AquaONT,’ an ontology model the authors constructed in earlier work [3]. The third module delivers a cloud-deployed application coded in Streamlit1, hosting both a pre-trained disease-detection model and an ontology model to form an end-to-end crop diagnostic pipeline. After the system settles on a crop identity in phase one, it fetches from the ontology—via OWLready22, a Python package designed for ontology-oriented programming—the crop’s profile regarding ideal environmental settings (pH, temperature, light intensity, etc.), growth metrics (width, height, area, etc.), and grow bed layout (inter-plant spacing) for aquaponic operations. The authors have previously published work highlighting design parameters as indispensable intelligence for safeguarding high yields and product excellence in aquaponic installations [1]. In the same vein, following disease detection and classification in phase three, the system extracts plausible causes and recommended courses of action from the ontology model. The subsections below unpack each component of every module in depth.
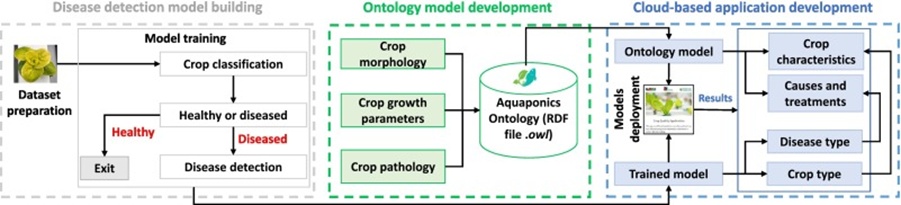
Figure 1. Proposed methodology for disease detection and control recommendation system.
Assembling the dataset entails three sequential activities: i) data acquisition, ii) data annotation, and iii) data augmentation, each elaborated below.
Four leafy green species form the focus of this investigation: lettuce, basil, parsley, and spinach. The compiled dataset encompasses both vigorous and symptomatic specimens of these crops, procured through a variety of channels, including the NFT-based aquaponics rig installed in the AllFactory 4.0 Lab (University of Alberta, Canada), queries on the Google search engine, and Ecosia3 (a search provider operating out of Berlin, Germany). The ailments covered for the four crops in the dataset are listed below.
• Lettuce: Bacterial leaf spot and Downy mildew
• Basil: Downy mildew
• Parsley: Septoria leaf spot
• Spinach: Downy mildew and Stemphylium leaf spot
To render the model more robust in correctly classifying and detecting disease, deliberate effort was made to incorporate images with non-uniform backdrops, varied lighting conditions, and multiple stages of symptom progression [38]. The collection effort yielded 2,000 images across all sources. Out of these, 800 represented healthy specimens (200 per crop), while the remaining 1200 captured the diseases enumerated above (240 per disease). Figure 2 offers a glimpse at selected sample images drawn from the dataset.
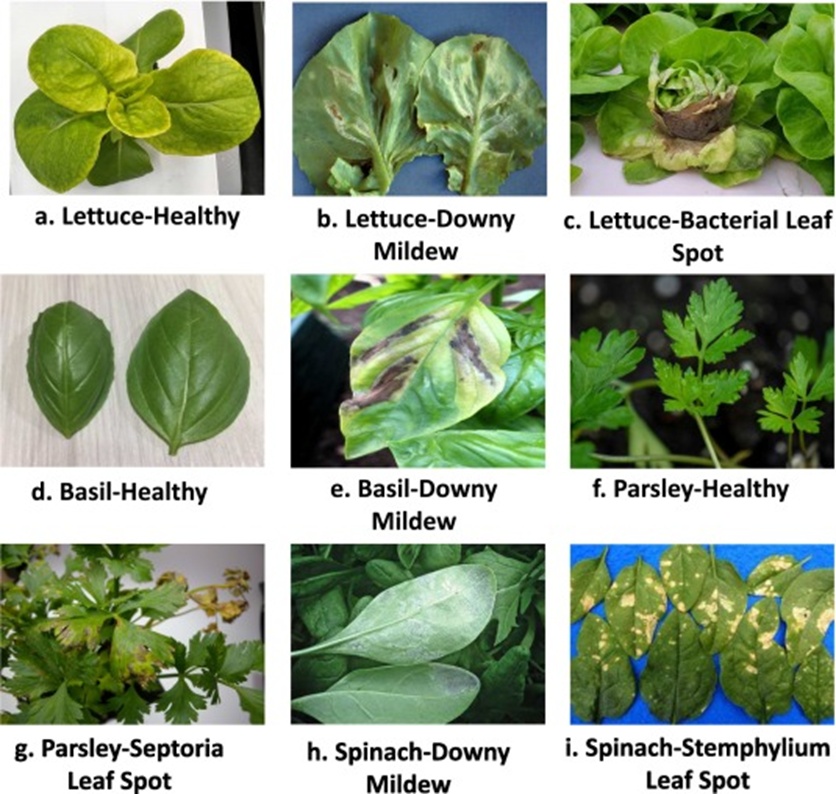
Figure 2. Samples from the leafy green image dataset (For interpretation of the references to color in this figure legend, the reader is referred to the web version of this article).
Data annotation ranks among the most critical prerequisites for successfully building object detection models. This step is performed manually and involves assigning a textual label or tag indicating a specific class to each desired object in an image. The resulting annotated corpus is what the model learns from during its training phase. Several freely available annotation utilities exist; however, the present study uses LabelImg4. LabelImg is a graphical annotation tool written in Python that plays well with several deep learning frameworks [26]. For this work, annotations are exported in both COCO JSON and YOLO Darknet TXT formats, a choice dictated by the plan to evaluate two alternative object detection backbones during final system evaluation.
Subsequently, data augmentation is applied to pad out and diversify the dataset. Doing so improves the model’s generalization and keeps overfitting in check. It also allows the model to capture a wider set of informative features. The augmentation pipeline relies on Albumentations, a Python package for high-performance, flexible image transformations [39]. The specific transformation operations applied include flipping, rotation, noise injection, blurring, and brightness adjustment. Figure 3 provides a visual comparison of several augmentation outcomes. Post-augmentation, the full dataset grows to 2640 images, each paired with its annotations. Table 1 breaks down the final class-wise distribution.
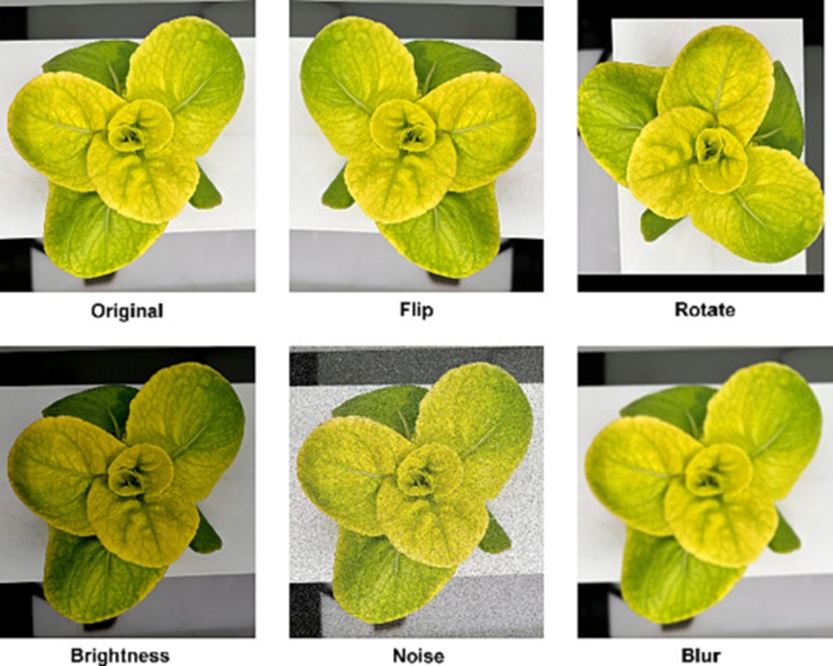
Figure 3. Example of different augmentation operations applied to the original image.
Table 1. Distribution of crop information in the used dataset among the studied crops.
Crop | Healthy | Diseased | Total | |
Disease 1 | Disease 2 | |||
Lettuce | 240 | 280 | 280 | 800 |
Basil | 240 | 280 | – | 520 |
Spinach | 240 | 280 | 280 | 800 |
Parsley | 240 | 280 | – | 520 |
Object detection is inherently a demanding problem, and diagnosing diseases on leafy green foliage adds further layers of complication. To address these, the detection workflow described here is partitioned into three principal stages, as shown in Figure 4.
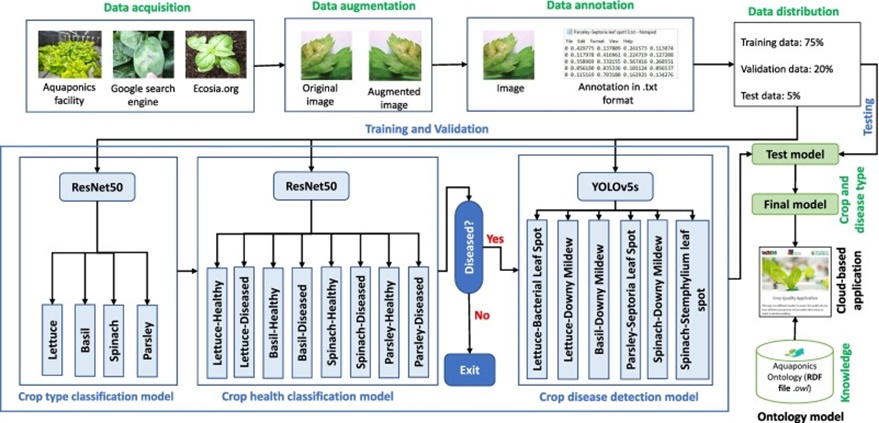
Figure 4. Detailed pipeline for the crop diagnostic process.
The initial stage of the proposed framework uses a lightweight CNN to assign incoming images to one of four crop bins: lettuce, basil, parsley, or spinach. The architectural backbone is ResNet-50, whose terminal segment has been replaced with the following sequence: one global average pooling layer, one dense (fully connected) layer of width 1024 activated by ReLU, and one output layer with Softmax activation to produce class predictions. ResNet-50 earned its place owing to an uncomplicated topology, competitive accuracy, and solid track record on modestly sized datasets [40]. The crop type selected at this juncture is written to a directory and simultaneously piped to the next stage as input.
Stage two continues to rely on ResNet-50 and takes the output of the preceding stage, then channels it into one of the eight classes itemized below.
i) Lettuce-Healthy
ii) Lettuce-Diseased
iii) Basil-Heathy
iv) Basil-Diseased
v) Spinach-Healthy
vi) Spinach-Diseased
vii) Parsley -Healthy
viii) Parsley-Diseased
The ResNet-50 topology in stage two duplicates that of stage one in all respects except for the output layer, which is enlarged to accommodate eight categories. Whenever the image is mapped to any ‘Diseased’ crop label, it is passed to stage three. Should a ‘Healthy’ label be predicted, however, processing terminates at this point, and the image does not travel further through the pipeline.
Stage three—the disease detection proper—tackles the twin challenges of localizing diseased spots within the leaf image and categorizing each spot into one of the disease labels enumerated below.
i. Lettuce-Bacterial leaf spot
ii. Lettuce-Downy mildew
iii. Basil-Downy mildew
iv. Parsley-Septoria leaf spot
v. Spinach-Downy mildew
vi. Spinach-Stemphylium leaf spot
This third stage is activated only if the immediately upstream stage passes it an image tagged ‘Diseased’. For constructing the disease detection engine, an object detection paradigm is employed. The past several years have witnessed an explosion of advances in deep learning and computer vision, greatly quickening the tempo of object detection research [9]. A multitude of object detection architectures (detectors) have been proposed and adapted for crop disease detection. At a high level, these detectors cluster into two families: i) two-stage detectors built upon region proposal mechanisms and ii) one-stage detectors formulated around regression or classification principles [41]. Among the prominent two-stage members are Fast R-CNN, Faster R-CNN, and Mask R-CNN, whereas the one-stage camp includes the YOLO (You Only Look Once) series [29].
[9] conducted an empirical comparison, pitting three distinct models—Faster R-CNN, YOLOv4, and EfficientDet—against each other on a problem of a similar nature in apple orchards. Their recorded measurements indicated that Faster RCNN, with a mean average precision (mAP) figure of 42.1%, held a slim lead over YOLOv4 (mAP of 41.4%) and a larger edge over EfficientDet (mAP of 38%). Extrapolating from these data points, Faster R-CNN initially appeared to be the appropriate candidate for the present work. That said, the YOLOv5 iteration introduced by Ultralytics [42] reportedly increased detection throughput by a sizable margin without sacrificing precision. On that basis, both architectures are benchmarked in this study.
Training for all models spanning the three phases of the disease detection pipeline is conducted on an NVIDIA GeForce RTX 3090. The stage-1 classification model is built using PyTorch, an open-source machine learning toolkit originating from the torch library developed by Meta AI. A transfer learning (TL) strategy is adopted, whereby a ResNet-50 backbone previously pre-trained on ImageNet is reused. Opting for a pre-trained checkpoint brings considerable efficiency gains, given that the model already embeds weights and biases learned from an earlier dataset, and these learned representations are often portable to new datasets [28]. Consequently, model weights are initialized via TL and then adapted to the custom dataset using a learning rate of 0.0001, mini-batches of size 64, an input tensor shape of 224 × 224 × 3, and 100 training epochs. The Adam algorithm handles optimization. The stage-2 classifier shares the same batch size of 64 and leaves all remaining hyperparameter settings untouched.
For object detection, the full dataset is split into 75% for training, 20% for validation, and 5% for testing. The first detector is realized in the Detectron2 framework, loading a pre-trained architecture (originally fitted on the COCO corpus) identified as ‘Faster-RCNN with ResNet-101 + FPN’. This detector operates on COCO JSON annotations and runs for 3000 iterations; the learning rate begins at 0.01 for the initial 500 iterations and then drops to 0.001 for the remaining 2500 iterations.
The second architecture, YOLOv5s, is implemented natively in PyTorch. A pre-trained version of the algorithm is likewise loaded to jump-start convergence and curtail training time. Annotation files for YOLOv5s follow the YOLO Darknet TXT convention, paired with a YAML descriptor that carries model configuration and class identifiers. Training proceeds for 3000 iterations. The hyperparameter settings selected for both detectors are summarized in Table 2.
Table 2. Values of hyperparameters used for two object detection methods.
Hyperparameters | Methods | |
Faster-RCNN | YOLOv5s | |
Input size | 600 × 600 | 416 × 416 |
Batch size | 16 | 16 |
Learning rate | 0.001 | lr0 = 0.01, lrf = 0.001 |
Momentum | 0.89 | 0.937 |
Gamma value | 0.1 | fl_gamma = 0.0 |
Weight decay | 0.0001 | 0.0005 |
Training time | 1.5 h | 50 min |
A full account of the design and exhaustive specification of all concepts and instances populating the ‘AquaONT’ ontology, developed by the authors, can be found in [3]. AquaONT delivers a unified ontological framework that captures and organizes the essential knowledge underpinning an aquaponics 4.0 system. Six top-level concepts structure the ontology: Consumer Product, Ambient Environment, Contextual Data, Production System, Product Quality, and Production Facility. For this investigation, two of these—’ Consumer Product’ and ‘Product Quality’—are queried for knowledge extraction. The ‘Consumer Product’ class offers an abstract representation of the variety, health condition, and growth metrics of harvest-ready crops circulating in an aquaponics environment. The ‘Product Quality’ class, in contrast, encodes crop-centric knowledge in two dimensions: pathology (covering diseases, their causal agents, and the methods and means available to curb or manage them) and morphology (canopy measures such as area, length, width, etc.). The present work focuses on four crops: lettuce, basil, parsley, and spinach. Their cultivation preferences along with morphological and pathological attributes—materialized as instances of the respective ontological classes—are retrieved once a crop label and a disease label have been established. Figure 5 depicts the hierarchical breakdown of the ‘Consumer Product’ and ‘Product Quality’ classes together with their instances tied to the ‘Basil’ crop, as visualized inside the Protégé6 platform (an open-source ontology editing environment and framework created at Stanford University).
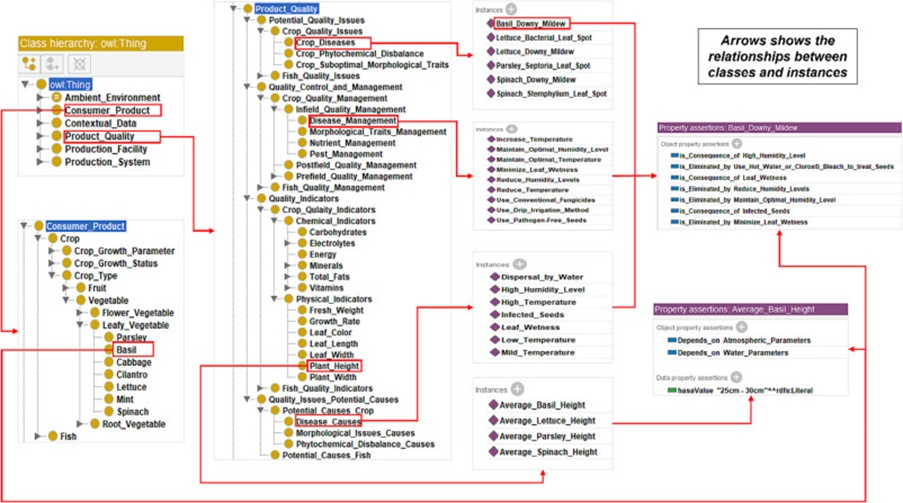
Figure 5. Hierarchical structure of ‘Consumer Product’ and ‘Product Quality’ classes and respective instances in relation to Basil Crop.
The finalized, trained disease detection pipeline is serialized to disk and subsequently deployed within a cloud-facing application built on the Streamlit framework. Alongside it, the ‘AquaONT’ ontology is also hosted in the same application, and the ontologically relevant classes are interfaced with the detection model via the Owlready2 library. The application’s interface layout appears in Figure 6. Two interactive controls are exposed: ‘Select Model’ and ‘Upload Image’. Through ‘Select Model’, the operator picks a model suited to the task at hand, with the available entries in this study corresponding to ‘Crop Classification’ (phase 1), ‘Disease or No Disease’ (phase 2), and ‘Disease Type, causes and Treatments’ (phase 3 of the proposed pipeline). After specifying the model, an image file is uploaded and subsequently processed by all models in the chain. Once a disease is detected and its category resolved, the system automatically queries the ontology model for the ailment’s known causes and suggested treatments, which are displayed on the application’s output panel. Furnishing practitioners with this class of information has tangible value, as it empowers them to diagnose disease origins and intervene with precautionary measures at early stages, thereby mitigating both crop loss and economic damage.
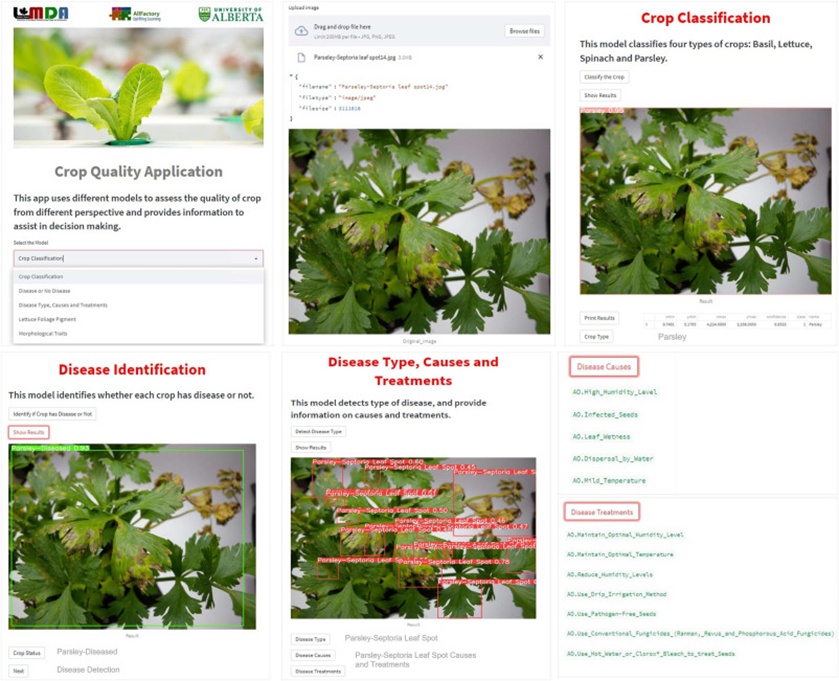
Figure 6. Layout of cloud-based application for disease detection.
This segment presents the empirical findings from the present study. The discussion opens with an evaluation of the deep learning models across the three phases of the disease detection system. Following that, the trained and validated pipeline is challenged with entirely fresh, unseen data. The section closes by underscoring the practical significance of the integrated system.
Performance of the phase-1 classifier is measured on a dedicated validation split. This phase tasks the model with discriminating among four classes: lettuce, basil, spinach, and parsley. The label composition of the validation subset used here is detailed in Table 3.
Table 3. Dataset distribution of the validation set for phase 1.
Class (Health + Diseased) | Number of images |
Lettuce | 160 |
Basil | 104 |
Spinach | 160 |
Parsley | 104 |
Results are graphically presented in a confusion matrix (CM) shown in Figure 7. Overall accuracy, precision, recall, and F-measure are computed using standard formulas aligned with the prevailing evaluation practices for deep learning models documented in the literature [9]. The calculated metrics are collated in Table 4.
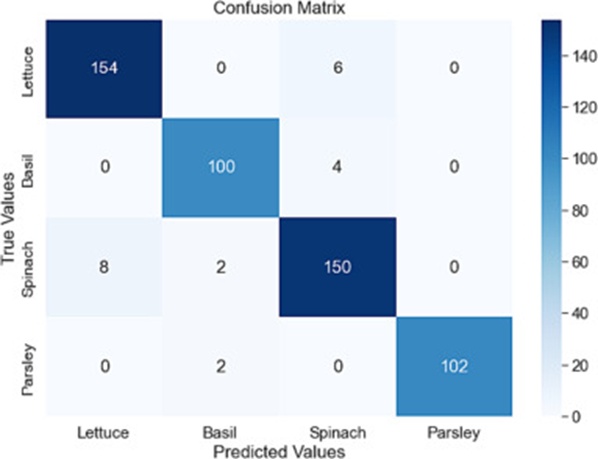
Figure 7. Confusion matrix of classification results in phase 1.
Table 4. Results of the classification model in phase 1.
Crop | Accuracy | Precision | Recall | F1-Score |
Lettuce | 0.97 | 0.95 | 0.96 | 0.96 |
Basil | 0.98 | 0.96 | 0.96 | 0.96 |
Spinach | 0.96 | 0.94 | 0.94 | 0.94 |
Parsley | 0.99 | 1 | 0.98 | 0.99 |
Average | – | 96.25% | 96% | 96.25% |
Overall accuracy | 95.83% |
The phase-1 classification model delivers an overall accuracy of 95.83%, along with an average precision of 96.25%, average recall of 96%, and average F1-score of 96.25%. Inspection of Table 4 shows that the ‘spinach’ class lags the other classes across all metrics. Most misclassifications cluster among spinach, basil, and lettuce leaves, with the problem being especially pronounced during the earliest phases of vegetative growth.
The performance of the phase-2 classifier is assessed using the same procedure. At this stage, the model must resolve the six classes considered in this study. Table 5 outlines the composition of the validation split used to train this model.
Table 5. Distribution of validation dataset for phase 2.
Class | Number of images |
Lettuce-Healthy (LH) | 48 |
Lettuce-Diseased (LD) | 112 |
Basil-Healthy (BH) | 48 |
Basil-Diseased (BD) | 56 |
Spinach-Healthy (SH) | 48 |
Spinach-Diseased (SD) | 112 |
Parsley-Healthy (PH) | 48 |
Parsley-Diseased (PD) | 56 |
Figure 8 contains the CM generated for this model, while Table 6 consolidates the corresponding performance figures.
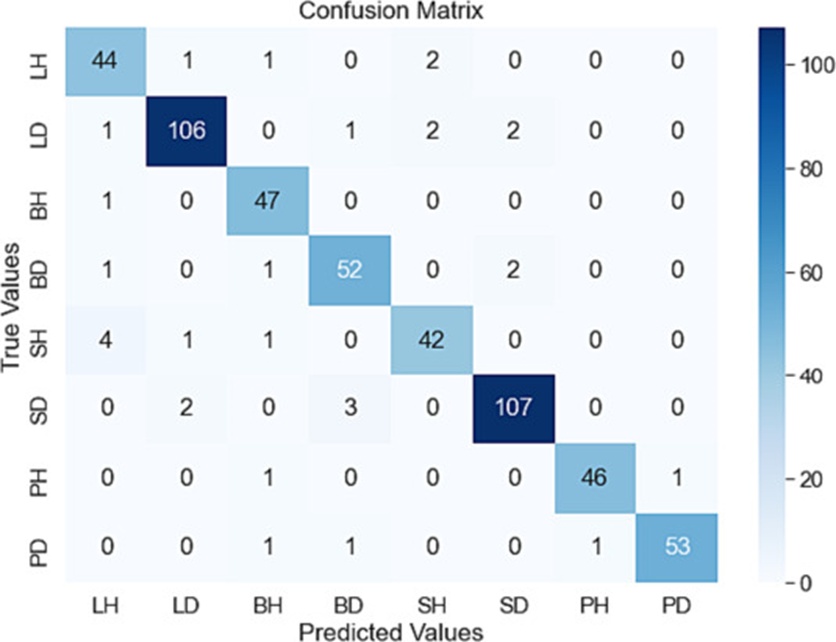
Figure 8. Confusion matrix of classification results in phase 2.
Table 6. Performance metrics of the classification model in phase 2.
Class | F1-score | Recall | Precision | Accuracy |
LH | 0.89 | 0.92 | 0.86 | 0.979 |
LD | 0.95 | 0.95 | 0.96 | 0.981 |
BH | 0.94 | 0.98 | 0.90 | 0.989 |
BD | 0.92 | 0.93 | 0.91 | 0.983 |
SH | 0.89 | 0.88 | 0.91 | 0.981 |
SD | 0.96 | 0.96 | 0.96 | 0.983 |
PH | 0.97 | 0.96 | 0.98 | 0.994 |
PD | 0.97 | 0.96 | 0.98 | 0.992 |
Average | 93.6% | 94% | 94% | – |
Overall accuracy |
|
|
| 94.13% |
The phase-2 classifier attains an overall accuracy of 94.13%, complemented by average precision, recall, and F1-score values of 94%, 94%, and 93.6%, respectively. The CM in Figure 8 reveals a persistent tendency toward inter-class confusion. To illustrate, six instances of LD (Lettuce-Diseased) are scattered across LH (1), BD (1), SH (2), and SD (2). Such errors likely arise from difficulties in interpreting subtle leaf patterns and demarcating diseased tissue.
Turning to the detection stage (phase 3), the two shortlisted architectures are benchmarked on their respective validation datasets. This phase confronts the detectors with six distinct diseases that must be localized within crop foliage. Table 7 records these six disease classes and the corresponding validation set distributions.
Table 7. Distribution of the validation dataset in phase 3.
Class | Number of images |
Lettuce-Bacterial Leaf Spot (LBS) | 56 |
Lettuce-Downy Mildew (LDM) | 56 |
Basil-Downy Mildew (BDM) | 56 |
Parsley-Septoria Leaf Spot (PSS) | 56 |
Spinach-Downy Mildew (SDM) | 56 |
Spinach- Stemphylium Leaf Spot (SSS) | 56 |
Mean average precision (mAP) serves as the comparative metric for the two detectors—Faster-RCNN and YOLOv5s. Within the object detection literature, mAP is widely regarded as the principal evaluation criterion [9]. The specific variant computed here is [email protected], which captures the mean mAP value taken at an intersection-over-union threshold of 0.5. Table 8 presents the class-wise comparison between the two models. YOLOv5s emerges as the stronger performer, with an [email protected] of 82.13%, compared with the lower [email protected] of 76.4% reported by Faster R-CNN. Both detectors earn their top mAP scores on Lettuce-Bacterial Leaf Spot (LBS), Parsley-Septoria Leaf Spot (PSS), and Spinach-Stemphylium Leaf Spot (SSS). By contrast, markedly lower mAP values surface for Lettuce-Downy Mildew (LDM), Basil-Downy Mildew (BDM), and Spinach-Downy Mildew (SDM). Downy Mildew infections initially present as faint, greenish to yellowish, angular flecks on the adaxial leaf surface, a symptom pattern that appears largely uniform across host species. This visual commonality makes it difficult for the detector to distinguish crop-specific manifestations of Downy Mildew. A larger training corpus would likely dispel this ambiguity. During more advanced infection stages, the necrotic tissue adopts a tan hue in spinach, shifts to purplish brown in basil, and becomes light brown in lettuce—transitions that the detector successfully resolves.
Table 8. Class-wise comparison of two detection models.
Class | mAP | |
YOLOV5s | Faster-RCNN | |
Lettuce-Bacterial Leaf Spot (LBS) | 83.86 | 77.32 |
Lettuce-Downy Mildew (LDM) | 78.63 | 73.89 |
Basil-Downy Mildew (BDM) | 80.11 | 75.47 |
Parsley-Septoria Leaf Spot (PSS) | 84.55 | 78.63 |
Spinach-Downy Mildew (SDM) | 79.87 | 74.19 |
Spinach-Stemphylium Leaf Spot (SSS) | 85.74 | 79.52 |
mAP@0.5 | 82.13 | 76.34 |
The performance assessments carried out across the three phases demonstrate that detection models are inherently more complex than classification models. This stems from the fact that a single image can contain multiple objects, which may belong to either a shared class or distinct classes. Consequently, three elements must be jointly verified during evaluation: the predicted object class, the bounding box (denoting object location), and the associated confidence score.
Finally, the two detection architectures are contrasted based on inference time, a critical metric that determines how quickly detections are produced. The comparison reveals that the one-stage detector, YOLOv5s, operates at 52.8 FPS (frames per second), outpacing Faster R-CNN at 43.2 FPS. Additionally, YOLOv5s reliably localizes objects across a range of sizes while producing minimal to no overlapping bounding boxes. Taken together, all comparative evaluations indicate that YOLOv5s has a decisive edge in both accuracy and runtime speed. Accordingly, YOLOv5s is adopted in this work for constructing the disease detection system.
Following the training and validation phases, the completed crop disease detection system powered by YOLOv5s is evaluated on a test set composed entirely of fresh images. The system yields encouraging results, successfully classifying crops and pinpointing diseases in the targeted species, thereby underscoring its robustness when confronted with objects that vary widely in shape, pattern, texture, and color. Figure 9 presents illustrative examples where the system correctly identifies the crop type and demarcates diseased versus healthy regions on the foliage. The top row of Figure 9 displays the outputs from the three-stage disease detection pipeline for a Lettuce specimen afflicted with Bacterial Leaf Spot. Likewise, the second and third rows depict the three-stage results for Spinach and Parsley, respectively, along with the diagnosed ailments—Downy Mildew for Spinach and Septoria Leaf Spot for the latter.
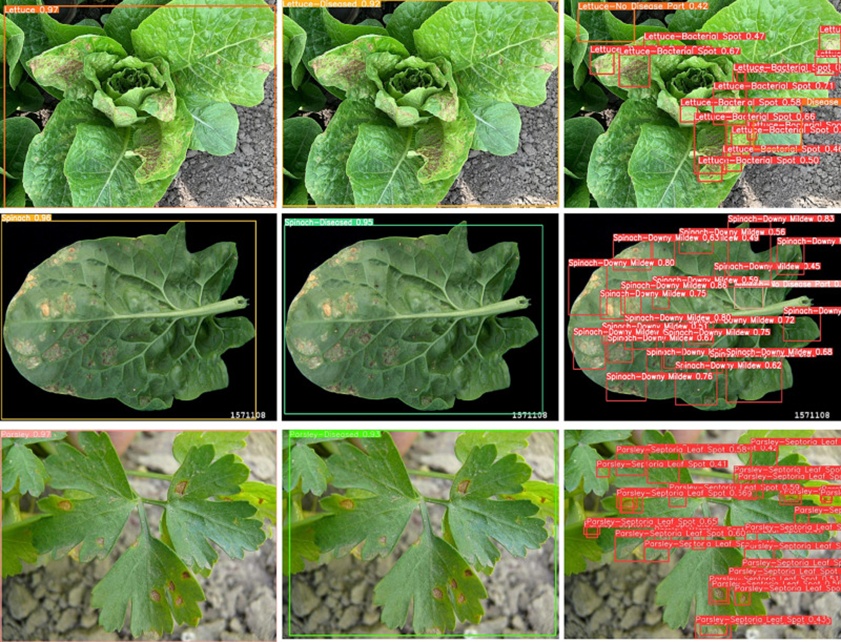
Figure 9. Results from the proposed disease detection system.
The finalized crop disease detection system is subsequently deployed to the cloud-based application, the interface of which is shown in Figure 6. The ontology model is also integrated with the final system to deliver a fully integrated, real-time crop diagnostic solution. Images are transmitted wirelessly from the aquaponics installation via an interface previously developed by the authors on the Google Cloud Platform [3] and stored in a folder from which the crop diagnostic system retrieves them. After the crop species and the corresponding disease are determined, the ontology model is automatically consulted to extract the causal factors and treatment options, which are then surfaced on the application dashboard. By way of illustration, Figure 6 shows a working example of the crop diagnostic system applied to parsley. Upon uploading an image, the system diagnoses Septoria Leaf Spot. The crop diagnostic pipeline then retrieves from AquaONT the knowledge regarding plausible causes and general treatment protocols for this condition. Primary triggers of Septoria Leaf Spot in Parsley may involve elevated humidity, contaminated seeds, prolonged leaf wetness, and similar factors; irregular swings in air temperature can also precipitate the disease. The preventive and remedial measures suggested by the system for this ailment include maintaining optimal humidity and temperature ranges tailored to Parsley requirements and the indoor aquaponics setting throughout the cultivation period, disinfecting seeds before germination with hot water or Clorox bleach, and using conventional fungicides if the infection has spread across multiple plants. Downy Mildew ranks among the most frequently encountered diseases spanning diverse crops [43]. In greenhouse or indoor farming environments, the underlying causes of this disease remain consistent across host species, including high humidity, cool temperature regimes, infected seeds, and leaf wetness Margaret Tuttle [43]. As a result, the management approaches for Downy Mildew on lettuce, basil, and spinach are broadly similar. This implies that the crop-specific classification of Downy Mildew does not materially alter the treatment-related outputs. Nonetheless, performing the crop-level classification of Downy Mildew for each species individually remains important, since the visual symptoms exhibited by the three crops—lettuce, basil, and spinach—diverge as the growth cycle progresses. Such divergence could potentially confuse the detector when it attempts to differentiate Downy Mildew from other pathologies. For example, lettuce tissue affected by Downy Mildew ultimately turns brown at advanced stages. This symptom closely resembles those of Bacterial Leaf Spot in lettuce, even though the two diseases call for different intervention strategies.
The practical value of the proposed system lies in its ability to serve as a critical tool for agriculturalists seeking to establish and digitize aquaponics operations. It empowers them to diagnose diseases at the earliest stages while also supporting decision-making on crop characteristics and disease remediation. Furthermore, this work is poised to stimulate new implementations, including investigations into the intricate interplay between dynamic parameters (both environmental and water-related) and disease emergence in aquaponics settings, as well as the development of self-adapting farms capable of responding autonomously upon disease detection. Embedding such intelligent technologies into aquaponics systems can help curb crop waste and deliver economic and environmental gains.
This investigation presents a crop diagnostic system tailored to leafy green vegetables grown in an aquaponics environment. Four leafy green species—lettuce, basil, spinach, and parsley—are examined. An initial dataset is compiled, comprising 2640 images (healthy and diseased) of these four crops, gathered from multiple sources. Building on this dataset, a system is devised that efficiently and reliably identifies both crop type and disease presence. The detection pipeline unfolds in three stages. The first stage determines the crop species, the second stage judges whether the crop is healthy or afflicted, and the third stage proceeds to detect the specific disease only if the preceding stage labels the crop as diseased. Every model employed in this study is initialized through transfer learning and subsequently trained on the leafy green dataset prepared for this purpose. Model performance is thoroughly evaluated, and encouraging outcomes are obtained. Within the detection stage, for instance, YOLOv5s, with an [email protected] of 82.13% and a detection throughput of 52.8 FPS, surpasses Faster R-CNN. Based on these results, YOLOv5s is selected as the definitive model for this work. The ontology model, which encodes knowledge about disease etiologies and treatments, is then integrated with the final crop disease detection system. Lastly, a cloud-based application is engineered to host the entire crop diagnostic system, encompassing both the disease-detection component and the ontology model. The proposed system proves to be sufficiently accurate and adaptable for real-world deployment and is therefore not constrained by potentially shifting conditions or environments. It can be a valuable asset for agricultural practitioners who wish to explore modern farming paradigms and incorporate intelligent techniques into their operations. The system not only aids in disease diagnosis and quantification but also supports informed decisions on potential countermeasures against identified diseases at early stages.
In terms of future directions, the system is intended to be broadened to encompass additional leafy green crops. Furthermore, the dataset will be expanded to include more real-world images. A mobile application will also be developed to reduce latency and to provide the data privacy guarantees that cloud-based architectures typically cannot offer.
The authors acknowledge the financial support of this work from the Natural Sciences and Engineering Research Council of Canada (NSERC) (Grant File No. ALLRP 545537-19 and RGPIN-2017-04516).
None
None
None
Open Access The author(s) retain copyright. This article is licensed under the Creative Commons Attribution-NonCommercial-ShareAlike 4.0 International License. It may be shared and adapted for non-commercial purposes with appropriate attribution, an indication of changes, and distribution of adaptations under the same license. Third-party material may be subject to separate terms identified in its credit line. View the license at https://creativecommons.org/licenses/by-nc-sa/4.0/.
 Agro Intelligence Research Press