In some Asian countries, jute is a fundamental source of revenue and contributes to Gross Domestic Product (GDP). Like other crops, jute is vulnerable to pest invasions, and detecting them often relies on visual inspection in countries such as Bangladesh, India, Myanmar, and China. This practice is also slow, difficult, and somewhat inaccurate, posing a significant economic risk. To mitigate this challenge, the investigation proposes a highly accurate and resilient transfer learning (TL)- based JutePestDetect model for detecting jute pests at their initial stages. To begin with, we assembled a jute pest collection comprising 17 categories and roughly 380 images per category, which were scrutinized after manual and automated preprocessing and refinement, including background removal and scaling. Following this, five distinguished pre-trained architectures—DenseNet201, InceptionV3, MobileNetV2, VGG19, and ResNet50—were picked from an earlier work to formulate the JutePestDetect model. Every architecture was adjusted by replacing the classification layer with a global average pooling layer and inserting a dropout layer for regularization. For performance measurement, a range of indicators, including precision, recall, F1 score, ROC curve, and confusion matrix, were used. These examinations provided a deeper understanding of the models’ capabilities. Within this set, the proposed JutePestDetect model, based on a tailored regularized DenseNet201, outperformed its counterparts, achieving an outstanding accuracy of 99%. Hence, our suggested method and tactics deliver a refined solution for pest recognition specific to jute, with the potential to substantially assist cultivators worldwide.
Jute is a natural fiber used for thousands of years in weaving and rope-making, ranking second among vegetable fibers after cotton [1]. India, Bangladesh, China, and Thailand are frontrunners in jute farming. Nearly 98% of global jute output originates from India and Bangladesh [2]. Nations across Asia, including Bangladesh, Pakistan and India, transform and manufacture numerous products from jute [2]. In Bangladesh, jute, popularly known as the golden fiber, is the chief cash crop. From the twentieth century onward, the jute sector has occupied a central position in the country’s economy [3]. Cultivation occurs in every district of Bangladesh, though Faridpur, Tangail, Jessore, Dhaka, Sirajganj, Bogra, and Jamalpur are the leading jute-growing zones [3]. For most farmers residing in these territories, their subsistence is tied directly to jute farming.
Additionally, thousands of laborers are employed in jute mills, depending entirely on jute cultivation and the creation of jute merchandise for their livelihood. A persistent difficulty in jute farming, however, is the damaging consequences of pest infestations. Regularly, our cultivators struggle to correctly identify the specific pests involved and, as a result, fail to take appropriate measures. As a consequence, jute yields frequently suffer. Thus, recognizing pest invasions at the earliest feasible moment can markedly boost both output volume and fiber standards. The estimated decline in crop yield attributable to pests hovers around 18% [4]. The monetary and ecological repercussions of diagnosing pest attacks from afar are substantial. Age-old approaches to pest identification require significant human input and wage bills, yet offer no assurance of definitive outcomes. Striving to notice such minute early-stage irregularities of pest attacks across expansive fields is an unattainable ambition. Because of this, chemical pesticides are deployed to control agricultural damage only in the later stages of infestations. This elevates production overheads. Overapplication additionally poses risks to human health and other life forms [5, 6]. For these reasons, implementing improved technological means to spot pest assaults is vital for both sustainable farming and environmental protection. Utilizing artificial intelligence (AI) for early recognition and classification of pest varieties may resolve this issue and elevate the standard of jute output. A range of researchers have undertaken pest classification and disease identification on different crops [7]. Specifically, previous endeavors addressed only four pest categories via transfer learning [7]. Yet roughly 19 different pest types can attack jute plants. To address this shortfall and engineer a model that exhibits both high precision and durability for an automated jute identification framework, our group has conducted this research.
Creating an AI-driven jute pest recognition system nonetheless presents numerous hurdles. The foremost issue is dataset compilation. In our study, we managed this satisfactorily. Another obstacle is the limited volume of data and the difficulty of extracting dependable, highly precise results from standard AI platforms. CNNs can autonomously extract hierarchical features from jute images, achieving superior accuracy compared to conventional techniques [8]. Yet their effectiveness declines when data are scarce. Accordingly, we implemented the transfer learning paradigm, which enables leveraging an already-trained model to rapidly build new models that require fewer data instances; this characteristic makes them exceptionally well-suited for pest recognition tasks with small training collections [7].
To address the real-world challenges posed by pest infestations, following a six-month review encompassing over 100 articles, papers, and blogs, and extensive labor, we have organized our dataset, which includes 17 pest categories. Our objective was to construct a rapid, resilient, and trustworthy pest classification mechanism grounded in artificial intelligence, which equips growers to make timely, informed decisions about how to handle detected pests. This undertaking can drastically cut reliance on expert input while additionally removing temporal bottlenecks from the workflow. We harnessed transfer learning to repurpose a well-trained model for instant pest categorization.
The principal contributions of this investigation are enumerated below:
• Creation of an extensive jute pest dataset incorporating 17 separate pest categories, allowing for a more in-depth examination.
• Unveiling of the JutePestDetect model, built to offer strong performance and resilience in pest recognition.
• Deployment and assessment of five pre-trained architectures (DenseNet201, InceptionV3, MobileNetV2, VGG19, and ResNet50) against the assembled dataset, illustrating their value for jute pest identification.
• Integration of a generalization and regularization tactic, embedding a global average pooling layer along with a dropout layer, respectively, to boost the learning power of the transfer learning models.
• Utilization of fine-tuning procedures to calibrate the pre-trained architectures precisely for jute pest recognition, additionally improving their precision and flexibility.
• In-depth appraisal of the architectures, weighing their results against established contributions within the domain, to furnish a holistic measure of their utility and performance.
The subsequent sections of this paper are arranged in the following manner. Previous efforts in intelligent pest categorization utilizing transfer learning networks are reviewed. The particulars of our methodological approach are then presented, followed by a description of the data acquisition practices and dataset specifications. The experimental findings are subsequently presented. Lastly, conclusions derived from the findings are summarized.
Transfer learning (TL) has rapidly gained traction across numerous domains as a means to either bolster deep networks or serve as a feature extraction mechanism [9]. Its utility has been firmly established across diverse problem domains, including malware classification [10], handwritten digit recognition [11], time-series data classification [12], and numerous other applications.
A growing wave of researchers has built models leveraging assorted CNNs in recent times; however, investigations targeting regionally significant insect species for AI-driven jute pest detection remain remarkably sparse. The work of Sourav et al. [7] introduced a TL-based deep learning framework that distinguishes four principal jute pest varieties: Field Cricket, Spilosoma Obliqua, Jute Stem Weevil, and Yellow Mite. Working from the same data set, Dewan Ziaul Karim et al. [13] proposed a deep CNN architecture, PestDetector, for sorting jute pest varieties, achieving notable training accuracy of 99.18% and validation accuracy of 99.00%. As a source fiber for the manufacturing of numerous biodegradable goods, jute also carries considerable economic weight in countries such as Bangladesh, China, and India. Acknowledging this geographic relevance, Indian scholars Mallick et al. [14] developed a CNN-based deep learning system to detect and classify six diseases and four pests affecting mung beans, a staple Indian crop on which a significant portion of the population depends. Turning to the Wang, Xie, Deng, and IP102 datasets, the detection framework of Kasinathan et al. [15] draws on foreground extraction and contour identification to pinpoint insects in highly intricate backgrounds. The trials, which delivered peak detection capability with minimal computational overhead, were run using shape-based features along with machine learning classifiers such as artificial neural networks (ANN), support vector machines (SVM), k-nearest neighbour (KNN), naive Bayes (NB), and CNN architectures, with the highest classification score touching 91.5%.
A separate survey-based analysis [16] scrutinized 33 works on automated insect identification from captured imagery, illustrating a breadth of DL strategies, principally deploying several adapted CNN variants to discern common insects, plants and leaf and fruit disorders. The objective in [17] is to assist banana cultivators by developing an AI-anchored system for banana disease and pest identification based on a DCNN. This undertaking assembled sizable repositories of expert-curated images depicting banana disease and pest symptoms and damage, collected from various locations across Africa and Southern India. The findings indicated that ResNet50- and InceptionV2-based configurations outpaced MobileNetV1. These architectural choices mirror cutting-edge progress in banana disease and pest recognition, with the bulk of evaluated models exceeding 90% accuracy. Motivated by these insights, we incorporated the same architecture within our own investigation to gauge its performance on jute pest identification. Dawei et al. [18] formulated a diagnostic framework rooted in transfer learning for pest detection and classification tasks. Pattnaik et al. [19] described a deep CNN-grounded transfer learning scheme for sorting pests found on tomato crops. Cao et al. [20] advanced a transfer learning-oriented strategy aimed at common insect recognition as a remedy to the challenge. A convolutional neural network classification model grounded in transfer learning is advanced to capture leaf traits of soybean pests and diseases, streamline the complexity of soybean pest and disease image representation, and mitigate overfitting caused by limited sample sizes. The lower-level attributes are stepwise refined into high-level abstract features via the convolutional network’s layered architecture. Superlative attribute learning potential [21]. To enhance learning capacity for pest images set against chaotic backgrounds, ImageNet, alongside MobileNet-V2 as the backbone network, together with an attention mechanism and a classification activation map (CAM), was woven into the design to capture salient pest characteristics from incoming images [22]. Deep convolutional neural networks (DCNNs) are used to differentiate 10 pest types commonly encountered in paddy cultivation [23]. Xin et al. [24] refine the fast-RCNN technique, which proves adept at target delineation. A recent review by Deva Priya Isravel et al. [25] evaluated the latest deep learning architectures for leaf disease and pest categorization. Among the tested candidates, VGG19 and YOLOv5 came forward as the strongest performers.
Additionally, Min Dai et al. [26] validated YOLOv5 as an impactful model for pest detection. Elsewhere, Md. Simul Hasan Talukder et al. [27] recommended a CTInceptionV3-RS-based neural network for potato pest identification. The investigators applied five pre-trained architectures, which were altered and refined via a random search of hyper-parameter. The adjusted and refined InceptionV3 architecture achieved 91% accuracy. Beyond this, select researchers have turned their attention to identifying imperfections in raw jute fiber [28] and to probing methodologies suited to detecting and sorting defects under these specific conditions.
A fundamental hurdle confronting deep learning-centric algorithms is acquiring a dataset that matches the desired data class. More rigorously assembled datasets remain necessary for training CNNs across all equivalent insect or pest data classes encountered in different global regions. That said, multiple insect and pest datasets have earned substantial notice in recent years. The National Bureau of Agricultural Insect Resources (NBAIR) [29] stands among these, featuring 40 classes of field crop insect photographs from rice, maize, soybeans, sugarcane, and cotton. Beyond this, two datasets assembled by Xie et al. [30, 31] included 24 and 40 frequent field crop pests to support the development of pest recognition using CNNs. A relatively recent investigation focused on six species within the Cicindelinae subfamily (tiger beetles) of the order Coleoptera was captured in a dataset produced by Abeywardhana et al. [32], which was marked by an uneven and limited number of images. Although the authors concede that telling tiger beetle species apart poses difficulties even for the practiced human eye, they invested substantial effort in capturing tiger beetle photographs drawn from diverse sources, perspectives, and magnifications. The publication [33] released by the Department of Agricultural Extension, Bangladesh, in June 2019 enumerates 19 pests that inflict widespread harm to jute production.
Nonetheless, upon surveying the literature, it becomes clear that while extensive investigative efforts have been directed at pest identification broadly, work analogous to ours focused specifically on jute pest identification is lacking. Prior studies have chiefly focused on distinguishing only four jute pest types and have relied on VGG19 and other CNN architectures, without delving deeply into other pre-trained models or incorporating folding regularization strategies into their investigative framework.
Beyond the four jute pest classes identified in [7], we broaden the dataset to 17 classes in the current work. Researchers tailor various CNN architectures to implement TL while adjusting parameters to support their envisioned solutions. CNNs commonly used in TL include AlexNet, LeNet, ResNet, GoogleNet, and MobileNet, as well as their variants. Accordingly, to undertake the jute pest classification task effectively, we propose leveraging multiple CNNs to deploy the TL approach, coupled with regularization practices.
In this study, we propose a resilient jute plantation. Dataset assembly, preprocessing, augmentation, base model formulation, and model performance assessment constitute the core stages of this investigative endeavor. Each stage is unpacked sequentially in what follows.
Assembling a suitable dataset stands among the chief hurdles encountered in image classification tasks. Securing relevant imagery in specialized areas like healthcare and farming is exceptionally difficult. For our project, we gathered 13 categories of jute pest images using Python open-source toolkits to scrape visuals from online sources. However, this undertaking introduced several obstacles, including fluctuating ambient illumination and picture warping, occlusions, shifting viewpoints, intra-category differences, and chaotic backdrops. Every image underwent hands-on quality verification in our laboratory. With input from both an entomology expert and an agricultural specialist, our team sorted the pictures into their respective categories.
Meanwhile, any grayscale images were ingested and subsequently converted to RGB format using OpenCV, ensuring compatibility with the input specifications of our proposed CNN. Various preprocessing steps were undertaken, including cleanup, contrast enhancement, background removal, and noise suppression. The Regions of Interest (ROI) sections drawn from each pest image collection were standardized to a resolution of 256 × 256 × 3. The pseudocode for the preprocessing workflow of the proposed architectures is presented in Algorithm 1. The overarching aim of this preprocessing phase is to prepare the data to facilitate productive model training while improving the general performance and precision of the ML architectures. The preprocessing component was handled using a variety of OpenCV utilities.
Algorithm 1. Pseudocode for data preprocessing.
1 | Input: Pest data/images | ||||
2 | Output: Preprocessed resized image | ||||
3 | for x ← 1 to n do # x = number of images | ||||
4 | Label= Split label from the sample and store as a matrix | ||||
5 | for image ← 1 to x do | ||||
6 | Call the Preprocess image function | ||||
7 | Ri ← Read image | ||||
8 | Ci ← Convert image into RGB | ||||
9 | Cj← Cleaning the image | ||||
10 | Ei ←Enhancing contrast | ||||
11 | Ri← Removing background | ||||
12 | Rj ←Removing noise | ||||
13 | Rs ← Resize image to 256 × 256 | ||||
14 | D ← Append image data | ||||
15 | End | ||||
16 | Cd ← convert data into matrix | ||||
17 | Cl ← Convert label into categories | ||||
18 | End | ||||
19 | End of Pseudocode | ||||
The categorized dataset is enriched with additional parameters via the Keras ImageDataGenerator, boosting both dataset size and heterogeneity. The augmentation operations are depicted in Figure 1. Ultimately, the 13-category collection is fused with the publicly available jute pest repository, which contains four pest categories. In this manner, the conclusive dataset applied throughout our work has been constructed. The aggregate tally in our dataset is 6209, split across 17 categories, with a typical count per category near 388. The allocation pattern of our dataset is mapped out in Figure 2.
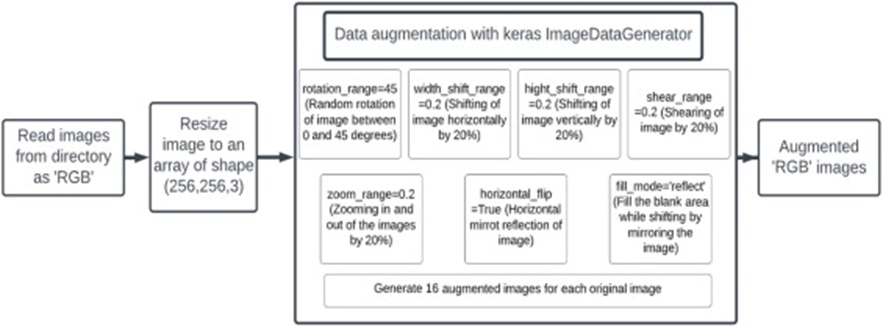
Figure 1. Augmentation techniques in the stage of data preparation.
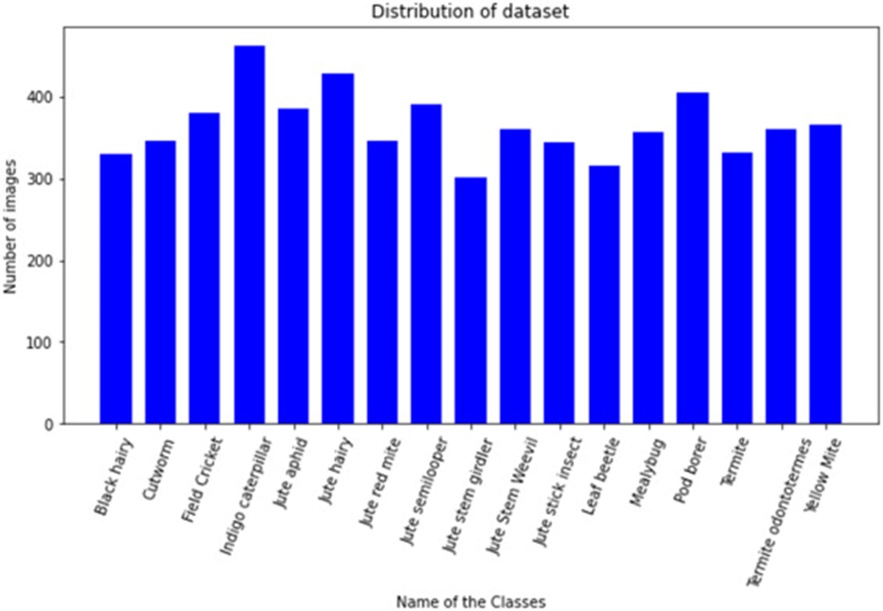
Figure 2. Distribution of dataset.
Throughout this investigation, we have developed a robust jute pest recognition framework (JutePestDetect), illustrated in Figure 3. After preprocessing, augmentation procedures are applied to the training and validation partitions to enlarge the dataset while curbing overfitting. Algorithm 2 presents the pseudocode for the data augmentation methods used in this study. By way of demonstration, for up to 20 cycles, the data specimen is generated, with each cycle producing 16 brand-new specimens.
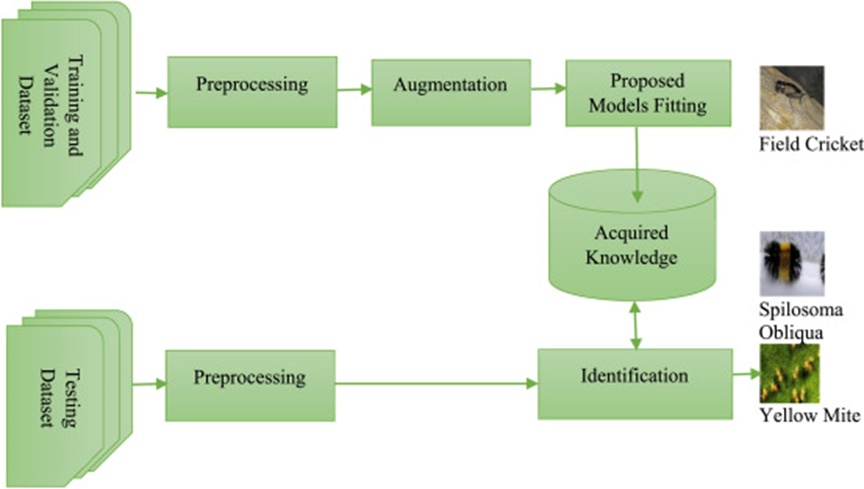
Figure 3. Proposed jute pest identification system.
Algorithm 2. Pseudocode of Data Augmentation.
1 | Input: read original image samples x using OpenCV. | ||
2 | Resize image to 224 × 224. | ||
3 | Store the resized image as an array inside a list. | ||
4 | Call the image data generator function | ||
5 | for n ← 1 to 20 do | ||
6 | rotation_range = 30 | ||
7 | width_shift_range = 0.2 | ||
8 | height_shift_range = 0.2 | ||
9 | zoom_range = 0.2 | ||
10 | vertical_flip = True | ||
11 | horizontal_flip = True | ||
12 | Save to directory | ||
13 | Save format as ‘‘jpg’’ | ||
14 | End | ||
15 | End of Pseudocode | ||
Within our proposed framework, customized iterations of five renowned pre-trained CNN backbones—specifically DenseNet201, InceptionV3, MobileNetV2, VGG19, and ResNet50—are used for both feature extraction and classification. The pre-trained DenseNet201, InceptionV3, MobileNetV2, VGG19, and ResNet50 backbones have already been trained on the ImageNet dataset, which contains 1.2 million images across 1000 classes. These backbones are used to transfer the learned weights and parameters to the jute pest dataset shown in Figure 4.
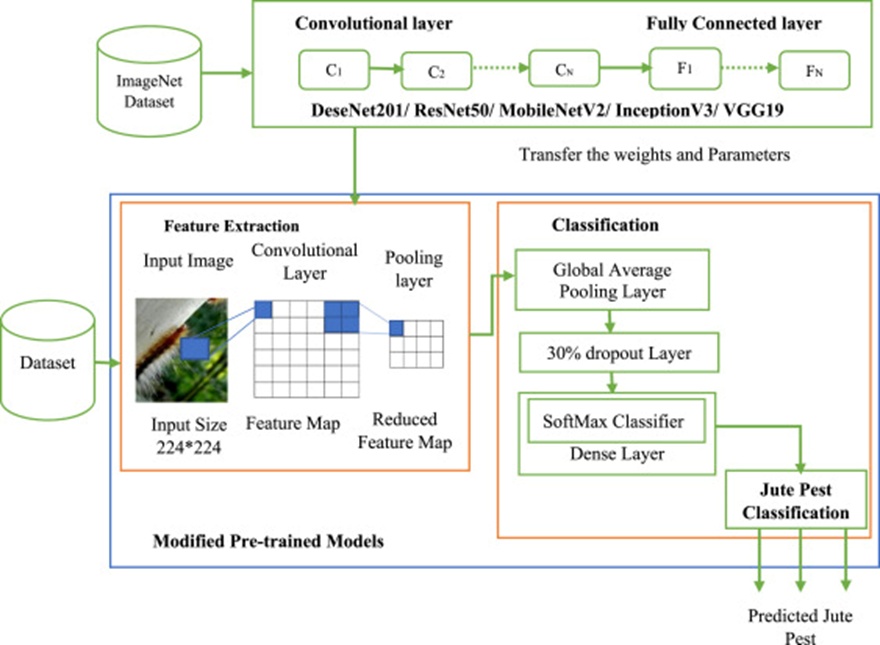
Figure 4. Proposed JutePestDetect Model.
The backbones we deployed represent tailored versions of the five pre-trained architectures. We adjusted the classification head portion of each backbone, while the foundational tiers remained unchanged, allowing them to continue extracting features. The classification head encompasses:
• A global average pooling layer
• A dropout layer set at 30%
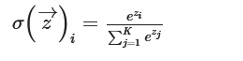
• A dense layer featuring a SoftMax activation mechanism, articulated in Eq. 1, situated at the conclusion of the pre-trained backbone.
The dataset is split into training, testing, and validation sets with a 70:15:15 distribution. Using the categorical cross-entropy loss formulation in Eq. 2, we trained and validated across the five backbones, using the training and validation data, respectively, for 50 epochs at a batch size of 16, a learning rate of 0.001, and a seed value of 46. Afterward, we gauged each backbone against the test partition, and the results were discussed in the results analysis section. From a pool of five backbones, the modified, regularized DenseNet201 was selected as our final JutePestDetect model, owing to its strong performance in distinguishing jute pests. The specifications of each altered backbone are tabulated in Table 1.
 (1)
(1)
Table 1. Modified pretrained CNN model with the parameters.
Model | Non-trainable parameters | Trainable parameters | Total parameter |
ResNet50 | 23,587,712 | 34,833 | 23,622,545 |
VGG19 | 20,024,384 | 8721 | 20,033,105 |
InceptionV3 | 21,802,784 | 34,833 | 21,837,617 |
MobileNetV2 | 2,257,948 | 21,777 | 2,279,761 |
DenseNet201 | 18,321,984 | 32,657 | 18,354,641 |
Where all the zi terms compose the elements of the input vector and are free to assume any real value.
 (2)
(2)
Where yi∈[1,0] and yiˆ denotes the actual output rendered as a probability.
The research undertaking is carried out within Google Colab, harnessing GPU acceleration through the Keras and TensorFlow environments. When assessing models, both graphical interpretation and numerical measurement are the most reliable approaches. Within our work, a confusion matrix serves as the basis for computing precision, recall, F1 score, and the parameters listed below:
(i) Accuracy: This captures the capability to correctly pinpoint jute pests. It is formulated as
 (3)
(3)
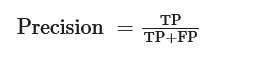
(ii) Precision: This reflects the tally of correctly anticipated positive outcomes the model has produced. It reveals the degree of confidence warranted when its forecasts lean positive. It tackles the question of what fraction of returned instances are actually relevant. It is formulated as
 (4)
(4)
(iii) Recall: Recall operates as a gauge that quantifies accurate positive predictions against the backdrop of all potential positive predictions. It returns the number of relevant instances retrieved. It is formulated as
 (5)
(5)
(iv) F1 score: This designates the harmonic mean struck between recall and precision values. At its core, it is used when comparing two classifiers. The F1 score is invoked to settle which classifier delivers a more desirable trade-off when one demonstrates superior precision while the other boasts better recall. An F1 score of 1 indicates that the classifier operates without error.
 (6)
(6)
(v) ROC AUC: ROC abbreviates receiver operating characteristic. This plots the true positive rate alongside the false positive rate. It ranks among the most prevalent methods for visually assessing model performance, while the area under the curve (AUC) provides a basis for comparing different models.
(vi) Macro Average: This signifies the arithmetic mean taken across each category for precision, recall, and F1 score metrics. It gets utilized to judge the overall performance within multiclass classification contexts and may be formulated as
 (7)
(7)
Where: TP denotes the true positive; TN stands for the true negative; FP marks the false positive; FN indicates the false negative. Under macro-averaging, every category contributes uniformly to the final averaged metric, whereas under weighted-averaging, each category’s input to the average gets scaled according to its magnitude.
The present segment of this article places the outputs generated by five separately customized pre-trained architectures side by side for comparison and contrast. To pinpoint which architecture delivers the most accurate recognition of jute pests, each architecture is evaluated based on accuracy, loss trajectories, confusion matrices, precision, recall, F1 scores, and true-positive versus false-positive proportions. All experimental work was carried out inside the Google Colab platform.
Depictions of the loss and accuracy trajectories for our five customized pre-trained architectures appear in Figure 5 and Figure 6, respectively. A closer look at the data extracted from these plots reveals a telling pattern: spanning epochs 0 through 50, the ResNet50 architecture never settles into a clear ascending or descending path. Consequently, it produces unstable readings across both the training and validation subsets. Conversely, Figures 5 and 6 make plain that for the other quartet of architectures, the loss trajectory dropped in a sustained fashion. In contrast, the accuracy trajectory climbed steadily as the epoch tally increased. Moreover, both the loss and accuracy curves for the validation and training phases reached an optimal fit after 50 epochs, a result wholly consistent with foundational theoretical principles. Such behavior indicates the absence of both overfitting and underfitting. The loss and accuracy pathways traced by InceptionV3 and VGG19 each betrayed faint hints of wavering; still, that variability might be regarded as meaningful. MobileNetV2 and DenseNet201 both show the highest stability in their loss and accuracy curves, whether measured on training or validation data. Irrespective of specific comparisons, this study achieved maximal training accuracy with minimal loss across all four architectures—ResNet50 being the sole outlier—once 50 epochs had passed. The probing effort uncovered four distinct architectures: one with the highest training and validation accuracy, and another with the lowest loss. Taking Figures 5 and 6 as reference points, VGG19 posted the least loss at 0.56 while concurrently attaining the greatest training accuracy at 0.85. The training accuracy measures for the remaining three architectures are within a close range, with 0.9730 for InceptionV3, 0.9860 for MobileNetV2, and 0.9950 for DenseNet201. DenseNet201, for its part, achieved the lowest loss of 0.09. The trajectories mapped in Figures 5 and 6 suggest that, among the five pre-trained candidates, DenseNet201 is the most proficient during training.
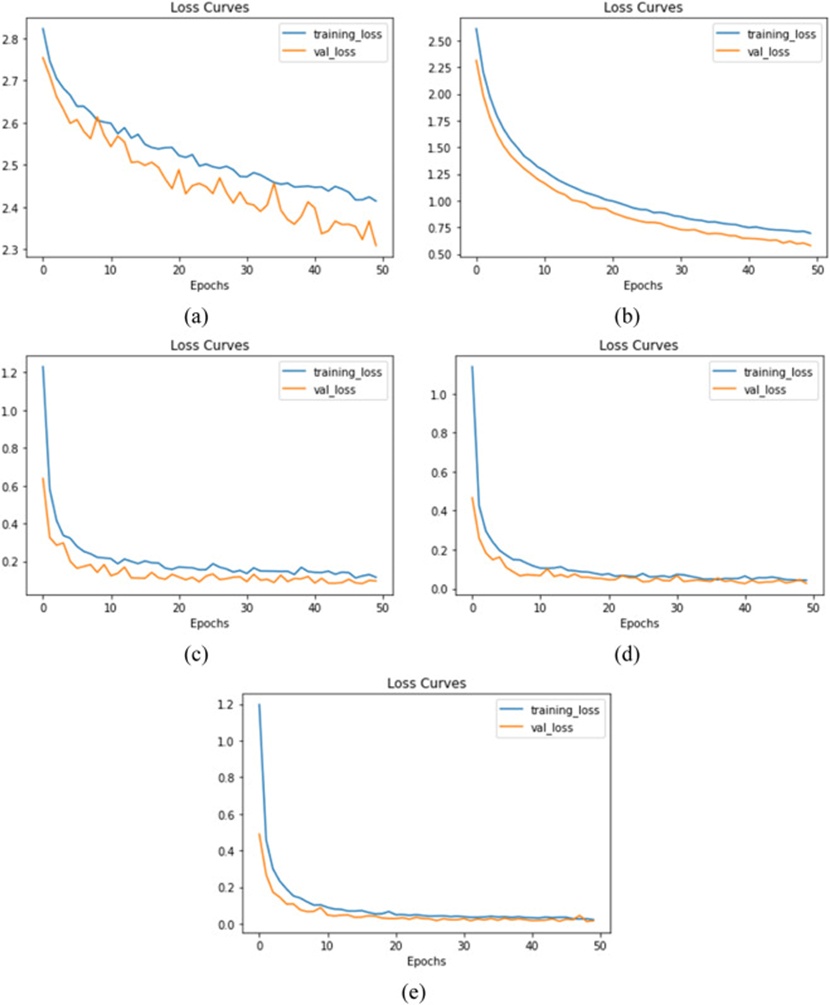
Figure 5. Loss curve (a) ResNet50, (b) VGG19, (c) InceptionV3, (d) MobileNetV2, and (e) DenseNet201.
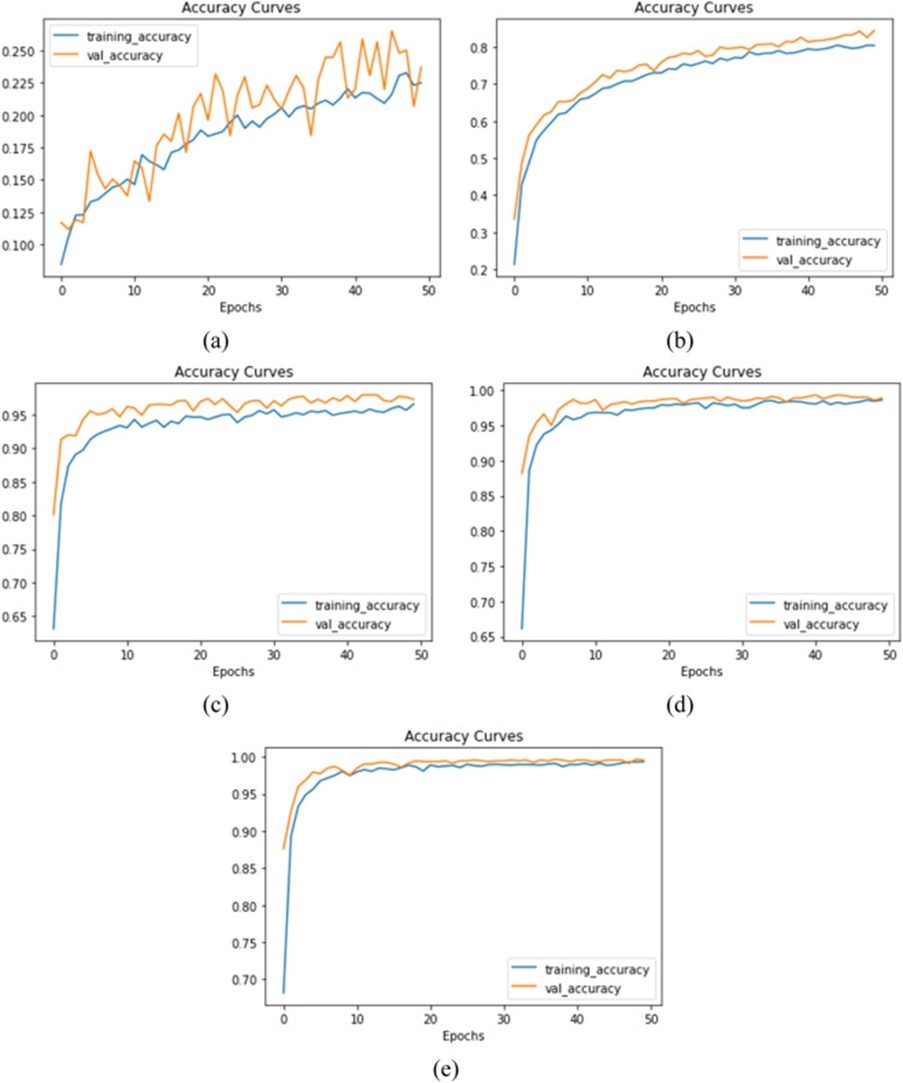
Figure 6. Accuracy curve (a) ResNet50, (b) VGG19, (c) InceptionV3, (d) MobileNetV2, and (e) DenseNet201.
After the training phase wrapped up, each architecture was put through its paces against the testing dataset within our investigation. The architectures were then scrutinized through several complementary lenses. The confusion matrix serves as our chosen instrument for tallying erroneous versus correct classifications. A confusion matrix for each architecture is shown in Figure 7. The outputs from these matrices reveal the counts of true positives, true negatives, false positives, and false negatives for each architecture. Surveying the confusion matrices, this inquiry determined that ResNet50 yields inconsistent and unreliable figures. The remaining quartet of architectures demonstrated a sound ability to sort jute pests into their proper categories. Grounded in Figure 7, when ordered by classificatory strength, the arrangement runs: DenseNet201 first, then MobileNetV2, InceptionV3, and lastly VGG19.
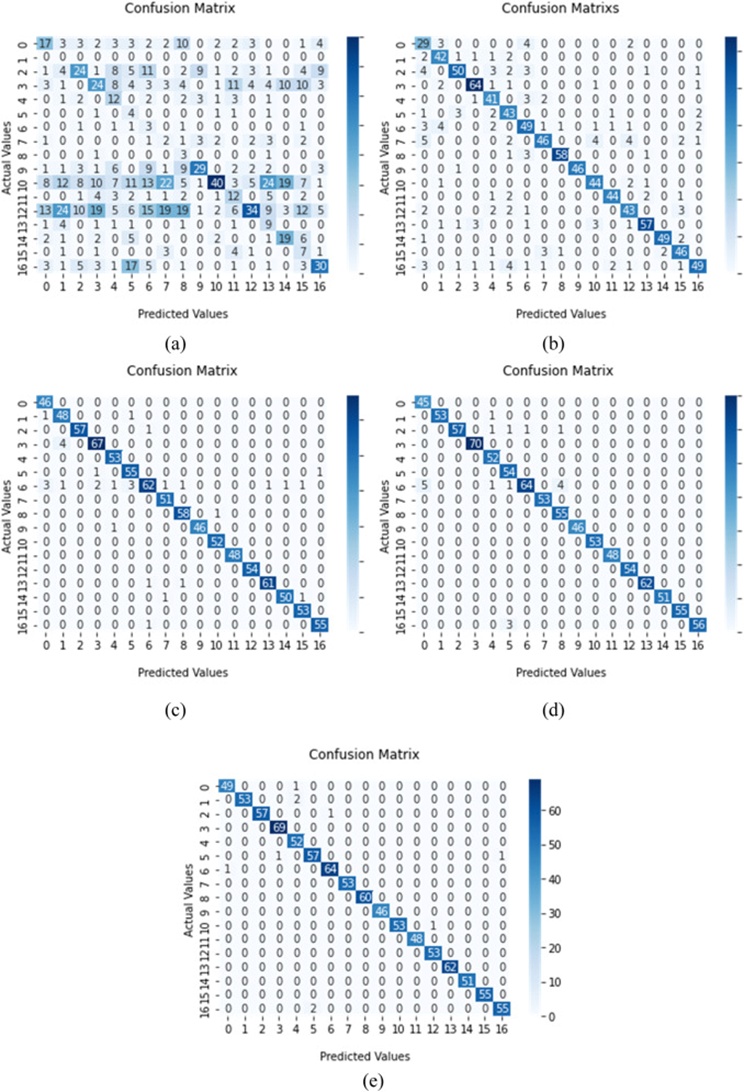
Figure 7. Confusion matrix (a) ResNet50, (b) VGG19, (c) InceptionV3, (d) MobileNetV2, and (e) DenseNet201.
Once the visual scrutiny of architectures through confusion matrices concluded, we moved on to calculating precision, recall, F1 score, and accuracy to facilitate a quantitative assessment. Tables 2-6 present the precision, recall, and F1 scores for each architecture and class, whereas Table 7 summarizes the overall accuracy for each architecture. Across Tables 2-6, ResNet50 achieved extremely low precision, recall, and F1 scores. Strikingly, for the Cutworm class, it returned 0s for precision, recall, and F1 score. It therefore proved incapable of meaningfully sorting the jute pest collection. The other four architectures achieved moderate to high precision, recall, and F1 scores across all classes. Standing head and shoulders above the rest, DenseNet201 occupied the foremost position within each class. Turning to Table 7, macro-average computations are applied. In parallel, ResNet50 remains in a dismal state. VGG19 achieved 84% across precision, recall, and accuracy. InceptionV3, MobileNetV2, and DenseNet201 yielded higher precision, recall, F1 score, and accuracy, with each surpassing its predecessor. At the endpoint, DenseNet201 reached 99% on precision, recall, F1 score, and accuracy. Both InceptionV3 and MobileNetV2 contributed, at least in part, to the correct outputs.The true positive rate and false positive rate for each architecture are also shown in the corresponding ROC curves. Here too, the DenseNet201 architecture attains the highest possible true-positive rate, with the ROC curves for each of the 16 classes approaching 1. Taking stock of the totality of evidence laid out above, this investigation reaches the settled judgment that DenseNet201 holds the superior accuracy and represents the single most powerful methodology for anticipating jute pest incidences.
Table 2. Performance of the customized ResNet50 model in individual classes.
Class name | F1 score (%) | Recall (%) | Precision (%) |
Black hairy | 32 | 30 | 34 |
Cutworm | 0 | 0 | 0 |
Field Cricket | 34 | 28 | 42 |
Indigo caterpillar | 29 | 26 | 34 |
Jute aphid | 29 | 44 | 22 |
Jute hairy | 12 | 50 | 7 |
Jute red mite | 8 | 38 | 5 |
Jute semilooper | 06 | 12 | 4 |
Jute stem girdler | 9 | 60 | 5 |
Jute Stem Weevil | 50 | 42 | 63 |
Jute stick insect | 32 | 20 | 75 |
Leaf beetle | 29 | 35 | 25 |
Mealybug | 27 | 17 | 63 |
Pod borer | 22 | 47 | 15 |
Termite | 43 | 50 | 37 |
Termite odontotermes | 19 | 39 | 13 |
Yellow Mite | 47 | 42 | 54 |
Table 3. Performance of the customized VGG19 model in individual classes.
Class name | F1 score (%) | Recall (%) | Precision (%) |
Black hairy | 66 | 76 | 58 |
Cutworm | 82 | 86 | 79 |
Field cricket | 83 | 78 | 88 |
Indigo caterpillar | 91 | 91 | 91 |
Jute aphid | 80 | 87 | 75 |
Jute hairy | 77 | 83 | 73 |
Jute red mite | 75 | 75 | 75 |
Jute semilooper | 79 | 72 | 87 |
Jute stem girdler | 94 | 92 | 97 |
Jute Stem Weevil | 99 | 98 | 100 |
Jute stick insect | 87 | 92 | 83 |
Leaf beetle | 90 | 88 | 92 |
Mealybug | 80 | 81 | 80 |
Pod borer | 88 | 85 | 92 |
Termite | 95 | 94 | 96 |
Termite odontotermes | 85 | 87 | 84 |
Yellow mite | 81 | 75 | 88 |
Table 4. Performance of the customized InceptionV3 model on individual classes.
Class Name | F1 score (%) | Recall (%) | Precision (%) |
Black hairy | 96 | 100 | 92 |
Cutworm | 93 | 96 | 91 |
Field cricket | 99 | 98 | 100 |
Indigo caterpillar | 95 | 94 | 96 |
Jute aphid | 98 | 100 | 96 |
Jute hairy | 95 | 96 | 93 |
Jute red mite | 87 | 81 | 95 |
Jute semilooper | 98 | 100 | 96 |
Jute stem girdler | 97 | 98 | 97 |
Jute stem weevil | 99 | 98 | 100 |
Jute stick insect | 99 | 100 | 98 |
Leaf beetle | 100 | 100 | 100 |
Mealybug | 100 | 100 | 100 |
Pod borer | 98 | 97 | 98 |
Termite | 97 | 96 | 98 |
Termite odontotermes | 98 | 100 | 96 |
Yellow mite | 98 | 98 | 98 |
Table 5. Performance of the customized MobileNetV2 model on individual classes.
Class name | F1 score (%) | Recall (%) | Precision (%) |
Black hairy | 95 | 100 | 90 |
Cutworm | 99 | 98 | 100 |
Field Cricket | 97 | 93 | 100 |
Indigo caterpillar | 100 | 100 | 100 |
Jute aphid | 97 | 100 | 95 |
Jute hairy | 96 | 100 | 92 |
Jute red mite | 91 | 85 | 98 |
Jute semilooper | 100 | 100 | 100 |
Jute stem girdler | 96 | 100 | 92 |
Jute Stem Weevil | 100 | 100 | 100 |
Jute stick insect | 100 | 100 | 100 |
Leaf beetle | 100 | 100 | 100 |
Mealybug | 100 | 100 | 100 |
Pod borer | 100 | 100 | 100 |
Termite | 100 | 100 | 100 |
Termite odontotermes | 100 | 100 | 100 |
Yellow mite | 97 | 95 | 100 |
Table 6. Performance of the customized DenseNet201 model on individual classes.
Class name | F1 score (%) | Recall (%) | Precision (%) |
Black hairy | 98 | 98 | 98 |
Cutworm | 98 | 96 | 100 |
Field cricket | 99 | 98 | 100 |
Indigo caterpillar | 99 | 100 | 99 |
Jute aphid | 97 | 100 | 95 |
Jute hairy | 97 | 97 | 97 |
Jute red mite | 98 | 98 | 98 |
Jute semilooper | 100 | 100 | 100 |
Jute stem girdler | 100 | 100 | 100 |
Jute stem weevil | 100 | 100 | 100 |
Jute stick insect | 99 | 98 | 100 |
Leaf beetle | 100 | 100 | 100 |
Mealybug | 99 | 100 | 98 |
Pod borer | 100 | 100 | 100 |
Termite | 100 | 100 | 100 |
Termite odontotermes | 100 | 100 | 100 |
Yellow mite | 97 | 96 | 98 |
Table 7. Overall performance (Macro Avg.) of the customized pre-trained model in our dataset.
Model name | Accuracy (%) | F1-score (%) | Recall (%) | Precision (%) |
ResNet50 | 28 | 25 | 34 | 29 |
VGG19 | 84 | 85 | 84 | 84 |
InceptionV3 | 97 | 97 | 97 | 97 |
MobileNetV2 | 98 | 98 | 98 | 98 |
DenseNet201 | 99 | 99 | 99 | 99 |
Spotting jute pests accurately is an urgent requirement for growers aiming to ensure a robust yield of marketable raw jute, as with other agricultural commodities. To render this procedure less burdensome, artificial intelligence—most notably image recognition methods—could act as a powerful instrument, a conclusion validated by the present research harnessing DCNN and TL. The experimental findings, alongside the head-to-head assessment of various deep meta-architectures paired with feature extractors, demonstrated the capacity of this deep-learning-based detector to reliably distinguish 17 distinct pest varieties. Imagery for 2 classes, specifically Hooded Hopper (Otinotus Elongates Distant) and Leaf Miner (Trachys Pacifica Kerr), remained unavailable owing to unsuccessful web scraping attempts. Data augmentation, together with web scraping, supported the compilation of the image repository and may facilitate deeper exploration to construct further models. DenseNet201 achieved the highest accuracy, reaching 99%, outpacing all alternative techniques. The robustness of these techniques was corroborated through precision, F1 score, recall, support vector machines, confusion matrices, loss curves, and accuracy curves.
Our research group devoted considerable effort to building a resilient and trustworthy AI-powered jute pest recognition framework, and it has proven itself capable. The boundaries circumscribing this study are itemized below:
• The non-inclusion of 2 pest varieties, coupled with a comparatively limited number of images.
• We were unable to orchestrate a professional pilot test owing to a shortfall in both authorization and suitable infrastructure. In the near future, we aspire to conduct the pilot test in Bangladesh, where securing the necessary approvals is expected to pose far fewer obstacles.
• At the juncture of writing, the pool of available datasets and scholarly references remains thin, hindering any endeavor to measure our models’ performance with precision.
That said, should we succeed in acquiring a substantially larger corpus of data, it would clear the path toward a more persuasive (and more precise) model operable at scale. Looking forward, the present constraints might be overcome by later researchers equipped with more purposefully captured field photographs, sourced either by research teams or by the farming community themselves. Following additional investigation and validation against an expanded dataset, the model holds promise for commercial rollout to foster agricultural advancement, thereby amplifying jute output and its accompanying economic significance through appropriate adaptation and ongoing enhancement.
None
None
None
None
Open Access The author(s) retain copyright. This article is licensed under the Creative Commons Attribution-NonCommercial-ShareAlike 4.0 International License. It may be shared and adapted for non-commercial purposes with appropriate attribution, an indication of changes, and distribution of adaptations under the same license. Third-party material may be subject to separate terms identified in its credit line. View the license at https://creativecommons.org/licenses/by-nc-sa/4.0/.
 Agro Intelligence Research Press