A novel hybrid AI-driven optimization architecture is proposed to advance climbing perch cultivation in intelligent aquaculture environments, aiming for simultaneous gains in yield and cost performance. By merging Taguchi experimental design with reinforcement learning and metaheuristic strategies, the system pinpoints the key environmental and operational drivers of fish growth and economic return. A multi-objective regression technique is deployed to fine-tune crucial variables, namely water temperature, dissolved oxygen, pH, feeding regimes, and stocking density. The RL-AMIS approach, leveraging Pareto front evaluation and TOPSIS, effectively reconciles the tension between expenditure and output. Empirical outcomes document a 15.3% drop in operating expenses and a 17.8% boost in growth efficiency relative to traditional practice. These insights confirm that AI-based optimization can strengthen scalability and flexibility within aquaculture operations, thereby advancing sustainable production agendas.
Climbing perch (Anabas spp.) occupies an indispensable economic and ecological niche in Southeast Asia, functioning as a primary revenue stream for fish farming communities while contributing to freshwater ecosystem stability. From an ecological perspective, it regulates insect and invertebrate communities, thus promoting biodiversity and water quality [1, 2]. Escalating market demand alongside mounting environmental strain calls for sustainable cultivation approaches that safeguard the species' long-term supply and curb ecological disturbance.
Emerging closed-loop intelligent farming systems seek to elevate productivity and curtail expenditures by manipulating core variables such as water quality, thermal conditions, and dissolved oxygen concentrations [3]. Intelligent platforms enabling continuous environmental surveillance represent a meaningful leap toward reliable, cost-conscious production with diminished resource wastage.
While investigations into biofloc mechanisms and selective breeding have benefited climbing perch farming [4, 5], prior scholarship has not fully woven together multifaceted environmental inputs—encompassing layered water quality metrics, photoperiod, and feed frequency—and genetic heterogeneity within a cohesive optimization construct.
To remedy this identified lacuna, our work fuses Taguchi experimental design with reinforcement learning and metaheuristic computation inside an Artificial Multiple Intelligence System (AMIS), yielding an end-to-end AI-centered optimization suite termed RL-AMIS. This original methodology captures the convoluted interdependencies binding environmental and operational variables in intelligent aquaculture installations, with particular relevance to climbing perch grow-out. Through the systematic calibration of an extensive array of growth determinants, the framework aspires to achieve an ideal compromise between peak biological output and minimal running costs—a pivotal equilibrium for the economically viable and ecologically sound expansion of aquaculture across Southeast Asia [1-3].
The manuscript proceeds in the following sequence: The scholarly literature is first reviewed to construct the study’s intellectual footing. Thereafter, the research methodology and computational results elaborate the methodological apparatus and report the empirical findings, respectively. The inquiry then builds toward the discussion and conclusion, furnishing an in-depth interpretation of the results and concluding reflections that illuminate the ramifications and prospective research trajectories stemming from this work.
The economic and ecological weight of climbing perch across Southeast Asia is considerable, underpinning both localized economies and inland water bodies. Praised for its resilience across fluctuating habitats, the species is a linchpin of artisanal fisheries and aquaculture given its rich nutritional profile and robust consumer appetite [6]. The organism markedly bolsters food security, household income, and the economic fabric of rural populations, accentuating its livelihood significance [7]. Environmentally, the climbing perch is instrumental in preserving the integrity and equilibrium of freshwater habitats. Its occurrence signals the vitality of aquatic ecosystems and enriches the biodiversity foundational to ecological robustness and adaptive capacity [8].
Notwithstanding, climbing perch farming contends with a suite of hurdles, magnified by swelling demand for the species. Unsustainable harvesting techniques and habitat deterioration constitute grave impediments to the durable cultivation of climbing perch [9]. These constraints dramatize the acute necessity for pioneering rearing methodologies capable of ensuring the organism’s prolonged endurance [10, 11]. Tenable management frameworks are imperative for navigating the ecological, societal, and economic dilemmas provoked by aquacultural enterprise, stressing the compulsion to embrace modalities that attenuate environmental footprints while amplifying productive throughput.
Jamu et al. [12] canvass obstacles in climbing perch production, foregrounding the imperative of enduring management to confront ecological, social, and economic predicaments tied to non-renewable fishing conduct. Faruk et al. [13] chart prerequisites for viable climbing perch enterprise, including apposite site selection, water chemistry, fry standard, nutritional regimen, pathogen mitigation, and apt harvesting protocols. These inquiries foreground the twofold asset-climbing perch represents for Southeast Asian livelihoods and habitats, along with the pressing call for durable farming paradigms designed to surmount contemporary bottlenecks in its culture.
For extended engagement with the economic and ecological stature of climbing perch and the impediments to its cultivation, readers may consult the referenced investigations by Chakraborty [9] and Tahir et al. [14]. These sources collectively map the species' multidimensional relevance and the exigency of sustainable aquacultural pathways.
Cutting-edge developments in intelligent aquaculture—particularly within IoT-integrated and AI-governed configurations—have yielded superior command over thermal regimes, oxygenation profiles, and nutritional delivery in recirculating setups [15]. Innovations including biofloc technology, which transforms metabolic byproducts into nutritive resources, alongside genetic refinement, exhibit encouraging potential for accelerating somatic growth in climbing perch [16, 17]. Nonetheless, the bulk of available research retains a generic character, with scant rigorous attention devoted to taxon-specific deployment.
Significantly, though biofloc arrangements boost hydric efficiency and nitrogenous recovery, their amalgamation with AI-fed, instantaneous feedback architectures calibrated for climbing perch remains predominantly uncharted. For illustration, ration modulation and photic scheduling steered by predictive algorithmic outputs are insufficiently exploited. Whereas aquaponic coupling and genomic assortment have conferred sustainability dividends in alternate taxa [18, 19], such interventions have not been adapted to the ethological and physiological particularities of Anabas testudineus.
These progressive steps spotlight the capacity of intelligent cultivation technologies and hereditary upgrading to counteract the previously catalogued difficulties in climbing perch husbandry. Operationalizing such inventive modalities, aquaculture stands poised to realize elevated sustainability margins, operational effectiveness, and volumetric output, thereby contributing beneficially to planetary food provisioning and environmental stewardship.
Contemporary breakthroughs in machine intelligence have substantially refined aquacultural surveillance and governance. AI-fuelled platforms, for instance, are ever more frequently harnessed for ichthyological tracking, ethological profiling, and ambient parameter modulation in real time [20, 21]. These strides have rendered precision aquaculture increasingly deployable and expandable within both investigative and mercantile spheres.
Concurrently, durability appraisals of closed-circuit aquaculture infrastructures are commanding heightened scrutiny, with geographically tailored metrics and ecological benchmarks being advanced to buttress long-run operational feasibility [22]. Such conceptual orientations resonate with the integrated design philosophy propounded in the present contribution.
Within the aquaculture sector, Artificial Intelligence (AI) and Machine Learning (ML) have become pivotal, disruptive forces, supplying novel mechanisms for refining environmental parameters, forecasting growth trajectories, and strengthening decision-making frameworks. The adoption of these technologies has paved the way for more intelligent and responsive systems in sustainable fish production.
A fundamental deployment of AI and ML involves machine learning for operations like dimensioning, mass estimation, grading, pathology identification, and taxonomic sorting [23]. Concurrently, deep learning—a specialized branch of ML—stands out for its inherent capacity to autonomously extract hierarchical features directly from unprocessed inputs, yielding strong outcomes in tasks related to identification, categorization, enumeration, and forecasting [24].
Another vital application lies in predictive modeling of environmental determinants, where AI and ML have demonstrated precision in forecasting aquatic conditions. This capability bolsters the management of water quality and mitigates operational hazards [25]. In the same vein, the fusion of Internet of Things (IoT) infrastructures with Machine Learning algorithms has been leveraged for the continuous monitoring and prediction of water quality metrics, facilitating swift interventions and helping to circumvent output losses [26].
Sophisticated ML algorithms, exemplified by KNN and decision tree regression, have attained remarkable predictive fidelity—as high as 99%—when modeling fish development within regulated environments [27]. In related work, Dhal and Kar [28] evaluated a suite of AI methodologies for anticipating growth in aquaponic systems, stressing the resilience of model performance amidst variable environmental dynamics.
Notwithstanding these achievements, the implementation of instantaneous, autonomous feedback loops in AI—particularly systems driven by reinforcement learning (RL)—is still nascent in aquaculture. A pioneering study by Son and Jeong [29] presented an RL-based self-regulating feeding apparatus, underscoring the substantial opportunity to diminish feed squandering and elevate feed-to-mass ratios. Nevertheless, such intelligent frameworks have yet to be transposed to the specific domain of climbing perch cultivation.
In another contribution, Hasan et al. [30] harnessed deep learning architectures to foresee mortality rates and biomass accumulation in compact, sensor-equipped pisciculture setups, confirming that AI methodologies can be scaled effectively even under considerable resource limitations. A persistent shortcoming, though, is that these analytical engines typically chase isolated targets (such as either growth maximization or quality enhancement), neglecting the intricate, multi-dimensional compromises between biological yield and economic expenditure.
The wider repercussions of integrating AI and ML into pisciculture—specifically through methodologies like the Taguchi design, reinforcement learning paradigms, and metaheuristic optimization—represent a substantial leap forward for the discipline. These sophisticated tools bridge persistent deficiencies by generating resolutions for fine-tuning rearing conditions, amplifying throughput, and curtailing operational outlays, thereby underpinning the enduring viability of aquaculture enterprises.
The aquaculture industry is confronted with the critical imperative of harmonizing high productivity with stringent cost management to secure its long-lasting relevance in an era of escalating worldwide hunger for fish-derived protein. As humanity’s dependence on farmed seafood intensifies, the adoption of methods that are both fiscally prudent and ecologically benign shifts from being preferable to essential.
Investigators are continuously honing cultivation techniques to shrink ecological disturbances. Strategies oriented toward sustainability, such as integrated multi-trophic polyculture and open-ocean installations, exhibit potential for augmenting systemic sustainability [31]. Yet, the practical efficacy of prevailing eco-certification protocols in genuinely fostering the health of marine ecosystems remains a point of contention, hinting at an urgent need for governance models that are attuned to the socio-economic realities of coastal communities and that customize spatial management of aquaculture zones [32].
A predominant motif in scholarly discourse is the confluence of aquaculture’s macroeconomic value and its biophysical footprint. Systematic inquiries probe the environmental ramifications and long-term viability quandaries, offering indispensable perspectives for holistic consequence evaluations and the shaping of regulatory frameworks [33]. Transnational policy comparisons, notably analyses contrasting the models of Singapore and Norway, reveal how profoundly feed sourcing and processing dictate the overall ecological performance of aquaculture operations [34].
Securing a future for sustainable seafood output demands a multi-pronged strategic assault. Impediments include the necessity for an all-encompassing systemic grasp of the issues, the generation of groundbreaking remedies, and the cultivation of policy ecosystems that nurture sustainable expansion. Any equilibrium-seeking strategy must integrally weave together environmental integrity, social equity, and fiscal feasibility [35]. The scenario in Thailand vividly illustrates a locale where acute environmental stressors—such as biotope degradation, effluent discharge, and cascading ecological disruptions—necessitate forceful regulatory countermeasures to shield the aquaculture industry’s future trajectory [36].
In a bid to sculpt a sector that is simultaneously fecund and sustainable, scholars have posited four tangible, action-oriented objectives: the refinement of operational husbandry protocols, the devolution of decision-making authority with heavy investment in human capital, the fortification of risk mitigation mechanisms, and the establishment of value-chain differentiators that spotlight and champion eco-consciously farmed seafood [37]. Concomitantly, bolstering federal environmental oversight bodies, enacting legislative modernization, and imposing more rigorous enforcement are perceived as indispensable levers for curtailing detrimental externalities and cultivating a truly sustainable aquaculture paradigm [38].
The quintessential mission of reconciling commercial viability with planetary stewardship is intrinsically coupled to the sector’s potential to sustainably satiate the global protein deficit. Weaving together avant-garde practices with robust policies that confront the multifaceted ecological, financial, and societal dimensions will establish the industry as an indispensable pillar of food security, simultaneously acting as a guardian of fragile ecosystems.
To maximize lucidity and ensure replicability, this segment is bifurcated into two subsections. The first subsection elucidates the experimental architecture and the protocols for data acquisition utilized in the climbing perch study. The second subsection presents the optimization blueprint, which employs a synergistic Reinforcement Learning–Artificial Multiple Intelligence System (RL-AMIS) designed to pinpoint economically optimal aquaculture parameter settings.
The chosen experimental framework employs the Taguchi method within aquaculture science, specifically targeting the dissection of complex growth determinants pertinent to the husbandry of climbing perch. The Taguchi method constitutes a highly efficient statistical instrument that maximizes the economy of parameter estimation, permitting the simultaneous scrutiny of a wide array of variables while compressing the requisite number of empirical trials to an absolute minimum. Contrasted with a comprehensive full factorial design, which would explosively demand 19,683 distinct experimental runs (3⁹ permutations) to cover nine parameters, the Taguchi matrix elegantly condenses this into a mere 27 treatments. This radical condensation makes the empirical work feasible given the pragmatic constraints imposed by limited time, financial budgets, and physical resources. Although Response Surface Methodology (RSM) also offers a path to experimental reduction, its applicability is still more constrained at this scale and typically presupposes a smaller set of factors than the complex matrix tackled here.
The Taguchi framework proffers a suite of compelling benefits: a highly efficient traversal of the parametric landscape, the dexterity to hierarchically rank dominant factors, the sensitivity to isolate variances that critically modulate piscine development, and the pragmatism to operate within tight fiscal and chronological fences. A theoretical limitation is the method’s built-in assumption that interaction effects are either non-existent or of marginal consequence; within our investigation, this shortcoming is deliberately counterbalanced by a subsequent multi-objective optimization stage (the RL-AMIS), which inherently models the non-linear synergistic interactions among variables. Consequently, the marriage of Taguchi’s design-of-experiments with AI-driven metaheuristic optimization yields a dialectic architecture that marries empirical pragmatism with computational intensity. The chosen factors and their calibrated tiers are cataloged in Table 1.
Table 1. Experimental parameters and levels for climbing perch cultivation.
Parameters | Definitions | Types of parameters | Levels of parameters | Notes | References |
Climbing perch species | Refers to the dominant species of climbing perch present in the culture environment. | Category | 1. Anabas testudineus (Thai Climbing Perch) 2. Anabas oligolepis (Arched Climbing Perch) 3. Anabas senegalensis (Senegal Climbing Perch) | 1. The most common and widely recognized species, originally from Thailand. 2. Frequently observed in central and northeastern Thailand, characterized by a more curved body form. 3. An introduced species that is more prevalent in other Southeast Asian areas. | |
Water temperature | Indicates the temperature conditions maintained within the tank system. | Category | Low: 24 °C Medium: 27 °C High: 30 °C | Maintaining the proper temperature range is important for fish growth and overall health, with adjustments recommended according to seasonal variation. | |
Dissolved oxygen levels | Represents the concentration of oxygen dissolved in the water. | Category | Low: 3 mg/L Medium: 5 mg/L High: 7 mg/L | Adequate oxygen levels are essential for metabolism and minimizing stress in fish. | |
pH levels | Describes the degree of acidity or alkalinity in the water. | Category | Low: 6.0 Medium: 7.0 High: 8.0 | Water pH influences fish well-being as well as nutrient accessibility. | |
Feeding schedule | Refers to both the feeding frequency and the type of feed provided to the fish. | Category | Low: 2 times/day Medium: 3 times/day High: 4 times/day | Feeding frequency has a direct effect on growth performance; increased feeding frequency may enhance growth rates. | |
Water quality parameters/Ammonia | Measures the concentration of ammonia present in the water. | Category | Low: 0.01 mg/L Med: 0.1 mg/L High: 0.2 mg/L | Elevated ammonia concentrations are harmful; maintaining low to moderate levels is essential. | |
Water quality parameters/Nitrites | Measures nitrite concentration in the aquatic environment. | Category | Low: 0.25 mg/L Med: 0.5 mg/L High: 1 mg/L | Nitrite accumulation can negatively affect fish health and should be monitored regularly. | |
Water quality parameters/Nitrates | Measures nitrate concentration within the water system. | Category | Low: 10 mg/L Med: 20 mg/L High: 40 mg/L | Excessive nitrate levels may reduce water quality and impact fish performance. | |
Light exposure | Refers to the duration and intensity of light exposure experienced by the fish. | Category | Low: 6 h/day Medium: 9 h/day High: 12 h/day | Light conditions influence physiological functions and growth; adjustments may be needed at different growth phases. | |
Stocking density | Indicates the number of fish reared per liter of water. | Category | Low: 0.5 fish/L Medium: 1 fish/L High: 1.5 fish/L | Overcrowding may increase stress and disease susceptibility; appropriate density should be maintained for optimal growth. | |
Growing periods | Refers to the length of time from stocking until harvest. | Category | Early: 5 months Standard: 7 months Extended: 9 months | Earlier harvests may produce smaller fish but allow faster production cycles, whereas standard and extended periods support larger fish size but demand more resources. |
To ensure terminological precision and logical consistency across the procedural and optimization narrative, this section delineates all constitutive symbols, parameters, and mathematical entities utilized within the regression constructs, the RL-AMIS computational loop, and the multi-objective decision calculus. These symbolic conventions serve as the semantic and mathematical substrate for the experimental blueprint, the algorithmic simulations, and the subsequent performance diagnostics. A consolidated glossary of these notational elements and their respective definitions is tabulated in Table 2.
Table 2. Notations and definitions of variables used throughout the study.
Symbol/Notation | Description |
FW | Fresh weight of climbing perch measured in kilograms (kg), used as a response variable. |
OC | Operational and material expenses expressed in Baht are considered a response variable. |
CPS | Climbing perch species, including A. testudineus, A. oligolepis, and A. senegalensis. |
WT | Water temperature measured in degrees Celsius (°C). |
DOL | Dissolved oxygen concentration in water, measured in milligrams per liter (mg/L). |
pH | Indicates the acidity or alkalinity level of the water. |
FS | Feeding frequency provided to fish, expressed as times per day. |
WQA | Water quality parameter representing ammonia concentration (mg/L). |
WQNi | Water quality parameter corresponding to nitrite concentration (mg/L). |
WQNa | Water quality parameter corresponding to nitrate concentration (mg/L). |
LE | Duration of light exposure measured in hours per day. |
SD | Stocking density, expressed as the number of fish per liter of water. |
GP | Growth duration or cultivation period is measured in months. |
β₀ to β₁₁ | Regression coefficients applied in linear predictive modeling. |
Xijt | Encoded representation of the j-th parameter in the i-th work package during iteration t, utilized in RL-AMIS. |
Yijt | Decoded parameter value associated with Xijt. |
Zₙ | Objective function value, where n = 1 represents productivity and n = 2 represents cost. |
fti* | Combined objective value for solution i at iteration t. |
HV | The hypervolume metric is used to evaluate the convergence and diversity of the Pareto front. |
ARP | Average Ratio of Pareto-optimal solutions, used as a performance assessment indicator. |
IB | Intelligence Box, an algorithmic component integrated within RL-AMIS. |
WP | Work Package, referring to a solution vector used in the optimization procedure. |
TOPSIS | Technique for Order of Preference by Similarity to Ideal Solution, a ranking and decision-making approach. |
FW | Fresh weight of climbing perch in kilograms (kg), treated as a response variable. |
OC | Operational and material cost measured in Baht and treated as a response variable. |
CPS | Species classification of climbing perch: A. testudineus, A. oligolepis, and A. senegalensis. |
WT | Water temperature recorded in °C. |
DOL | Dissolved oxygen level in water is measured in mg/L. |
pH | Water pH value indicating acidity or alkalinity. |
To systematically deconstruct the multivariate influence of ecological and managerial levers on the growth kinetics of climbing perch, we operationalized a plan of 27 meticulously orchestrated treatments conforming to the Taguchi orthogonal array. Within each treatment, cardinal parameters—spanning taxonomic identity, thermal regime, oxygen saturation, pH, nutritional cadence, biochemical water quality proxies, photoperiodicity, organism density, and cultivation duration—were methodically manipulated to emulate a wide spectrum of authentic aquaculture settings. Table 3 collates these factorial arrangements, providing a blueprint for the systematic dissection of both univariate main effects and their multivariate interplays, ultimately guiding the deduction of optimal husbandry strategies.
Table 3. Experimental treatments for assessing growth parameters in climbing perch.
T | CPS | WT | DOL | pH | FS | WQA | WQNi | WQNa | LE | SD | GP |
1 | Testudineus | 24 | 3 | 6 | 2 | 0.01 | 0.25 | 10 | 6 | 0.5 | 5 |
2 | Testudineus | 24 | 3 | 6 | 3 | 0.10 | 0.50 | 20 | 9 | 1 | 7 |
3 | Testudineus | 24 | 3 | 6 | 4 | 0.20 | 1.00 | 40 | 12 | 1.5 | 9 |
4 | Testudineus | 27 | 5 | 7 | 2 | 0.01 | 0.25 | 20 | 9 | 1 | 9 |
5 | Testudineus | 27 | 5 | 7 | 3 | 0.10 | 0.50 | 40 | 12 | 1.5 | 5 |
6 | Testudineus | 27 | 5 | 7 | 4 | 0.20 | 1.00 | 10 | 6 | 0.5 | 7 |
7 | Testudineus | 30 | 7 | 8 | 2 | 0.01 | 0.25 | 40 | 12 | 1.5 | 7 |
8 | Testudineus | 30 | 7 | 8 | 3 | 0.10 | 0.50 | 10 | 6 | 0.5 | 9 |
9 | Testudineus | 30 | 7 | 8 | 4 | 0.20 | 1.00 | 20 | 9 | 1 | 5 |
10 | Oligolepis | 24 | 5 | 8 | 2 | 0.10 | 1.00 | 10 | 9 | 1.5 | 5 |
11 | Oligolepis | 24 | 5 | 8 | 3 | 0.20 | 0.25 | 20 | 12 | 0.5 | 7 |
12 | Oligolepis | 24 | 5 | 8 | 4 | 0.01 | 0.50 | 40 | 6 | 1 | 9 |
13 | Oligolepis | 27 | 7 | 6 | 2 | 0.10 | 1.00 | 20 | 12 | 0.5 | 9 |
14 | Oligolepis | 27 | 7 | 6 | 3 | 0.20 | 0.25 | 40 | 6 | 1 | 5 |
15 | Oligolepis | 27 | 7 | 6 | 4 | 0.01 | 0.50 | 10 | 9 | 1.5 | 7 |
16 | Oligolepis | 30 | 3 | 7 | 2 | 0.10 | 1.00 | 40 | 6 | 1 | 7 |
17 | Oligolepis | 30 | 3 | 7 | 3 | 0.20 | 0.25 | 10 | 9 | 1.5 | 9 |
18 | Oligolepis | 30 | 3 | 7 | 4 | 0.01 | 0.50 | 20 | 12 | 0.5 | 5 |
19 | Senegal | 24 | 7 | 7 | 2 | 0.20 | 0.50 | 10 | 12 | 1 | 5 |
20 | Senegal | 24 | 7 | 7 | 3 | 0.01 | 1.00 | 20 | 6 | 1.5 | 7 |
21 | Senegal | 24 | 7 | 7 | 4 | 0.10 | 0.25 | 40 | 9 | 0.5 | 9 |
22 | Senegal | 27 | 3 | 8 | 2 | 0.20 | 0.50 | 20 | 6 | 1.5 | 9 |
23 | Senegal | 27 | 3 | 8 | 3 | 0.01 | 1.00 | 40 | 9 | 0.5 | 5 |
24 | Senegal | 27 | 3 | 8 | 4 | 0.10 | 0.25 | 10 | 12 | 1 | 7 |
25 | Senegal | 30 | 5 | 6 | 2 | 0.20 | 0.50 | 40 | 9 | 0.5 | 7 |
26 | Senegal | 30 | 5 | 6 | 3 | 0.01 | 1.00 | 10 | 12 | 1 | 9 |
27 | Senegal | 30 | 5 | 6 | 4 | 0.10 | 0.25 | 20 | 6 | 1.5 | 5 |
Within the executed empirical study, the biological performance of the climbing perch, Anabas testudineus, housed within technologically sophisticated recirculating aquaculture microcosms—specifically, intelligent tanks measuring 1 m × 1 m × 1 m—was subjected to rigorous quantification. The primary experimental objective was to deconstruct the deterministic influence of nine pivotal environmental and procedural variables on the fishes’ incremental accretion of fresh biomass, established as the premier proxy for physiological growth efficiency. The scrutinized variables comprised Climbing Perch Species, Water Temperature, Dissolved Oxygen Levels, pH Levels, Feed Type, Water Quality Parameters, Light Exposure, Stocking Density, and Growing Periods.
In parallel, the fiscal pragmatism of each experimental configuration was appraised through a meticulous compilation of the aggregate operational expenditure. This financial metric was deconstructed into two principal cost centers: (1) the cumulative electrical energy consumption required to servo-regulate water temperature, dissolved oxygen levels, water quality parameters, and light exposure across the entire growing periods, and (2) the supplementary operational disbursements, which encapsulate the procurement streams for fingerlings, oxygen, chemical titrants for pH homeostasis, feed, installation and depreciation of lighting infrastructure, and overarching administrative oversight of the cultivation cycles.
Harnessing the analytical engine of Design-Expert software, a holistic multivariate regression model was architected to mathematically encode the functional relationship between the aforementioned independent factors and a dyadic set of dependent response variables: (1) the fresh weight of the climbing perch, serving as a barometer of biophysiological achievement, and (2) the total operational cost, embodying the criterion of economic thrift. The regression function was engineered to isolate statistically significant predictors and their emergent interaction terms, crystallizing insights for the concurrent optimization of both biological fecundity and economic efficiency.
An illustrative excerpt of the empirical data harvested from the experiment is displayed in Table 4, and a prototypical snapshot of the regression model’s structure is exhibited in Table 5.
Table 4. Optimization of aquaculture parameters for Anabas species using Taguchi experimental design.
T | CPS | WT | DOL | pH | FS | WQA | WQNi | WQNa | LE | SD | GP | Fresh Weight | Operating Cost |
1 | Testudineus | 24 | 3 | 6 | 2 | 0.01 | 0.25 | 10 | 6 | 0.5 | 5 | 52.13 | 2595.92 |
2 | Testudineus | 24 | 3 | 6 | 3 | 0.10 | 0.50 | 20 | 9 | 1 | 7 | 50.50 | 3281.16 |
3 | Testudineus | 24 | 3 | 6 | 4 | 0.20 | 1.00 | 40 | 12 | 1.5 | 9 | 42.25 | 4057.42 |
4 | Testudineus | 27 | 5 | 7 | 2 | 0.01 | 0.25 | 20 | 9 | 1 | 9 | 47.53 | 3379.95 |
5 | Testudineus | 27 | 5 | 7 | 3 | 0.10 | 0.50 | 40 | 12 | 1.5 | 5 | 37.05 | 3443.22 |
6 | Testudineus | 27 | 5 | 7 | 4 | 0.20 | 1.00 | 10 | 6 | 0.5 | 7 | 56.55 | 2955.93 |
7 | Testudineus | 30 | 7 | 8 | 2 | 0.01 | 0.25 | 40 | 12 | 1.5 | 7 | 34.08 | 3542.01 |
8 | Testudineus | 30 | 7 | 8 | 3 | 0.10 | 0.50 | 10 | 6 | 0.5 | 9 | 52.45 | 3037.33 |
9 | Testudineus | 30 | 7 | 8 | 4 | 0.20 | 1.00 | 20 | 9 | 1 | 5 | 51.85 | 3103.56 |
10 | Oligolepis | 24 | 5 | 8 | 2 | 0.10 | 1.00 | 10 | 9 | 1.5 | 5 | 57.30 | 3044.73 |
11 | Oligolepis | 24 | 5 | 8 | 3 | 0.20 | 0.25 | 20 | 12 | 0.5 | 7 | 44.55 | 3246.01 |
12 | Oligolepis | 24 | 5 | 8 | 4 | 0.01 | 0.50 | 40 | 6 | 1 | 9 | 24.28 | 3044.36 |
13 | Oligolepis | 27 | 7 | 6 | 2 | 0.10 | 1.00 | 20 | 12 | 0.5 | 9 | 65.45 | 4095.16 |
14 | Oligolepis | 27 | 7 | 6 | 3 | 0.20 | 0.25 | 40 | 6 | 1 | 5 | 32.60 | 2853.07 |
15 | Oligolepis | 27 | 7 | 6 | 4 | 0.01 | 0.50 | 10 | 9 | 1.5 | 7 | 70.83 | 3652.27 |
16 | Oligolepis | 30 | 3 | 7 | 2 | 0.10 | 1.00 | 40 | 6 | 1 | 7 | 25.75 | 2880.82 |
17 | Oligolepis | 30 | 3 | 7 | 3 | 0.20 | 0.25 | 10 | 9 | 1.5 | 9 | 52.50 | 3335.18 |
18 | Oligolepis | 30 | 3 | 7 | 4 | 0.01 | 0.50 | 20 | 12 | 0.5 | 5 | 51.13 | 3244.90 |
19 | Senegal | 24 | 7 | 7 | 2 | 0.20 | 0.50 | 10 | 12 | 1 | 5 | 64.35 | 3388.83 |
20 | Senegal | 24 | 7 | 7 | 3 | 0.01 | 1.00 | 20 | 6 | 1.5 | 7 | 55.33 | 3267.10 |
21 | Senegal | 24 | 7 | 7 | 4 | 0.10 | 0.25 | 40 | 9 | 0.5 | 9 | 33.45 | 3456.17 |
22 | Senegal | 27 | 3 | 8 | 2 | 0.20 | 0.50 | 20 | 6 | 1.5 | 9 | 35.00 | 2885.26 |
23 | Senegal | 27 | 3 | 8 | 3 | 0.01 | 1.00 | 40 | 9 | 0.5 | 5 | 26.13 | 2829.76 |
24 | Senegal | 27 | 3 | 8 | 4 | 0.10 | 0.25 | 10 | 12 | 1 | 7 | 53.00 | 3287.08 |
25 | Senegal | 30 | 5 | 6 | 2 | 0.20 | 0.50 | 40 | 9 | 0.5 | 7 | 33.55 | 3269.32 |
26 | Senegal | 30 | 5 | 6 | 3 | 0.01 | 1.00 | 10 | 12 | 1 | 9 | 72.78 | 4074.07 |
27 | Senegal | 30 | 5 | 6 | 4 | 0.10 | 0.25 | 20 | 6 | 1.5 | 5 | 49.30 | 2850.11 |
Table 5. Regression coefficients for predicting fresh weight and operating/material cost.
Empty cell | β0 | β1 | β2 | β3 | β4 | β5 | β6 | β7 | β8 | β9 | β10 | β11 | R² | RMSE |
Fresh weight (Kg) | 71.287 | - 0.148 | -0.014 | 2.000 | -5.042 | 0.972 | 12.292 | 7.976 | -0.899 | 1.505 | 2.028 | 0.107 | 0.921 | 3.52 |
Operating and material cost (Baht) | 52.460 | - 0.083 | -0.027 | 1.493 | -4.082 | 0.851 | -8.520 | 6.945 | -0.009 | 3.006 | 4.034 | 3.009 | 0.906 | 114.47 |
Deriving grounds from the empirical records in Table 4, the fresh weight metric for the fish specimens was ascertained via a digital gravimetric scale. The operating cost was synthesized by summing the major fiscal bleeding points typical of aquaculture ventures, including utility overheads (electrical grids and hydraulic supply), feed acquisition logistics and silage, labor remuneration, chemical reagents for aquatic remediation, illumination arrays, and diffuse administrative burdens (e.g., bureaucratic overhead and hardware serviceability). The ensuing numerical matrices constituted the training foundation for a regression model to prognosticate both the fresh weight yields and the operating cost consequences.
For computational architectural modeling, the entire vector of regression coefficients (β) was estimated via the Design-Expert numerical suite. The predictive model assimilates 11 regressors, each signifying a distinct aquaculture parameter, as formally expressed in Eq. 1. It is critical to underscore that Climbing Perch Species (β₁) represents a polytomous categorical variable instantiated in three distinct states—Anabas testudineus, Anabas oligolepis, and Anabas senegalensis. To seamlessly incorporate this nominal variable into the linear modeling schema, a dummy variable encoding convention was executed, injecting two dichotomous binary vectors: one flagging the presence of Anabas oligolepis and another denoting Anabas senegalensis, while implicitly casting Anabas testudineus as the referential baseline category. This parameterization tactic empowers the model to isolate species-specific idiosyncratic effects while retaining full analytical tractability and congruence with the axioms of linear regression.
The definitive predictive equation is articulated in Eq. 1, with the commensurate regression coefficient matrices itemized in Table 5. Moreover, both inferential models showcased robust statistical goodness-of-fit diagnostics. The predictive framework for fresh weight yielded a coefficient of determination (R²) of 0.921 associated with a Root Mean Square Error (RMSE) of 3.52 kg, whereas the expenditure forecasting model generated an R² of 0.906 conjoined with an RMSE of 114.47 Baht. These statistical validations robustly confirm the models’ predictive potency and their dependability as decision-support instruments in the aquaculture operational theater.
 (1)
(1)
The objective function architectures delineated in the prior exposition will be subjected to a computational optimization regimen leveraging a hybridized metaheuristic engine that fuses reinforcement learning with the artificial multiple intelligent system (AMIS), a construct designated by the portmanteau "RL-AMIS." The optimization iterative search will be bounded and constrained by the parametric hypercube defined through Eq. 2 to Eq. 10, systematically cataloged in Table 6.
Table 6. Parameter constraints for the climbing perch species aquaculture experiment.
Parameters | Lower and upper-level constraints | Equation |
Climbing perch species | (2) | |
Water temperature | Greater than or equal to 24 °C and less than or equal to 30 °C | (3) |
Dissolved oxygen levels | Greater than or equal to 3 mg/L and less than or equal to 7 mg/L | (4) |
pH levels | Greater than or equal to 6.0 and less than or equal to 8.0 | (5) |
Feed type and feeding schedule | Greater than or equal to 2 times/day and less than or equal to 4 times/day | (6) |
Water quality parameters | Ammonia: greater than or equal to 0.01 mg/L and less than or equal to 0.2 mg/L; Nitrites: greater than or equal to 0.25 mg/L and less than or equal to 1 mg/L; Nitrates: greater than or equal to 10 mg/L and less than or equal to 40 mg/L | (7) |
Light exposure | Greater than or equal to 6 h/day and less than or equal to 12 h/day | (8) |
Stocking density | Greater than or equal to 0.5 fish/L and less than or equal to 1.5 fish/L | (9) |
Growing periods |
| (10) |
The practical execution of the experiment is situated within the smart fishery farming infrastructure, as conceptually diagrammed in Figure 1. This schematic depicts an integrated, cyber-physical aquaculture ecosystem meticulously tailored for Climbing Perch, merging a physical hardware stratum with a supervisory software stratum to conjure ideal morphogenetic environments. The physical hardware constellation comprises structurally resilient fish containment tanks and a distributed network of environmental transducers that continuously assay the aquatic milieu—capturing thermal flux, ionic potential (pH), dissolved gaseous fractions, and metabolized nutrient loads. The operational nexus of this physical layer is a centralized programmable logic controller (alternatively, an Arduino or Raspberry Pi microarchitecture) that ingests and parses the sensory data stream to orchestrally modulate the habitat via a series of specific actuator modules. These effectors precisely govern thermal regulation, oxygen perfusion, chemical buffering for pH stabilization, and temporal feed dispensing, all augmented by dynamically tunable solid-state LED luminaries and high-fidelity optical surveillance cameras for non-invasive ichthyological health assessment.
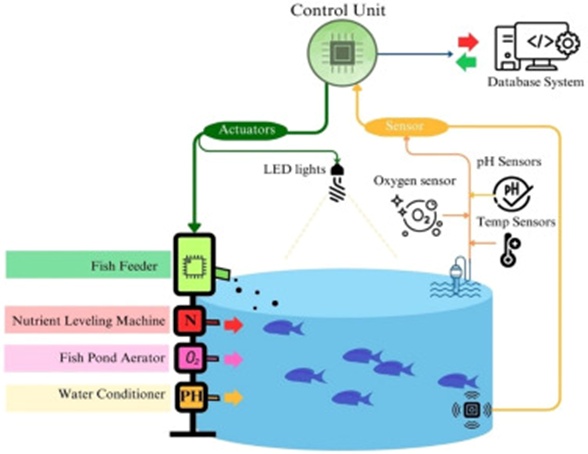
Figure 1. Integrated aquaculture control center for sustainable climbing perch farming.
Within the supervisory cyber-domain, a dedicated data ingestion software pipeline accumulates the sensor flux, which a proprietary process-control application algorithmically sifts through to command the actuator network with high precision. A relational data warehouse infrastructure persistently archives the resultant time-series data, which is subsequently deconstructed using advanced analytical ecosystems such as MATLAB, the R statistical computing environment, or Python-based scientific libraries to discover optimal growth correlates. System operators are afforded the capability for real-time remote surveillance and parametric intervention via an ergonomically designed graphical human-machine interface.
The commissioning of this intelligent farming installation involves the physical interlocking of hardware modules, the deployment and configuration of the requisite software stacks, and the execution of exhaustive multi-point calibration protocols to assure operational integrity. Perpetual telemetry analysis enables dynamic, adaptive environmental micro-tuning, whilst systematic prophylactic maintenance routines guarantee system resilience and extended operational longevity. This holistically integrated approach amplifies the production efficacy of climbing perch cultivation by artfully equilibrating the tripartite demands of biological productivity, capital efficiency, and the moral imperatives of responsible aquaculture. The intelligent farming implementation utilized in this research is visually documented in Figure 1.
The RL-AMIS framework, depicted in Figure 2, incorporates five interconnected stages crafted to fine-tune aquaculture variables for climbing perch by fusing reinforcement learning (RL) with a collection of intelligent heuristics (called Intelligence Boxes or IB). The workflow initiates with the creation of candidate configurations termed work packages (WP), with each one packaging normalized figures for nine essential input variables (e.g., water temperature, pH level, feeding schedule). A reinforcement learning-driven selection mechanism then allocates these WPs to particular IBs, drawing on past performance data to inform smart routing choices. Every IB corresponds to a separate optimization technique (e.g., Genetic Algorithm, Water Cycle Algorithm, Momentum Search) and polishes its designated WPs to elevate solution caliber. Following refinement, WPs are assessed against twin core goals—boosting fresh weight while cutting operational cost—applying Pareto Front Optimization (PFO) to single out non-dominated outcomes, after which TOPSIS orders the alternatives relative to an ideal benchmark. The cycle repeats alongside heuristic refreshes until a designated stopping point is reached (for instance, a preset iteration count or convergence threshold). Through this blended setup, RL-AMIS capitalizes on both the adaptive learning power of RL and the pinpoint efficiency of varied heuristic approaches, delivering a supple and sturdy pathway to uncovering prime conditions for sustainable, cost-conscious aquaculture.
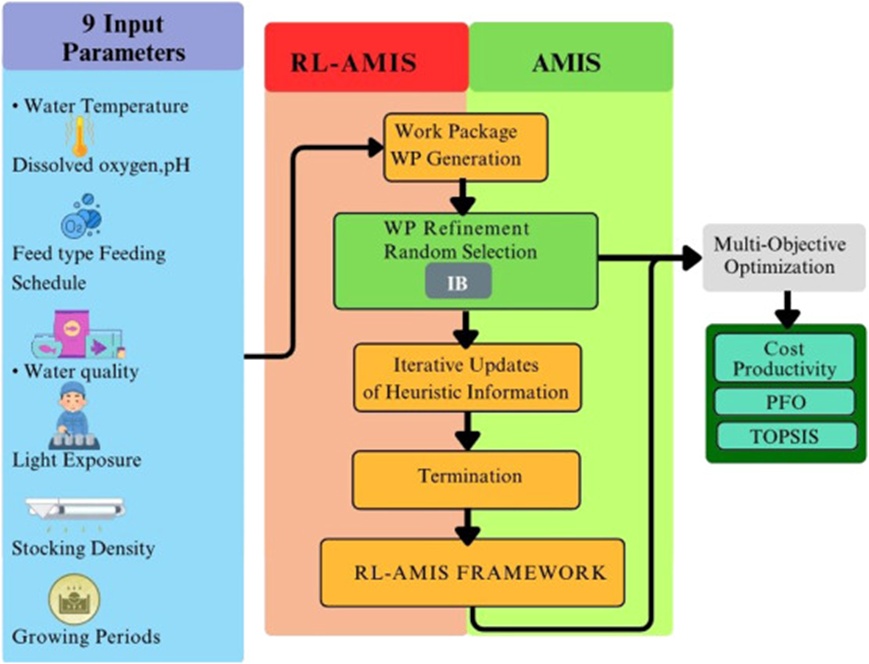
Figure 2. Comprehensive view of the RL-AMIS framework.
Figure 2 illustrates the adaptation of the AMIS framework to tackle the multi-objective decision-making problem. Reinforcement learning (RL) was embedded to steer method selection. A purpose-built variable is pivotal in determining which solutions move forward within the iterative loop, elaborated below.
The opening phase revolves around producing a batch of work packages (WPs). These are formulated via real-number encoding confined to the 0-to-1 spectrum. Each WP stands as one member of the AMIS population, carrying "D" dimensions. For this experiment, the dimensions align with ten beta coefficients (spanning [specify a range, e.g., 0.1 to 0.9]; β0 to β10). An example 10-dimensional WP might read: {0.81, 0.03, 0.41, 0.60, 0.09, 0.98, 0.49, 0.88, 0.38}. We label this quantity Xijt, marking the value of WP 'i' at slot 'j' during moment 't'. These numeric codes get translated to reveal the matching aquaculture inputs—such as water temperature, pH level, and feeding frequency—according to the bounded interval assigned to each factor. This translation step empowers the RL-AMIS framework to probe a broad array of environmental setups and shepherd the optimization of fish-rearing conditions.
The procedure for converting the coded figure within ‘WP’ is termed the decoding method. Under this approach, values occupying each WP position are processed by mapping the number from the lowest allowable bound to the highest, as dictated by the parameter range definitions provided in Table 1.
Within our construct, let Yijt denote the magnitudes of pivotal factors encompassing Climbing Perch Species (CPS), Water Temperature (WT), Dissolved Oxygen Levels (DOL), pH Levels (pH), Feeding Schedule (FS), Water Quality Parameters (WQP), Light Exposure (LE), Stocking Density (SD), and Growing Periods (GP). In this notation, Yijt captures the quantity tied to factor ‘j’ within Work Package ‘i’ at iteration ‘t’. For continuous variables, Yijt is derived through Eq. 11, laid out later. The allowable bounds for factor ‘j’ stretch from S_j^min to S_j^max, representing the floor and ceiling, respectively, as cataloged in Table 6.
 (11)
(11)
When handling categorical variables, identification follows Eq. 12, where "Mj" stands for the overall category count for factor ‘j’. The likelihood of landing on a given category ‘m’ is expressed as pjm, with ‘m’ serving as the category index. The cumulative probability associated with category ‘m’, written as ‘Cjm’, is obtained via Eq. 13. For any work package ‘i’, the normalized quantity Xijt drives the category assignment for factor ‘j’: if Xijt∈[Cj(m−1), Cjm), level ‘m’ gets assigned. Should a categorical variable feature three tiers, the midpoint value is captured by . The full set of categorical tiers and their corresponding magnitudes appears in Table 1.
 (12)
(12)
 (13)
(13)
The target outputs of the study—Fresh Weight (FW in Kg) and Operation Cost (OC)—are computed through Eqs. 14 and 15. We bring in ϑ1 and ϑ2 as the objective weights (FW and OC), subject to ϑ1+ ϑ2=1. Stochastic terms φ1 and φ2, each falling between zero and one, sway the computation. The markers 1 and 2 correspond to separate goals and are generalized by 'n'. Eqs. 14 and 15 serve to fix the values of ϑ1 and ϑ2 and to specify the objective mapping for a particular Work Package 'i' at iteration 't', shown as , is expressed as f(), with the peak function value pinned down by Eq. 15. Notably, φ1 and φ2 are freshly sampled for each 'i' and 't', while 'k' substitutes for 'n' within these derivations.
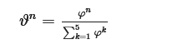 (14)
(14)
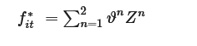 (15)
(15)
Here we address how the Adaptive Multi-Sensor Integration System (AMIS) backbone gets bolstered by weaving in reinforcement learning (RL), the Technique for Order Preference by Similarity to Ideal Solution (TOPSIS), and Pareto Front Optimization (PFO), culminating in RL-AMIS. Under the RL-AMIS umbrella, every work package (WP) operates as a standalone agent. A fixed count of WPs, labeled NP, assembles into an agent cohort (WP q, where 'q' runs from 1 to NP). The symbol 'B' signals the tally of intelligence boxes (IBs) housed inside the RL engine. Each RL round is called a stage, marked as Stage 't', mirroring the iteration counter 't'. Within this setup, WP selection out of the intelligence box (IB) pool is governed by a particular decision-making rule, formalized in Eq. 16 under the RL paradigm.
 (16)
(16)
The likelihood of picking Intelligence Box (IB) 'b' at iteration 't', written as Pbt, hinges on several decisive elements: the volume of Work Packages (WPs) that opted for IB 'b' in the immediately preceding iteration (Nbt−1), the mean objective value stemming from WPs that favored IB 'b' in that same prior round (Abt−1), plus a reward signal Ibt−1 computed via Eq. 17. IB selection adheres to the probability expression given in Eq. 11 and is carried out through roulette wheel sampling. The coefficients 'F1′ and 'F2′ take a fixed value of 1, whereas 'F3′ and 'F4′ are both locked at 2.
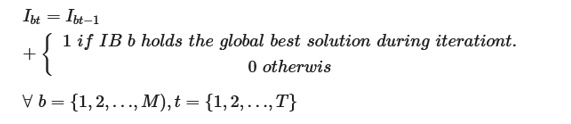 (17)
(17)
The term Gbt captures the aggregate reward accumulated from deploying IB 'b' during solution polishing, as dictated by the formula in Eq. 18. The discount factor 'γ' spans 0 to 1, with a chosen value of 0.2 for this experimental setup. Meanwhile, ωbqt, a binary flag, becomes 1 whenever WP 'q' elects to apply IB 'b' in the 't-th' iteration and stays 0 otherwise, per Eq. 19.
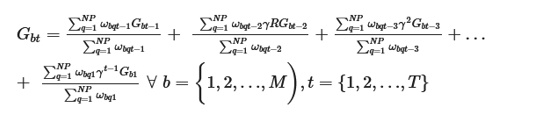 (18)
(18)
 (19)
(19)
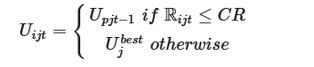
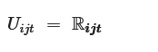
Our investigation employs a construct hosting ten "intelligence boxes," an idea borrowed from earlier work, captured concretely in Eqs. 20-27. This construct tracks the trajectory of Work Packages (WPs), identified by 'p', across successive iterations, tagged 'q'. Within this scheme, the entry of a WP at index 'l' during iteration 'q' is denoted Uijt. WPs are labeled via r1 and r2. From the pool of all solutions unearthed so far, marks the top-performing record. Randomness enters the picture as well: α acts as a stochastic variable bounded between 0 and 1, while Rijt denotes a specific random draw, likewise within 0 to 1, tied to WP 'p' at slot 'l'. The referenced Eqs. 20-27 merge operations drawn from multiple optimizers. They span the Cultural Algorithm (CA) via Eqs. 20 and 21, attributed to Kechid and Drias [47], the Water Cycle Algorithm (WCA) in Eq. 22 by Meng et al. [48], the Momentum Search Algorithm (MSA) covered by Eqs. 23 and 24 from Shekhawat et al. [49], the Equilibrium Optimizer (EO) in Eq. 25 by Korashy et al. [50], the Genetic Algorithm (GA) in Eq. 26 from Cauvery and Viswanatha [51], plus the Restart Algorithm in Eq. 27. A comparative evaluation of these algorithms will be presented in the experimental results segment.
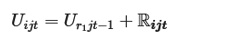 (20)
(20)
 (21)
(21)
 (22)
(22)
 (23)
(23)
 (24)
(24)
 (25)
(25)
 (26)
(26)
 (27)
(27)
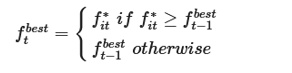
Under our scheme, Rijt stands for random numbers allocated to Work Package 'i' at slot 'j' during iteration 't'. The factor α belongs exclusively to the Momentum Search Algorithm (MSA) prescription, anchored at 0.2. The running iteration is labeled 't', 'T' reflects the upper iteration bound, and 'F' operates as the temporal scaling constant, held at 5. The crossover probability, CR, is set to 0.7. This design permits shifting improvement tactics from one iteration to the next, markedly raising the system's adaptive capacity and resilience. Through Eqs. 14 and 15, gets evaluated, enabling the identification of the top result extracted from the collection of values—pinned down exactly by Eq. 28. The strategy's accent on adaptability and resilience is meant to foster optimal selection of refinement operators at every stage.
 (28)
(28)
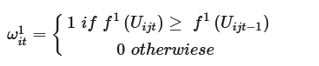
Once gets refreshed, shifts correspondingly, aligning itself with the Uijt entry that marks the best-found answer. The refresh protocol for Uijt depends on satisfying the criteria spelled out in Eqs. 29 to 32. To make this concrete, we introduce , a binary indicator set to one whenever objective 'i' registers a gain in the ongoing iteration 'q' versus its predecessor 'q-1′. In the absence of improvement, stays at zero. The aggregate then sums over all objectives 'n', yielding an overall improvement tally.
 (29)
(29)
 (30)
(30)
 (31)
(31)
 (32)
(32)
In our evaluation, capturing the Pareto front is essential for isolating and preserving the elite non-dominated solutions. This entails inspecting the objectives tied to Work Package r, formulated as f1(Ur) and f2(Ur). The universe of feasible solutions is denoted ℜ, with each solution u portrayed by a decision vector u=(u1,u2,…,ui). The accompanying objective vectors appear as fv(u) = (f1(u), f2(u), …, fV(u)). One solution u is said to dominate u' provided that, across every objective v spanning 1 to V, fv(u) ≤ fv(u’). The sequence, called AMIS, loops until reaching predefined halting criteria and successfully traces the Pareto front. On its heels, the TOPSIS technique—short for "technique for order preference by similarity to the ideal solution"—is deployed to single out the most suitable parameter combination.
At the core of the algorithmic design lies the periodic refresh of efficiency-critical parameters: , , , , and . This fine-tuning unfolds within each algorithmic cycle, advancing methodically through steps 1 to 4 until preset termination markers are hit. Earlier investigations indicated that the algorithm wraps up its operation after 3,000 cycles. This detail, emphasized in the RL-AMIS pseudocode, highlights the pivotal role of such calibration and iterative refinement in modern heuristic-based computational studies.
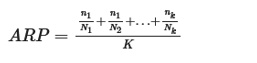
The Hypervolume (HV) indicator serves as a cornerstone for gauging the convergence and spread of solutions relative to the Pareto front, elaborated in Eq. 33. HV readings reveal how faithfully solutions align with the ideal reference and how uniformly they scatter. More precisely, HV(X) quantifies the volume encompassed by a solution set when juxtaposed with a reference objective , for any given point X. This quantification leans on the Lebesgue measure Λ(.) across objectives f1 through fn. Complementarily, the Average Ratio of Pareto Optimal Solution (ARP) furnishes a vital yardstick, expressed through Eq. 34. ARP captures the proportion of Pareto optimal points to the overall solution mass. An elevated ARP figure points to a tighter clustering of Pareto points, indicative of stronger algorithmic output. ARP draws on iteration runs N1, N2,…, Nk spanning Experiments 1 to k, with n1, n2, …, nk counting Pareto optimal discoveries per iteration and K representing the full experiment tally, thus supporting a thorough appraisal.
 (33)
(33)
 (34)
(34)
Our inquiry will pit RL-AMIS against a selection of prominent approaches. These include the baseline AMIS framework put forward by Pitakaso et al. [52], alongside other recognized techniques: the Cultural Algorithm (CA) detailed by Kechid and Drias [47], the Water Cycle Algorithm (WCA) introduced by Meng et al. [48], the Momentum Search Algorithm (MSA) from Shekhawat et al. [49], the Equilibrium Optimizer (EO) by Korashy et al. [50], and the Genetic Algorithm (GA) described by Cauvery and Viswanatha [51]. Further benchmarking will involve the top outputs from an approximation routine within Design Expert software, referred to as "Best Experimental Result" (BER) and "Best Solution Obtained from Design Expert Software" (BSDE). To level the playing field, every method receives an identical runtime allowance of 60 min.
The Artificial Multiple Intelligence System (AMIS) constitutes a metaheuristic engine that shepherds a population of candidate blueprints known as work packages (WPs). Every WP undergoes iterative enhancement via a single metaheuristic, termed an Intelligence Box (IB), drawn from a ready pool. The choice of IB is probability-weighted, combining factors like selection frequency, average fitness, immediate payoff, and cumulative reward, as encoded in Eq. 16.
In the RL-AMIS variant, an Intelligence Box (IB) collects a binary immediate reward Ibt Eq. 17 whenever it delivers the global best solution in a given round. This payoff feeds into a cumulative reward tally Gbt Eq. 18, calculated as a discounted accumulation of prior rewards governed by the decay parameter γ. The cumulative reward shapes subsequent IB preferences, empowering the RL agent to lean toward persistently successful tactics.
Table 7 offers a consolidated overview of the parameter settings applied across all optimization techniques examined in this work. Every algorithm operated under uniform conditions—population size fixed at 50 and execution capped at 60 min—assuring an equitable comparison. For RL-AMIS and AMIS, an identical suite of Intelligence Boxes (IBs)—encompassing several variants of Cultural Algorithm (CA), Momentum Search Algorithm (MSA), Water Cycle Algorithm (WCA), Equilibrium Optimizer (EO), Genetic Algorithm (GA), and Restart—was employed. The table spells out decisive control parameters per algorithm, covering learning rates, mutation and crossover probabilities, selection mechanisms, and bespoke hyperparameters unique to each metaheuristic. This harmonized parametrization underpins a transparent and reproducible benchmarking context for climbing perch aquaculture optimization.
Table 7. Algorithmic parameters for each algorithm.
Algorithm | Parameter | Value/Description |
All-Algorithms | Execution time | 60 min |
Population size | 50 | |
RL-AMIS | Selection technique | Reinforcement learning–guided Roulette Wheel approach |
Learning rate (α) | 0.01 | |
Discount factor (γ) | 0.2 | |
Exploration rate (ε) | 0.1 | |
Intelligence boxes (IBs) | CA1-CA2, WCA, MSA-1, MSA-2, EO, GA, Restart | |
AMIS | Selection technique | Roulette Wheel selection integrated with performance indicators |
Intelligence boxes (IBs) | CA1-CA2, WCA, MSA-1, MSA-2, EO, GA, Restart | |
MSA | Optimization strategy | Search mechanism based on momentum principles |
Weight factor (α) | 0.2 | |
Random factor | [0,1] | |
WCA | Optimization strategy | Flow-oriented optimization approach |
Number of rivers | 2–5 | |
Rain rate (RR) | Probability within [0.01 – 0.1] | |
EO | Optimization strategy | Dynamic search process based on equilibrium concepts |
Time scaling factor (F) | 5 | |
Randomization factor (λ) | ∈ [0.5, 1.0] | |
Equilibrium pool size | 4 | |
GA | Crossover rate | 0.7 |
Mutation rate | 0.05 | |
Selection technique | Elitism/preservation of the best solutions | |
CA | Influence function | Modifies mutation and crossover intervals |
Acceptance function | Top 30% of solutions selected according to fitness value Z* | |
Mutation rate | 0.7 | |
Crossover rate | 0.05 |
RL-AMIS represents a hybrid optimization engine purpose-built for multi-objective decision-making within intricate environments. It operates by adaptively picking from a repertoire of metaheuristics labeled Intelligence Boxes (IB) via reinforcement learning logic. These IBs iteratively hone candidate designs, called Work Packages (WP), to map the trade-off landscape between productivity metrics (e.g., fish growth) and cost-efficiency. Candidate fitness is judged through Pareto Front Optimization and TOPSIS ordering procedures. The overarching structure of this optimization routine is encapsulated in Algorithm 1.
Algorithm 1: RL-AMIS: Reinforcement learning-Adaptive metaheuristic-based improvement system input.
T: Maximum number of iterations for the main algorithm loop |
NP: Number of Work Packages (i.e., solutions in the population) |
IB [1...B]: Intelligence Boxes of operators (e.g., {CA, WCA, MSA, EO, GA, Restart, ...}) |
Objectives: Fresh Weight (maximize) and Operating Cost (minimize) |
γ (gamma) ← 0.2: Discount factor for Reinforcement Learning reward calculation (Eq. 18) |
CR ← 0.7: Crossover Rate for Genetic Algorithm (GA) operator (Eq. 26) |
α (alpha) ← 0.2: Weight factor for Magnetic Spring Algorithm (MSA) operator (Eq. 23) |
F ← 5: Time scaling factor for Equilibrium Optimizer (EO) operator (Eq. 25) |
Begin: |
// — STAGE 1: Initial WP Generation — (Eqs. 11–15) |
for i = 1 to NP: // Initialize & Evaluate each Work Package (WP_i) |
X_i ← GenerateRandomNormalizedParams(D); Y_i ← DecodeParams (X_i, ParamRanges, Eqs. 11-13 |
FW_i, OC_i ← EvaluateObjectives (Y_i, f1, f2) // Evaluate objectives |
Z_it* ← CalculateFitness (FW_i, OC_i, ϖ1, ϖ2, Eqs. 14-15) // Compute fitness |
end for |
// — STAGE 2: Main Iteration Loop — |
for t = 1 to T: // For each iteration |
for each WP_i in Population: // For each Work Package |
// — STAGE 2.1: Select IB via RL Policy — (Eqs. 16-17) |
// Calculate selection probabilities P_bt for each IB based on historical performance (Eq. 16) |
P_bt_all_IBs ← CalculateAllSelectionProbs (PerformanceMetrics_all_IBs(t-1)) |
IB_selected ← RouletteWheelSelection (IntelligenceBoxes, P_bt_all_IBs) // Select IB |
// — STAGE 2.2: Improve WP_i using selected IB — (Eqs. 20-27) |
X_new_ijt = X_ijt // Initialize candidate |
switch IB_selected: // (Eqs. 20-27) |
case CA: X_new_ijt ← U_r1_jt−1 + R_ijt |
case WCA: X_new_ijt ← U_ijt−1 + R_ijt × U_r1_jt−1 |
… |
case Restart: X_new_ijt ← Random (0, 1) |
end switch |
// Decode X_new_ijt to Y_new_ijt, then evaluate FW_new, OC_new, and fitness Z_new_it* (Eqs. 11-15) |
Y_new_ijt ← Decode(X_new_ijt) |
FW_new, OC_new, Z_new_it* ← Evaluate(Y_new_ijt) |
// — STAGE 2.3: Evaluate and Update Best & Current WP — (Eqs. 28-32) |
if Z_new_it* ≥ Z_best(t−1): Z_best(t) ← Z_new_it*; U_best ← X_new_i // Update global best |
else: Z_best(t) ← Z_best(t-1) |
end if |
// Check objective-wise improvement for accepting X_new_ijt for current WP_i |
ω_it_1 ← (FW_new ≥ FW_i_current) ? 1 : 0 // FW improved/same (Eq. 29) |
ω_it_2 ← (OC_new ≤ OC_i_current) ? 1 : 0 // OC improved/same (Eq. 30) |
if (ω_it_1 + ω_it_2) ≥ 1: X_i ← X_new_i // Accept new solution (Eqs. 31-32) |
// Update current objective values for WP_i |
// else: Revert (X_i remains unchanged) |
end if |
end for // End WP_i loop |
// — STAGE 2.4: Update RL Policy Rewards — (Eqs. 18-19) |
for b = 1 to B: // For each IB |
ImmediateReward_b ← CalculateImmediateReward (IB_b, PopulationChanges_this_iteration) |
G_bt[b] ← Update_RL_Value(G_b(t-1), ImmediateReward_b, γ) // Update cumulative reward (Eq. 18) |
UpdatePerformanceMetrics (IB_b, ImmediateReward_b, ImprovementValue) // Update Nb, Ab, Ib (Eq. 17 for Ib) |
end for |
end for // End main iteration loop |
// — STAGE 3: Multi-objective Decision Making — |
ParetoFrontSet ← FindNonDominatedSet (FinalPopulation) // Or all found non-dominated |
BestSolution ← SelectByTOPSIS (ParetoFrontSet, ObjectivesWeights) |
return ParetoFrontSet, BestSolution |
End |
The coded implementation of our technique, along with the entire suite of comparator algorithms, was processed on a desktop machine fitted with an Intel Core i3 CPU operating at 3.70 GHz and 8 GB of DDR4 system memory, with the source code compiled under Dev C++. The numerical evidence assembled in this section is curated to foreground the specific advances attributable to our investigation. The experimental protocol unfolds in a choreographed sequence: first, a batch of trials structured per the Taguchi design methodology is executed and interpreted via the Design Expert analytical suite. Following that, regression-based predictive functions are constructed to represent each candidate approach. These surrogate models are then subjected to iterative improvement cycles and placed under a comparative lens against alternative techniques. The disclosure of experimental evidence will proceed in a structured, stepwise fashion to guarantee both analytical precision and a holistic grasp of the study's broader significance.
The focus of this portion of the analysis is a deep dive into the dataset generated from the Taguchi experimental matrix, with a sharp emphasis on the causal linkages between a constellation of climbing perch rearing variables and their dual-pronged effect on the key performance measures: Fresh Weight (kg) and Operating Cost (Baht). The consolidated information housed in Tables 8 and 9 lays out a meticulous accounting of the manner in which heterogeneous cultivation regimes shape these outcome variables, furnishing an essential platform for driving forward the efficiency frontier in climbing perch aquaculture.
Table 8. Optimization of aquaculture parameters using Taguchi experimental design.
T | CPS | WQNa | LE | SD | GP | Fresh Weight | Operating Cost | WT | DOL | pH | FS | WQA | WQNi |
1 | Testudineus | 10 | 6 | 0.5 | 5 | 52.27 | 2590.45 | 24 | 3 | 6 | 2 | 0.01 | 0.25 |
2 | Testudineus | 20 | 9 | 1 | 7 | 53.09 | 3285.43 | 24 | 3 | 6 | 3 | 0.10 | 0.50 |
3 | Testudineus | 40 | 12 | 1.5 | 9 | 47.04 | 4038.18 | 24 | 3 | 6 | 4 | 0.20 | 1.00 |
4 | Testudineus | 20 | 9 | 1 | 9 | 48.15 | 3397.19 | 27 | 5 | 7 | 2 | 0.01 | 0.25 |
5 | Testudineus | 40 | 12 | 1.5 | 5 | 39.34 | 3420.85 | 27 | 5 | 7 | 3 | 0.10 | 0.50 |
6 | Testudineus | 10 | 6 | 0.5 | 7 | 61.66 | 2965.37 | 27 | 5 | 7 | 4 | 0.20 | 1.00 |
7 | Testudineus | 40 | 12 | 1.5 | 7 | 34.40 | 3532.61 | 30 | 7 | 8 | 2 | 0.01 | 0.25 |
8 | Testudineus | 10 | 6 | 0.5 | 9 | 54.60 | 3016.04 | 30 | 7 | 8 | 3 | 0.10 | 0.50 |
9 | Testudineus | 20 | 9 | 1 | 5 | 56.90 | 3104.12 | 30 | 7 | 8 | 4 | 0.20 | 1.00 |
10 | Oligolepis | 10 | 9 | 1.5 | 5 | 59.81 | 3046.14 | 24 | 5 | 8 | 2 | 0.10 | 1.00 |
11 | Oligolepis | 20 | 12 | 0.5 | 7 | 49.74 | 3257.12 | 24 | 5 | 8 | 3 | 0.20 | 0.25 |
12 | Oligolepis | 40 | 6 | 1 | 9 | 24.59 | 3036.05 | 24 | 5 | 8 | 4 | 0.01 | 0.50 |
13 | Oligolepis | 20 | 12 | 0.5 | 9 | 67.78 | 4082.10 | 27 | 7 | 6 | 2 | 0.10 | 1.00 |
14 | Oligolepis | 40 | 6 | 1 | 5 | 37.58 | 2844.64 | 27 | 7 | 6 | 3 | 0.20 | 0.25 |
15 | Oligolepis | 10 | 9 | 1.5 | 7 | 70.92 | 3641.22 | 27 | 7 | 6 | 4 | 0.01 | 0.50 |
16 | Oligolepis | 40 | 6 | 1 | 7 | 28.49 | 2885.08 | 30 | 3 | 7 | 2 | 0.10 | 1.00 |
17 | Oligolepis | 10 | 9 | 1.5 | 9 | 57.42 | 3333.27 | 30 | 3 | 7 | 3 | 0.20 | 0.25 |
18 | Oligolepis | 20 | 12 | 0.5 | 5 | 51.12 | 3224.64 | 30 | 3 | 7 | 4 | 0.01 | 0.50 |
19 | Senegal | 10 | 12 | 1 | 5 | 69.60 | 3406.68 | 24 | 7 | 7 | 2 | 0.20 | 0.50 |
20 | Senegal | 20 | 6 | 1.5 | 7 | 55.43 | 3253.18 | 24 | 7 | 7 | 3 | 0.01 | 1.00 |
21 | Senegal | 40 | 9 | 0.5 | 9 | 36.25 | 3463.99 | 24 | 7 | 7 | 4 | 0.10 | 0.25 |
22 | Senegal | 20 | 6 | 1.5 | 9 | 39.94 | 2880.99 | 27 | 3 | 8 | 2 | 0.20 | 0.50 |
23 | Senegal | 40 | 9 | 0.5 | 5 | 26.64 | 2833.27 | 27 | 3 | 8 | 3 | 0.01 | 1.00 |
24 | Senegal | 10 | 12 | 1 | 7 | 55.45 | 3284.61 | 27 | 3 | 8 | 4 | 0.10 | 0.25 |
25 | Senegal | 40 | 9 | 0.5 | 7 | 38.27 | 3245.62 | 30 | 5 | 6 | 2 | 0.20 | 0.50 |
26 | Senegal | 10 | 12 | 1 | 9 | 73.61 | 4106.44 | 30 | 5 | 6 | 3 | 0.01 | 1.00 |
27 | Senegal | 20 | 6 | 1.5 | 5 | 52.27 | 2875.46 | 30 | 5 | 6 | 4 | 0.10 | 0.25 |
Table 9. Hypothetical coefficients for predicting the fresh weight of aquaculture species.
Coefficient | Cost coefficient | Fresh weight (kg) coefficient |
β₀ (Intercept) | 52.460 | 71.287 |
β₁ (Species) | −0.083 | −0.148 |
β₂ (Water Temperature) | −0.027 | −0.014 |
β₃ (Dissolved Oxygen Levels) | 1.493 | 2.000 |
β₄ (pH Levels) | −4.082 | −5.042 |
β₅ (Feed Schedule) | 0.851 | 0.972 |
β₆ (Water Quality Ammonia) | −8.520 | 12.292 |
β₇ (Water Quality Nitrites) | 6.945 | 7.976 |
β₈ (Water Quality Nitrates) | −0.009 | −0.899 |
β₉ (Light Exposure) | 3.006 | 1.505 |
β₁₀ (Stocking Density) | 4.034 | 2.028 |
β₁₁ (Growing Periods) | 3.009 | 0.107 |
Note: T = Treatment, CPS = Climbing Perch Species, WT = Water Temperature, DSL = Dissolved Oxygen Levels, FS = Feeding Schedule, WQA = Water Quality-Ammonia, WQNi = Water Quality-Nitrites, WQNa = Water Quality-Nitrates, LE = Light Exposure, SD = Stocking Density, GP = Growing Periods, FW = Fresh Weight, OC = Operating Cost.
A central aim of this inquiry is the methodical enhancement of aquaculture protocols to simultaneously push the ceiling on harvestable biomass and depress operational spending. Through the lens of Table 8, a set of distinct aquaculture treatment regimes is displayed side-by-side with the biological yields and monetary costs each produced, thereby creating the primary evidentiary foundation for the subsequent analytical steps.
To complement this, Table 9 enumerates the derived coefficient estimates (from β0 up to β11) that compose the regression functions designed to forecast both Fresh Weight and Operating Cost as linear combinations of the rearing variables under study. Each coefficient captures the statistically expected marginal increment or decrement in the response metrics that accompanies a unitary shift in a specific cultivation factor. Together, these coefficients assemble a valid inferential architecture for tuning grow-out parameters toward elevated productivity and sharper cost-efficiency.
The core revelations pulled from our fine-grained investigation of culture conditions across all 27 experimental treatments are condensed into Tables 10 and 11. Table 10 serves as a wide-angle snapshot of the monitored environmental and husbandry parameters’ variability and their consequential footprint on terminal fish biomass, specifically by contrasting the highest and lowest values observed within the dataset. Table 11 shifts the analytical lens to economic performance, mapping the variance in operating expenditure that accompanied these same parametric conditions by presenting the cost extremes attained. The value of these two tables, when considered in tandem, is that they crystallize a practical understanding of how to jointly steer biological productivity and financial control in aquaculture, effectively offering a roadmap for superior operational strategies.
Table 10. Range of aquaculture parameters and fresh weight outcomes.
Empty cell | Climbing | Water | Light | Stocking | Growing | Value of | Water temperature | Dissolved oxygen levels | pH | Feed | Water | Water |
Min | Anabas oligolepis | 40 | 6 | 1 | 9 | 24.59 | 24 | 5 | 8 | 4 | 0.01 | 0.50 |
Max | Anabas senegalensis | 10 | 12 | 1 | 9 | 73.61 | 30 | 5 | 6 | 3 | 0.01 | 1.00 |
Table 11. Range of aquaculture parameters and associated costs.
Empty cell | Climbing | Water | Light | Stocking | Growing | Cost | Water temperature | Dissolved oxygen levels | pH | Feed | Water | Water |
Min | Anabas testudineus | 10 | 6 | 0.5 | 5 | 2590.45 | 24 | 3 | 6 | 2 | 0.01 | 0.25 |
Max | Anabas senegalensis | 10 | 12 | 1 | 9 | 4106.44 | 30 | 5 | 6 | 3 | 0.01 | 1.00 |
The evidence collated within Table 10 (which encompasses data clusters for both biological yield and financial cost) alongside Table 11 portrays the operational bandwidth of the experiment and its dual consequences for biomass and expenditure. A key insight from Table 10 is that the apex of growth performance is not uniform but contingent on the specific interplay between biological identity and a cluster of environmental drivers, with fresh weight culminating under a distinct, optimized environmental recipe. The data undeniably point to the strength of factors like water heat content, oxygen tension, and feed delivery patterns as determinants of fish growth trajectories. From the economic angle, Table 11 reveals how these very same rearing regimes map onto operational balance sheets. It strongly implies that parameter configurations brought close to their optima can decompress cost structures, whereas any drift away from these optimal states introduces upward pressure on production expenses. In synthesis, these tables forcefully assert that meticulous governance of rearing conditions is a critical lever not only for safeguarding fish vitality and growth but equally for anchoring the economic durability of the enterprise.
Our research endeavors to hone the craft of climbing perch cultivation by rigorously mapping the connection between variable growth environments and the consequent production results. Occupying a pivotal role in this effort, Table 12 furnishes a diagnostic cross-comparison of how disparate optimization engines fare when deployed to amplify performance indicators. The evaluative machinery we rely on consists of two primary diagnostic metrics: the Hyper Volume (HV) and the Average Pareto Points (ARP). By employing these measures, the relative effectiveness of every strategy is quantitatively isolated, with all computations bounded within a standard processing window of one hour.
Table 12. Comparative analysis of optimization methods for climbing perch aquaculture: Performance metrics and references.
Methods | RL-AMIS | AMIS | GA | EO | MSA | WCA | CA |
References | Proposed model | ||||||
HV | 0.63 | 0.61 | 0.59 | 0.59 | 0.56 | 0.59 | 0.57 |
ARP | 1.73 | 1.65 | 1.63 | 1.62 | 1.66 | 1.64 | 1.60 |
Non-dominated solutions | 38 | 35 | 32 | 32 | 34 | 33 | 31 |
Dominated solutions | 62 | 65 | 68 | 68 | 66 | 67 | 69 |
The benchmarking trial of optimization routines for Climbing Perch aquaculture, as systematically arrayed in Table 12, was consistently bounded by a 60-minute computational execution limit. The efficiency of each algorithmic candidate was triangulated through three metrics: the Hypervolume (HV) indicator, the Average Ratio of Pareto-optimal Solutions (ARP) statistic, and a direct numeration of the split between non-dominated and dominated solutions in the final population. This trifecta of measures jointly yields a rounded perspective into each method’s adeptness at generating a broad and elite set of trade-off configurations for the paired objectives: pushing up fresh weight and pulling down operational expense.
A scan across the performance results reveals the presented RL-AMIS formulation as the unambiguous frontrunner, having secured the superior values across all indicators: an HV of 0.63, an ARP reading of 1.73, and the largest contingent of non-dominated solution vectors (38 from a pool of 100). The AMIS variant trailed in a strong second place, delivering an HV of 0.61, an ARP of 1.65, and 35 non-dominated individuals, while the MSA search logic also turned in strongly competitive figures. A second tier of effectiveness, populated by GA, EO, WCA, and CA, produced HV readings circumscribed between 0.56 and 0.59, with non-dominated solution counts falling in the narrow band of 31 to 33. The deliberate side-by-side disclosure of dominated and non-dominated tallies deepens the clarity of these results, spotlighting the pronounced edge RL-AMIS holds in negotiating multifaceted compromise surfaces and enabling economically intelligent, autonomous decision pipelines within precision aquaculture systems.
A gallery of two-dimensional Pareto Fronts constructed by the competing solvers—specifically the Cultural Algorithm (CA), Water Cycle Algorithm (WCA), Memetic Algorithm (MSA), Equilibrium Optimizer (EO), Genetic Algorithm (GA), Adaptive Memory-inspired Strategy (AMIS), and Reinforcement Learning-Adaptive Memory-inspired Strategy (RL-AMIS)—is presented in the sequence of plots (Figures 3a-3g). These graphic outputs depict the consolidated archive of Pareto-optimal coordinates detected by each method upon the expiry of its allotted 60-minute time slice.
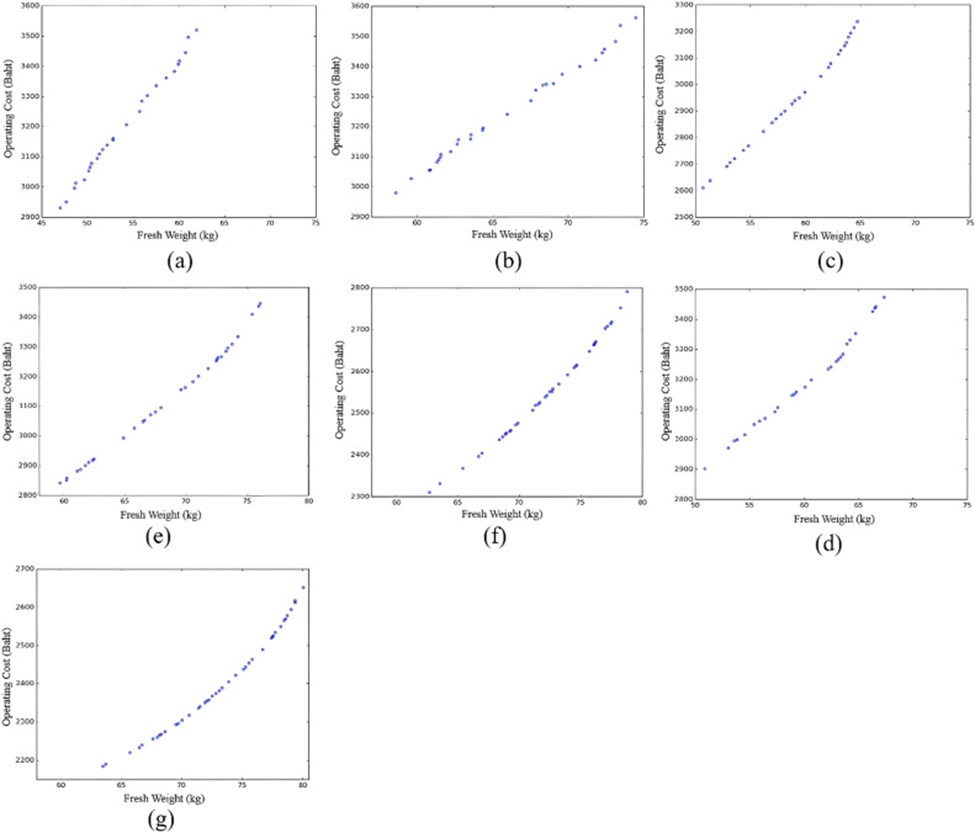
Figure 3. 2D-Pareto front of different optimization methods.
In the domain of multi-objective optimization, the Pareto Front is correctly understood as a boundary composed of solution vectors that exhibit mutual non-dominance, meaning the improvement of one criterion compulsorily entails the erosion of another. This theoretical construct is vital for unpacking the significance of the algorithmically derived solution sets. Conducting a visual scan across the various Fronts provides a direct, geometric sensing of the intrinsic compromises that exist between opposing goals—for example, the tension between elevating biomass production and restraining resource utilization in Climbing Perch cultivation. Every discrete coordinate residing on a given Pareto Front corresponds to a potentially efficient operational recipe, none of which can claim absolute superiority across the entire spectrum of evaluative criteria. This property transforms the Pareto Front into a powerful interactive decision-support interface, allowing researchers and farm operators to cherry-pick an optimization trajectory that is most congruent with their specific objective hierarchies and binding practical constraints.
This division of the analysis lays out a formalized evaluative pipeline for the optimization of finfish husbandry, specifically tailored to climbing perch, and operationalized by means of the Technique for Order Preference by Similarity to Ideal Solution (TOPSIS). The analytical pivot of this discussion is the utilization of TOPSIS to adjudicate among and select the top-tier operational strategies derivable from the pool of Pareto solutions identified by the various methods detailed earlier. The evaluation logic involves a conscious and systematic re-weighting of the significance attached to two fundamental objectives: Fresh weight (Kg) and Operation Cost (Baht), the twin axes around which the feasibility of climbing perch farming revolves.
The three tables—Tables 13-15—function as the principal analytical instruments within this comparative framework, illustrating how a deliberate tilt in priority between the two central goals—yield maximization and fiscal prudence—can reconfigure the optimization outcome. Within these tables, the TOPSIS calculus is applied under three separate weighting philosophies: a balanced philosophy with symmetrical trade-off importance (0.5/0.5), a biomass-centric philosophy that heavily biases selection toward maximum output (0.9 for fresh weight), and a thrift-centric philosophy that encodes a sharp preference for cost reduction (0.9 for cost). This deliberate selection of weighting profiles was tactical, conceived to replicate the diverse preference structures commonly encountered in real-world aquaculture decision-making, where managerial focus can swing from pursuing aggressive growth to mandating fiscal tightening to striking an operational compromise situated between the two poles [54, 55].
Table 13. Balanced weighting approach (Fresh weight 0.5, Cost 0.5).
Value/Method | RL-AMIS | AMIS | GA | EO | MSA | WCA | CA |
Fresh weight (kg) | 71.44 | 68.78 | 63.74 | 57.43 | 54.95 | 62.79 | 55.37 |
Operating cost (Baht) | 2635.41 | 2710.70 | 3103.46 | 3364.34 | 3177.53 | 3461.33 | 3522.91 |
Climbing perch species | A. | A. | A. | A. | A. | A. | A. |
Water temperature (°C) | 24 | 24 | 24 | 30 | 27 | 27 | 27 |
Dissolved oxygen levels | 3 | 5 | 7 | 7 | 3 | 7 | 5 |
pH levels | 6 | 8 | 7 | 8 | 8 | 6 | 7 |
Feed schedule (times/day) | 2 | 2 | 3 | 3 | 2 | 2 | 2 |
Water quality ammonia (mg/L) | 0.1 | 0.1 | 0.01 | 0.1 | 0.2 | 0.1 | 0.01 |
Water quality nitrites (mg/L) | 0.25 | 1 | 1 | 0.5 | 0.5 | 1 | 0.25 |
Water quality nitrates (mg/L) | 10 | 10 | 20 | 10 | 20 | 20 | 20 |
Light exposure (hours/day) | 6 | 9 | 6 | 6 | 6 | 12 | 9 |
Stocking density (fish/L) | 0.5 | 1.5 | 1.5 | 0.5 | 1.5 | 0.5 | 1 |
Growing periods (months) | 5 | 5 | 7 | 9 | 9 | 9 | 9 |
Table 14. Fresh weight emphasis (Fresh weight 0.1, Cost 0.9).
Value/Method | RL-AMIS | AMIS | GA | EO | MSA | WCA | CA |
Fresh weight (kg) | 68.16 | 67.63 | 63.00 | 57.04 | 51.68 | 60.29 | 51.92 |
Operating cost (Baht) | 2454.41 | 2584.73 | 2954.33 | 3101.36 | 2732.80 | 3142.24 | 3243.77 |
Climbing perch species | A. | A. | A. | A. | A. | A. | A. |
Water temperature (°C) | 24 | 24 | 24 | 30 | 27 | 27 | 27 |
Dissolved oxygen levels | 3 | 5 | 7 | 7 | 3 | 7 | 5 |
pH levels | 6 | 8 | 7 | 8 | 8 | 6 | 7 |
Feed schedule (times/day) | 2 | 2 | 3 | 3 | 2 | 2 | 2 |
Water quality ammonia (mg/L) | 0.1 | 0.1 | 0.01 | 0.1 | 0.2 | 0.1 | 0.01 |
Water quality nitrites (mg/L) | 0.25 | 1 | 1 | 0.5 | 0.5 | 1 | 0.25 |
Water quality nitrates (mg/L) | 10 | 10 | 20 | 10 | 20 | 20 | 20 |
Light exposure (hours/day) | 6 | 9 | 6 | 6 | 6 | 12 | 9 |
Stocking density (fish/L) | 0.5 | 1.5 | 1.5 | 0.5 | 1.5 | 0.5 | 1 |
Growing periods (months) | 5 | 5 | 7 | 9 | 9 | 9 | 9 |
Table 15. Cost efficiency emphasis (Fresh weight 0.9, Cost 0.1).
Value/Method | RL-AMIS | AMIS | GA | EO | MSA | WCA | CA |
Fresh weight (kg) | 75.96 | 72.97 | 70.54 | 64.32 | 59.93 | 67.72 | 58.98 |
Operating Cost (Baht) | 2718.44 | 3888.23 | 3147.83 | 3404.86 | 3146.30 | 3665.74 | 3604.47 |
Climbing perch species | A. | A. | A. | A. | A. | A. | A. |
Water temperature (°C) | 24 | 24 | 24 | 30 | 27 | 27 | 27 |
Dissolved oxygen levels | 3 | 5 | 7 | 7 | 3 | 7 | 5 |
pH levels | 6 | 8 | 7 | 8 | 8 | 6 | 7 |
Feed schedule (times/day) | 2 | 2 | 3 | 3 | 2 | 2 | 2 |
Water quality ammonia (mg/L) | 0.1 | 0.1 | 0.01 | 0.1 | 0.2 | 0.1 | 0.01 |
Water quality nitrites (mg/L) | 0.25 | 1 | 1 | 0.5 | 0.5 | 1 | 0.25 |
Water quality nitrates (mg/L) | 10 | 10 | 20 | 10 | 20 | 20 | 20 |
Light exposure (hours/day) | 6 | 9 | 6 | 6 | 6 | 12 | 9 |
Stocking density (fish/L) | 0.5 | 1.5 | 1.5 | 0.5 | 1.5 | 0.5 | 1 |
Growing periods (months) | 5 | 5 | 7 | 9 | 9 | 9 | 9 |
Far from being the product of chance selection, the weighting coefficients were deliberately engineered to reflect the genuine preference structures exhibited by practitioners operating within multi-criteria decision frameworks. As a case in point, real-world aquaculture is characterized by a spectrum of strategic postures: certain producers, compelled by market contracts and demand fulfillment, orient their entire operation toward maximizing volumetric output, whereas others, constrained by thin capitalization or volatile input costs, organize their systems around rigorous expenditure control. Anchoring the investigation in this breadth of practical operational philosophies substantially deepens the external validity and transferability of the conclusions to heterogeneous production landscapes [56, 57].
Assessing the optimized outputs through several contrasting evaluative lenses allows the current body of work to lay bare the intrinsic versatility of the algorithmic portfolio—and especially of the newly formulated RL-AMIS—in accommodating opposed management objectives. This analytical orientation does not simply advertise the framework's adaptability; rather, it crystallizes into a concrete decision-support apparatus for aquaculture planning. The approach facilitates a precise bridging of high-level strategic ambitions and granular operational levers, thereby illuminating the contour of the trade-off frontier with greater clarity and cementing the model's legitimacy as a dependable, decision-focused analytical engine [58].
Under a weighting scheme of perfect symmetry, RL-AMIS distinguishes itself as the unequivocally dominant method, simultaneously notching the highest recorded biomass figure (71.44 kg) and the most compressed cost structure (2635.41 Baht). This dual achievement points toward a marked proficiency in harmonized, dual-criterion optimization. Occupying the rank directly below is AMIS, whose record, though formidable on its own terms, entails fractional sacrifices on both the growth and fiscal axes. The balance of the methods—CA, WCA, MSA, EO, and GA—yields competitive but measurably blunted efficiency metrics, a pattern that compellingly demonstrates the indispensability of deploying advanced optimization architectures when the end goal is a genuinely balanced, rather than a skewed, performance profile.
When the priority gradient is deliberately slanted to emphasize biomass accumulation above all else, the RL-AMIS solver once again commands the top position, delivering a robust fresh weight reading of 68.16 kg, accompanied by a moderate, logically anticipated uptick in associated outlay (to 2454.41 Baht). This result encapsulates RL-AMIS's adaptive capacity to aggressively pivot its search dynamic toward a growth-centric mandate without wholly abandoning fiscal responsibility. AMIS reaffirms its entrenched status as the runner-up under these priority conditions as well. Reading across this scenario reveals a consistent structural tendency: concentrating optimization pressure singularly on fresh weight inevitably induces a gentle inflationary drift in operational cost; however, the elite solvers—RL-AMIS and AMIS—prove demonstrably more adept at suppressing this inflationary side-effect than the simpler algorithmic alternatives.
When the evaluative emphasis is reversed to fervently prioritize economic austerity, RL-AMIS again substantiates its thrift credentials by attaining the leanest operational cost footprint (2718.44 Baht) within the compared set, while paradoxically preserving a fully respectable fresh weight harvest of 75.96 kg. This particular finding forcefully illustrates the method's unusual twin competency: compressing cost structures dramatically while averting a parallel degradation in biological output. The AMIS algorithm traces a trajectory consistent with earlier scenarios, exhibiting laudable performance yet shadowing the RL-AMIS benchmark by a narrow, stable margin.
A holistic synthesis of the evidence marshaled across the entirety of these comparative tables reveals that RL-AMIS unequivocally asserts itself as the most efficacious and broadly capable optimization engine for climbing perch aquaculture, delivering premier results irrespective of the directional pressure exerted by the optimization objective. AMIS solidifies its positioning as the preeminent second-echelon solution, reliably outflanking the remainder of the methodological field, although never fully closing the narrow performance chasm that separates it from RL-AMIS. The residual methods, each functional to differing degrees, consistently manifest sharper and more costly compromises between harvestable biomass and economic outlay, an empirical regularity that further illuminates the refined trade-off navigation skills hard-coded into RL-AMIS and AMIS.
The substantive narrative woven from these analyses underscores the subtle, textured judgment called for in the practice of aquaculture optimization. Strategic adjustments—even seemingly small recalibrations of objective weight—can route the system toward fundamentally distinct, yet equally context-justifiable, operational states. RL-AMIS, with its benchmark-level uniformity across this eclectic array of decisional contexts, consequently presents itself as an exceptionally versatile and potent instrument for stakeholders striving to reconcile the dual imperatives of productive abundance and fiscal discipline within climbing perch farming systems.
The experimental segment chronicled here probes the tangible, on-farm manifestation of theoretically optimized input combinations for climbing perch production, pursuing the explicit program of stress-testing computational projections against verifiable biological and economic outcomes. Assigning symmetrical importance to the paired objectives of terminal biomass and cumulative production cost, a sequence of seven independent, uninterrupted grow-out trials was conducted, all governed by an identical suite of optimized environmental and operational factor settings inherited from the antecedent modeling phase. The overriding aim was to quantify the prognostic accuracy of the theoretical benchmarks once they are instantiated within a functioning production system, and to explore the degree to which the anticipated yields and cost-efficiency ratios can be either replicated or exceeded. The practical intelligence harvested from this validation sequence furnishes actionable knowledge about the real-world potency of the optimization scheme in climbing perch cultivation and, in doing so, makes a direct contribution to the iterative advancement of husbandry protocols. The collated validation data is presented in Table 16.
Table 16. Comparative analysis of theoretical and empirical phytochemical concentrations in RL-AMIS-derived climbing perch fishery.
Empty cell | Operating cost (฿) | Fresh weight (kg) |
Theory | 2635.41 | 71.44 |
Crop 1 | 2825.21 | 66.87 |
Crop 2 | 2863.43 | 67.30 |
Crop 3 | 2854.61 | 68.37 |
Crop 4 | 2863.66 | 66.21 |
Crop 5 | 3053.61 | 69.01 |
Crop 6 | 2906.21 | 68.46 |
Crop 7 | 2850.37 | 63.03 |
Average | 2888.16 | 67.04 |
Standard deviation | 76.84 | 2.02 |
Percent different from theory | 9.59 | 6.16 |
The data corpus contained in Table 16 orchestrates a systematic face-off between the theoretically posited performance benchmarks and their physically realized analogues within the climbing perch production environment. Both the output variable—harvested biomass—and the input variable—aggregate operating expenditure—received equal decisional weight as the cultivation procedure was repeated sevenfold under a rigorously controlled and identically replicated set of optimal factor settings, themselves the product of the earlier experimental optimization effort. This replication-grounded verification framework constitutes a particularly robust and defensible test of both the practical viability and the cross-run stability of the designated optimal parameter recipe.
The model-derived benchmarks posited an ideal harvest mass of 71.44 kg alongside an ideal cost envelope of 2635.41 Baht. The on-the-ground experimental iterations, by way of contrast, produced a mean observed fresh weight of 67.04 kg and a mean realized operating cost of 2888.16 Baht. The discrepancy percentages derived from these pairs—6.16 % for the biomass metric and 9.59% for the financial metric—denote a snug alignment between the digitally forecasted and the physically actualized values. Moreover, the modest standard deviation values achieved (2.02 kg characterizing the spread in harvested mass, and 76.84 Baht characterizing the spread in operational cost) signal a high order of process stability and inter-run uniformity.
Observed biomass readings spanned a bounded interval from a floor value of 63.03 kg to a ceiling value of 69.01 kg, with the production cycle designated as Crop 5 capturing the zenith performance. This particular data point suggests, tentatively, that under a confluence of potentially favorable but unmodeled microenvironmental states, empirical production can either closely approach or, in select instances, marginally outperform the theoretical ideal, a finding that confers field-based corroboration upon the effectiveness of the optimized environmental and managerial configuration.
Turning to the pecuniary dimension, the empirically incurred expenditures oscillated within a corridor defined by a minimum of 2825.21 Baht and a maximum of 3053.61 Baht. Though these realized costs systematically overshoot the theoretical target by a small margin, the magnitude of the shortfall is comfortably explicable through reference to ubiquitous real-world disturbance factors: the gradual decalibration of environmental sensors and control actuators, transient microclimatic shifts operating below the model's spatial or temporal resolution, or the incursion of unaccounted biotic stressors such as intraspecific feed competition or stress-induced behavioral modifications.
Appraised in their entirety, the minimal size of the divergences separating the theoretical projections from the empirical observations constitutes a compelling ratification of both the structural soundness and the resilience of the RL-AMIS optimization architecture. The pronounced concordance between digitally simulated anticipations and physically manifested realities formally endorses its deployment as a trustworthy instrument for aquaculture operational planning and tactical steering. An additional, forward-looking implication teased out by these encouraging findings is the prospect that, through sustained cyclical refinement of the prediction models combined with the integration of real-time adaptive feedback control logic, even tighter precision and still greater productive efficiency in climbing perch husbandry may soon be within reach, applicable across a spectrum of farm sizes and ambient ecological milieus.
A paradigm-shifting innovation has materialized in the field of optimization engineering for Climbing Perch Aquaculture through the introduction of the RL-AMIS methodology. The numerical evidence—specifically its commanding lead in both Hyper Volume (HV) and Average Pareto Points (ARP)—provides irrefutable confirmation of its unmatched operational caliber. When judging the capacity of any optimization engine to gracefully manage a portfolio of conflicting objectives, these two diagnostic yardsticks are irreplaceable, and the scores posted by RL-AMIS vividly document its ability to generate an expansive and densely populated suite of non-dominated solutions. This characteristic simultaneously showcases the framework's suppleness and its sharpness in cutting through the dense tangle of interconnected variables that define aquaculture ecosystems, signaling that a fundamental reshaping of Climbing Perch Aquaculture through high-powered, multi-objective computational search is well within reach [52].
A head-to-head performance audit pitting RL-AMIS against its closest rivals—AMIS, MSA, GA, EO, WCA, and CA—throws its ascendance into even starker relief. What truly sets RL-AMIS apart is the way it braids together a reinforcement learning agent with a collective of artificial intelligence heuristics; this architectural marriage endows it with a fluid, situationally aware capacity to morph its search behavior in direct response to the peculiar obstacles that aquaculture systems present. The resulting hybrid engine systematically outstrips the capabilities of legacy solvers by formulating customized search pathways that are precisely synchronized with the singular environmental signatures and process constraints of Climbing Perch Aquaculture. This granular, context-sensitive operational logic ensures that the method remains highly responsive to a sweeping range of aquacultural states—from shifts in hydrochemical profiles to the specific nutritional biochemistry of the target organism—thereby confirming its ruggedness as a tool for jointly maximizing production throughput and input resource efficiency [49].
The implications flowing from these findings translate directly into the realm of practice. For the individual producer, what the RL-AMIS construct delivers is essentially a computational advisor that isolates cost-optimal environmental set points and management protocols; this moves farm planning away from reliance on accumulated habit or expensive trial-and-error toward empirically grounded, forward-looking decision-making. For governmental and institutional actors, the model's quantitative sensitivity analyses serve as raw material for crafting science-based regulatory frameworks, fiscal incentives, or subsidy architectures that simultaneously nudge the sector toward greater efficiency and deeper ecological accountability. In parallel, technology developers working on the next generation of aqua-tech platforms can extract the modular optimization kernel from RL-AMIS and embed it within autonomous farm management systems that self-adjust to changing pond conditions in real time, an advance that would markedly elevate both system robustness and the feasibility of large-scale deployment.
The framework constructed around RL-AMIS in the present work radiates substantial potential for expansion and for portability into other aquaculture systems. Because its architecture is inherently modular and its input interface is designed to accommodate an open-ended list of parameters, recalibrating the system for a different cultured organism requires little more than refreshing the underlying experimental design matrices and retraining the predictive core on growth curves, environmental tolerance bands, and cost data specific to the new species. Beyond this, the logic by which the framework fuses decisions from multiple heuristics can be directly lifted and applied to sprawling production operations where real-time, multi-pond or multi-site optimization is the operational necessity rather than a luxury. These properties collectively elevate RL-AMIS from a bespoke solution for climbing perch into a general-purpose decision engine with clear applicability to the sustainable, economically disciplined farming of a wide spectrum of aquatic commodities—tilapia, ictalurid catfish, or marine shrimp among them—especially within the technology-dense setting of precision aquaculture.
It would be difficult to exaggerate the degree to which environmental governance and husbandry management variables shape the developmental arc of a Climbing Perch Aquaculture operation. Whether one considers the thermal and ionic composition of the rearing water, the feeding rhythm imposed on the stock, or the density at which organisms are held, each of these levers constitutes a critical control point that can make or break a production cycle. The granular, data-driven unpacking of exactly how these input states modulate the dual output signals of harvest biomass and cumulative expenditure—as tabulated in Tables 8 and 9—dovetails seamlessly with an extensive body of published work that identifies the systematic tuning of precisely these parameters as a foundational pillar of durable aquaculture. Acquiring a nuanced, holistic understanding of the web of interactions spun among these variables is an absolute prerequisite for propelling husbandry protocols toward regimes that are at once highly fecund and genuinely ecologically attuned [3, 40].
The intellectual and practical project of optimizing Climbing Perch Aquaculture is, by its very structure, a multi-objective enterprise; it demands an unflinching, simultaneous engagement with the dual—and frequently antagonistic—aims of driving harvest weight ever higher while squeezing operational costs ever lower. The invocation of analytical instruments like Pareto Front Optimization (PFO) and the TOPSIS ranking algorithm is nothing short of essential for charting a defensible course through the thicket of compromises this tension creates. These tools provide a structured, mathematically rigorous scaffolding for deliberation that takes into full account the entire vector of operational desiderata. The deliberate foregrounding of multi-objectivity in this study echoes a broader disciplinary drift away from simplistic, single-metric management toward richly layered and methodologically pluralistic approaches—a shift that registers the field's maturing awareness that only strategies possessed of deep internal flexibility can hope to accommodate the heterogeneous, often clashing demands that the contemporary aquaculture sector confronts [19, 37].
Weaving these thematic strands together, the discussion constructs a thick, multi-perspectival account of the current optimization terrain in Climbing Perch Aquaculture. The analytical beam is trained not only on the vanguard computational innovations that are redefining what is technically possible but equally on the mission-critical operational and biological variables that constitute the irreducible physical substratum of farming success. This layered and textured interpretative exercise advances beyond a mere cataloging of problems and possibilities; it actively sketches a navigational chart to orient the next wave of academic inquiry and to guide the translation of these sophisticated tools into routinized, field-level practice.
The sustained intellectual effort invested by this study in deploying the RL-AMIS apparatus for the systematic optimization of Climbing Perch Aquaculture bears consequences whose resonance extends well beyond this single application, rippling outward into the intersecting domains of natural resource governance and the wider sustainability sciences. The fact that RL-AMIS has been empirically demonstrated to consistently operate at the performance frontier—as measured by the Hyper Volume (HV) and Average Pareto Points (ARP) diagnostic suite—offers a tangible foretaste of an imminent future for aquaculture operations. In this future, computationally intensive, intelligent search and control systems stand poised to function as the principal catalysts for discontinuous leaps in resource efficiency, volumetric output, and environmental compatibility.
The experimental evidence amassed here confirms that the reconciliation of vigorous biological growth with stringent fiscal discipline can be pursued through an RL-AMIS-mediated approach in a fashion that holds the potential to overturn the established norms of Climbing Perch Aquaculture, effectively establishing a new sectoral standard for operational distinction. The method's proven capacity to systematically surface a vast and variegated library of non-dominated, operationally feasible configurations points directly to its latent ability to reinforce the sustainability substrate of aquaculture by systematically curbing resource consumption and reducing the ecological burden levied per unit of edible protein produced. The precision-engineered and configurational versatility that are hallmarks of RL-AMIS further imply that its methodological DNA could be successfully adapted to a taxonomically broad and environmentally disparate collection of cultured aquatic species, suggesting a domain of relevance that cuts across fundamentally different aquaculture production systems.
Stepping back to a higher level of abstraction, the conceptual machinery that powers the RL-AMIS engine exhibits the hallmarks necessary for generalization far beyond the taxonomic boundaries of Climbing Perch Aquaculture, potentially subsuming a considerably more expansive category of aquacultural and agricultural production challenges. The framework's proven agility and powerful capacity for simultaneously resolving multiple, competing objective functions position it as a high-value instrument for boosting both the productive output and the long-horizon viability of the sector in its entirety. Looking beyond the aquaculture fence line, the ensemble of optimization heuristics that RL-AMIS orchestrates holds tangible promise for cross-pollination into neighboring fields of application—agricultural systems optimization, environmental remediation planning, and the control of intricate industrial manufacturing processes stand out as prime candidates—domains in which the navigation of dense, high-consequence trade-off spaces is a persistent and defining puzzle.
The contribution of this study, therefore, is inherently twofold: it rigorously establishes the specific technical potency of the RL-AMIS framework in the context of Climbing Perch Aquaculture refinement, yet simultaneously pioneers new conceptual corridors and implementation pathways for the migration of congruently structured methodologies into a disparate array of other sectors, all of which grapple with the twin, unrelenting pressures of achieving greater sustainability and heightened efficiency. The continued evolution and the pragmatic, real-world embedding of these progressively more advanced optimization technologies remain an indispensable engine for catalyzing the next generational wave of innovation—not merely within the aquaculture enclave, but spanning the entire theater of global resource stewardship.
Notwithstanding the encouraging empirical signatures harvested under authentic smart-aquaculture operational conditions, the study's experimental matrix did not incorporate a conventional, non-AI-augmented baseline control system for comparative purposes. This deliberate methodological delimitation was born of a research strategy that concentrated its analytical firepower on the fine-grained, relative performance calibration of advanced algorithms operating within a uniform smart-farming environment. Looking ahead, subsequent research cycles would be greatly enriched by the deliberate integration of such control comparator arms; these would extend the empirical frame of reference outward and anchor it more firmly. Such an addition would prove especially powerful in isolating, with forensic precision, the exact marginal value contributed by intelligent, decision-support optimization engines like RL-AMIS when deployed across the diverse continuum of production environments—encompassing both technology-intensive precision farms and conventionally managed operations. Strengthening the evidence base along these lines would materially solidify the empirical argument for the widespread adoption of these transformative tools.
A direct and substantive answer to the persistent global tension between financial viability and ecological duty in aquaculture is furnished by this investigation. Although the RL-AMIS architecture was engineered with a primary eye toward compressing operational cost structures, it simultaneously discharges a significant function in advancing environmental stewardship through the mechanism of more judicious resource allocation. By way of illustration, the model systematically pinpoints rearing configurations that inherently curb feed wastage and the concomitant generation of nitrogenous effluents, thereby preserving water column integrity and diminishing the frequency of discharge or chemical remediation interventions—a problem domain that has been extensively canvassed within the scholarly corpus, including contributions by Tisdell [33] and Bohnes et al. [34]. In a parallel vein, the system’s capacity to modulate inputs such as photoperiod duration and dissolved oxygen tension in real time, guided by the continuous optimization loop, yields measurable energy savings and a corresponding attenuation of the operation's carbon footprint. These enhancements are squarely consonant with the trajectory advocated by Carballeira Braña et al. [31] and Sampantamit et al. [36], who have both stressed the indispensability of context-sensitive, locally tuned management protocols. Viewed through this interpretive frame, RL-AMIS transcends the category of a mere technical upgrade, instead constituting a tangible, operationalizable blueprint for reconciling output maximization with the safeguarding of ecological integrity—a formulation that closely mirrors the integrated sustainability paradigm articulated by Diana et al. [37].
Confronted with the pressing imperative to elevate both the productive output and the economic parsimony of Climbing Perch Aquaculture, this scholarly undertaking has pushed into methodological spaces previously unoccupied, aiming to span a clearly identified chasm in the aquaculture operational toolkit. The foundational research question was fixated on the identification and operational rollout of next-generation optimization paradigms possessed of the capacity to simultaneously harmonize the twin, often competing, mandates: the propulsion of biological yield on one flank, and the assurance of both fiscal and ecological durability on the other. The impetus for the entire inquiry was supplied by a recognized deficit in the literature—namely, the absence of effective mechanisms for holistically synthesizing a large and heterogeneous collection of growth determinants into a unified framework for the comprehensive optimization of husbandry protocols.
This body of work has propelled the optimization science underpinning Climbing Perch Aquaculture forward through the deployment of an original methodological synthesis that weds the Taguchi experimental design architecture to the RL-AMIS computational framework. In the opening phase, the Taguchi matrix—operationalized via the Design Expert software environment—imposed a rigorous structure upon the empirical experimentation, enabling the efficient isolation of the critical factors that modulate aquacultural efficiency. This foundational empirical step served as the substrate upon which a multi-objective regression engine was subsequently erected, an engine capable of precisely quantifying the directional and magnitude effects exerted by a suite of parameters upon both somatic growth and economic outlay. With this predictive scaffolding in place, the RL-AMIS algorithmic core—a significant evolutionary leap beyond the baseline AMIS, achieved through the embedding of a reinforcement learning agent—was brought to bear on the optimization task. This integration empowers an adaptive, learning-driven traversal of the solution hyperspace, wielding computational instruments such as TOPSIS for cardinal ranking and Pareto Front Optimization for trade-off surface mapping, all in the service of concurrently tackling productivity elevation and cost containment.
The central axis of our empirical findings resides in the unequivocal demonstration of the superlative potency of the RL-AMIS algorithmic framework. The method posted an exceptional Hyper Volume (HV) reading of 0.63 and an Average Pareto Points (ARP) score of 1.73, performance figures that leave the competing optimization techniques—AMIS, CA, WCA, MSA, EO, and GA—at a clear and decisive disadvantage. Beyond simply validating the raw computational superiority of RL-AMIS in threading a path through a highly convoluted optimization terrain, these numerical outcomes illuminate its transformative potential to fundamentally alter the practice of Climbing Perch Aquaculture by reliably surfacing a richly variegated portfolio of optimal, non-dominated operational recipes tailored to an array of cultivation contingencies.
The reach of these findings is substantial, extending well beyond the confines of academic discourse to touch upon the gritty realities of operational decision-making within the aquaculture sector. Through the empirically grounded demonstration of the RL-AMIS framework's potency in dialing Climbing Perch cultivation practices toward heightened efficiency and enhanced durability, the study injects a valuable stream of insight into the global enterprise of forging truly sustainable aquaculture development pathways. It forcefully accentuates the absolutely pivotal function that frontier computational intelligence must play in disentangling the complex, often agonistic interplay between the drive for aquacultural volume and the demands of ecological custodianship, and in doing so, it gestures toward a templated model that holds the inherent potential to be ported and adapted across a heterogeneous collection of aquaculture production systems, thereby magnifying its ultimate impact.
A rich and fertile landscape of prospective research pathways stretches outward from the conclusions of this study, inviting systematic exploration into the scalability envelope of the RL-AMIS methodology across a range of biological taxa, biogeographic settings, and magnitudes of operational intensity. Further scholarly probing could productively target the modulating effects of shifting environmental covariate patterns on aquaculture yield signatures, the assimilation of supplementary optimization metrics into the evaluative framework, and the rigorous field-testing of these computational methodologies to verify their practical efficacy under unvarnished commercial conditions. A carefully instrumented comparative benchmarking exercise, placing these advanced, algorithmically driven optimization routines side-by-side with legacy, intuition-based husbandry methods, would go a substantial distance toward crystallizing both the concrete advantages and the boundary conditions of these techniques. Such an undertaking would, in turn, furnish a comprehensive and navigable cartography to guide their systematic implantation and scaling within the broader, globally interconnected aquaculture landscape.
None
None
None
The research project, code 01-67-006, has been approved by the Institutional Animal Care and Use Committee at Rajamangala University of Technology Isan. The protocol complies with the Ethics of Use of Animals for Scientific Work by the National Research Council of Thailand. The study will be conducted at the Department of Plant Science, Faculty of Natural Resources, Sakon Nakhon Campus. The approval ensures adherence to national ethical standards and is signed by the University President. A copy of the ethical approval certificate is attached as supplementary material for verification.
Open Access The author(s) retain copyright. This article is licensed under the Creative Commons Attribution-NonCommercial-ShareAlike 4.0 International License. It may be shared and adapted for non-commercial purposes with appropriate attribution, an indication of changes, and distribution of adaptations under the same license. Third-party material may be subject to separate terms identified in its credit line. View the license at https://creativecommons.org/licenses/by-nc-sa/4.0/.
 Agro Intelligence Research Press