The surveillance of animal behavior is a vital tool in animal production systems. This approach to monitoring behavior can serve as an indicator of animal welfare and health status, potentially translating into superior productive outcomes. The present investigation was designed to determine the optimal accelerometer placement (on the halter compared to a neck collar) and data transmission sampling periods (from 6 up to 600 seconds) for the forecasting of behavioral repertoires, which included frequencies of water and feed consumption along with additional activities, in young beef cattle bulls under feedlot conditions. To meet the study’s goals, a suite of machine learning classifiers was implemented, including random forests, support vector machines, multilayer perceptrons, and naive Bayes. Every model examined achieved high classification performance (above 0.90) regardless of placement site, except those trained with the naive Bayes classifier. Accordingly, integrating accelerometers into collars represents a more feasible solution for on-animal use, given the relative ease of application compared with halter mounting. The adoption of a larger dataset (i.e., shorter sampling windows) did not substantially improve the performance of the fitted models. Consequently, operating with datasets of reduced observational density is more beneficial, as it can reduce both the computational load and time investment required for model fitting while simultaneously extending the device’s battery longevity.
The Brazilian beef cattle production chain constitutes a major force within the international agribusiness landscape. Based on ABIEC figures [1], 42.31 million heads were slaughtered in 2022, with 18.02% processed within feedlot operations. The primary hallmark of early Brazilian feedlots was their confinement of animals throughout the dry period. During this window, both the availability and the nutritional quality of forage for these ruminants decline. Stated differently, feedlots function as a critical pasture stewardship tactic during this season. Lately, however, this practice within the beef cattle industry has gained growing traction, with numerous enterprises running feedlots continuously across both rainy and dry periods.
Tracking animal behavior is fundamental to improving efficiency in the livestock industry. Observational assessments of cattle yield profound insights into their overall welfare, health status, and comfort, enabling timely action to prevent emerging problems and enhance output. The behavioral patterns of an animal, when monitored on an individual and ongoing basis, can reflect its well-being and physiological condition [2]. Yet, in a large proportion of these works, behavioral evaluations were conducted through direct human observation or camera-based monitoring, rendering data acquisition arduous due to labor requirements and the difficulty of securing unobstructed imagery within a communal pen where feeding typically occurs. As a result, deploying sensors capable of automated measurement of animal activities offers strong potential to streamline the gathering of such data.
Investigations employing accelerometers to appraise behavioral expression in beef cattle, dairy cattle, sheep, and pigs [3-6] are present in the published literature. The investigators stressed the demand for continued research and refined algorithmic tuning to realize improved behavioral classification. Using identical sensor hardware to that used in the current work, Watanabe et al. [7] examined strategies for inferring cattle behavior using accelerometers secured to halters, with a particular emphasis on less prevalent behaviors, such as drinking events. The team identified that the most effective approach for discriminating low-frequency behaviors involved employing the random forest algorithm combined with upsampling methods applied to the training partition.
The deployment of sensors for behavioral forecasting in animals has proven its ability to ease and support the collection of critical data on the subjects under study. Neethirajan [8] observed that cutting-edge technologies spanning computers, sensors, cloud architectures, machine learning (ML), and artificial intelligence (AI) open pathways for exploring the operational principles of intricate entities, such as biological systems. In the authors’ view, sensor-derived data (whether animal-borne or environmental) together with ML can facilitate the recognition of animal diseases at an earlier stage than conventional diagnostics permit. Furthermore, the authors asserted that the combination of these sensing technologies, large-scale data streams, and ML algorithms holds meaningful economic advantages over historically employed detection methodologies.
The application of accelerometers and machine learning frameworks extends well beyond domestic species. Significant deployments documented in the research sphere include the behavioral classification of avian species [9], feral swine [10], foxes [11], and rabbits [12]. In a 2023 review of sensor-based machine learning for animal surveillance, 60.7% of the analyzed studies employed accelerometers across a variety of tasks; however, the reviewers cautioned that investigations harnessing these techniques remain largely exploratory and have yet to reach maturity [13].
The use of wearable devices such as neckbands [14], head halters [7], and ear-borne tags [15] for behavioral inference is a widely cited methodology across the scientific literature. However, relatively few inquiries have directly compared different accelerometer fixation sites or sampling intervals in livestock. An additional pivotal consideration is that ingestive behaviors (namely, feeding and drinking) can be modulated by the shift from grazing to confinement conditions during the adaptation phase, leading animals to spend less time at the feed bunk [16, 17]. Bovines that spend less time at the bunk may exhibit compromised feed conversion efficiency, thereby adversely affecting both output and economic return [18]. Beyond this, the surveillance of drinking and feeding patterns can support the early identification of pathological conditions [6].
Thus, the central purpose of this investigation was to identify the most efficacious accelerometer fixation point (either halter or neck collar) and to assess a spectrum of data transmission intervals (extending from 6 to 600 seconds) for classifying behavioral constellations, encompassing water and feed intake incidence alongside other activities, in young beef cattle bulls within a feedlot environment during the finishing phase. In pursuit of this objective, we deployed a collection of machine learning algorithms, specifically the random forest, support vector machine, multilayer perceptron, and naive Bayes classifier algorithms.
The experimental work took place within the Forage Crops and Grasslands department of São Paulo State University (Unesp), located in Jaboticabal, São Paulo, Brazil. All procedures adhered to the directives established by the National Council for Animal Experiment Control, having secured authorization from the Ethics Committee for the Use of Animals (CEUA) of Universidade Estadual Paulista (protocol code #007979/18, clearance granted on 14 January 2018).
The measurement instruments deployed throughout this trial consisted of three-axis microelectromechanical system (MEMS) accelerometers (model LIS2DE12; ST Microeletronics®), which constitute commercially marketed products supplied by the Ovi-bovi® Company (80 g, 105 mm × 60 mm × 22 mm) (Figure 1). Their function was to log displacement across three orthogonal axes (X [horizontal plane – lateral motion], Y [longitudinal plane – anterior-posterior motion] and Z [vertical plane – dorsal-ventral motion]). Data logging was configured across a range of temporal resolutions, referenced against real-time behavioral expressions, with the shortest achievable window of 6 s (equivalent to roughly 0.167 Hz) dictated by the manufacturer-delivered unit’s hardware restrictions. Information transfer via a wireless communication protocol (433-MHz band) to a dedicated server maintained by the provider (Ovi-bovi®). Following extraction, the unprocessed data were transformed from a decimal numerical representation to units of gravitational acceleration (ɡ = 9.81 m.s−2) and subsequently archived for analytical purposes in the present study.
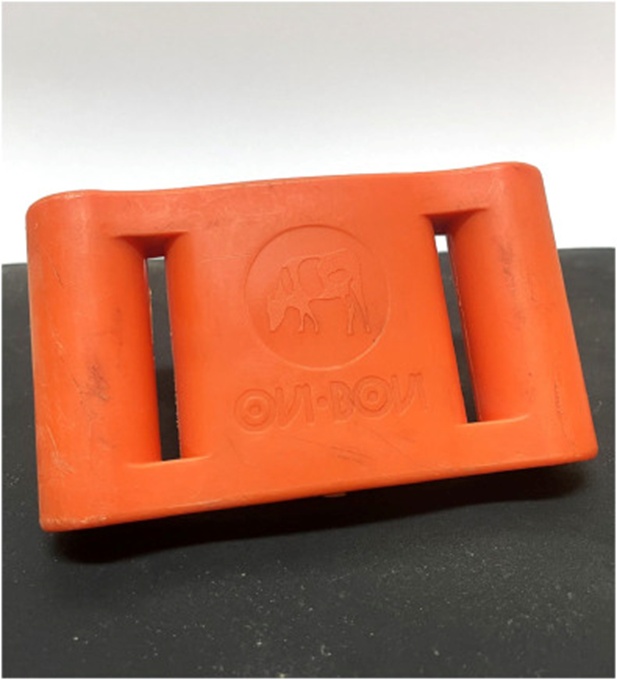
Figure 1. Ovi-bovi® tag with an accelerometer inside the shell.
Operation of the feedlot facility spanned four sequential phases (1: acclimation [coinciding with instrumentation fitting on the initial cohort of 12 Nelore bulls] – 27 May through 10 June 2020; 2: primary data acquisition phase – 11 June through 8 July 2020; 3: secondary acclimation phase [coinciding with instrumentation fitting on an additional 12 Nelore bulls integrated into the experimental cohort] – 9 through 16 July 2020; and 4: secondary data acquisition phase – 17 July through 14 August 2020). This staggered scheduling framework was instituted to permit field testing and recalibration of the accelerometer units mounted on the subjects. Five discrete temporal aggregation windows (6, 36, 60, 300, and 600 s) were evaluated, and multiple machine learning methodologies were applied to discriminate among three mutually exclusive behavioral categories.
A pair of contrasting accelerometer fixation configurations was investigated: Configuration A—affixed to a halter situated beneath the mandible (Figure 2a) of each juvenile bull (mirroring the anatomical placement utilized in the work of Watanabe et al.)—and Configuration B—affixed to a neck collar encircling the cervical region of each subject (Figure 2b; mirroring the anatomical placement selected by Vázquez Diosdado et al. [19]), to register whole-body motion signals. The monitored cohort comprised 12 juvenile bulls, evenly split between the two configurations (six with halters and six with collars), with one instrumented subject per communal enclosure. Housing arrangements consisted of 12 communal enclosures, each covering 48 m² (6 × 8 m) and outfitted with partial overhead shelter, shared feed barriers, and a shared drinking station. Each instrumented subject cohabited with two non-experimental companion animals, resulting in a group size of three heads per enclosure.
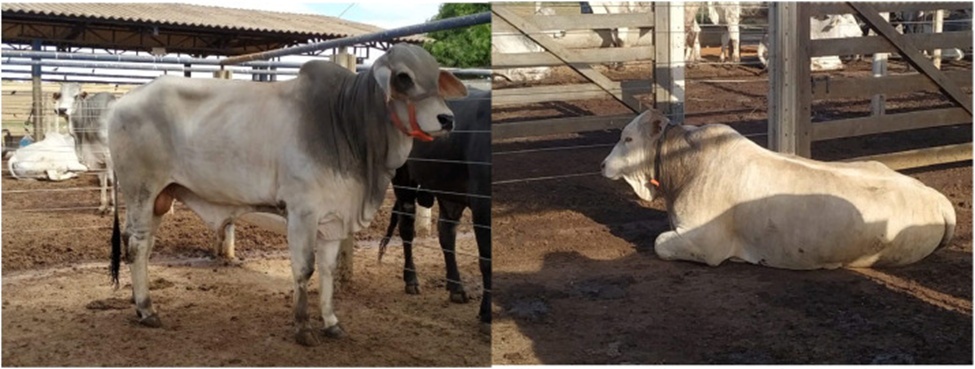
Figure 2. Accelerometer attachment positions: on a halter under the jaw (a - left figure) and on a collar positioned on the neck (b – right figure).
The reference standard for behavioral expression, termed the gold standard [20], was established by analyzing video recordings from a four-camera array (Xtrax® Smart2). Across the trial, 24 cumulative hours of audiovisual documentation were generated, restricted to the daytime window spanning 06:00 am to 06:00 pm, in alignment with the protocol of Barbero et al. [21], and distributed over four non-consecutive dates (23–25 June and 29–31 July 2020). From this visual record, behavioral states were annotated at a fixed one-minute sampling rate, consistent with the approach described by Martín and Bateson [22]. The ethogram comprised three discrete behavioral classifications: feed ingestion, water ingestion, and miscellaneous activities (encompassing rumination, recumbency, and stationary standing).
The complete feature engineering workflow was implemented within the R programming environment (R [23]). Initial processing involved filtering the raw accelerometer output to retain only those diurnal periods and specific timestamps for which behavioral annotations existed. Given that the accelerometer records were structured at a 6-second temporal granularity. In contrast, the behavioral observations were captured at a 60-second granularity; each behavioral label was propagated across the ten consecutive accelerometer readings falling within the corresponding one-minute bin, matched by date and subject identity.
From this harmonized dataset—initially composed of 6-second interval records paired with their respective behavioral designations—four derivative datasets featuring progressively coarser temporal resolutions (36, 60, 300, and 600 s) were subsequently constructed. The data processing script computed an auxiliary variable, designated ʻintervalʼ, that encodes the cumulative count of 6-second increments elapsed since the origin of the recording session. Exploiting this ʻintervalʼ variable permitted the aggregation of sequential observations into broader temporal groupings. For the 36-second resolution, clusters of six successive 6-second intervals were merged. Extending this logic, the 60-second resolution was achieved by merging ten successive 6-second intervals. This same consolidation procedure was iteratively applied to generate the datasets at 300- and 600-second resolutions. When collapsing observations into these expanded windows, the arithmetic means of the triaxial readings (X, Y, Z) and the statistical modes of the behavioral states were computed for each aggregation block. The resultant structured data were subsequently partitioned into 10 subsets, stratified by the five temporal window lengths and the two accelerometer mounting configurations.
Within the finalized data structure, the subsets associated with the halter-mounted configuration at temporal windows of 6, 36, 60, 300, and 600 s contained, respectively, 180,585; 34,483; 21,257; 4,349; and 2,189 individual observation records. Analogously, the subsets associated with the collar-mounted configuration at the same five temporal windows contained, respectively, 156,543; 32,681; 20,599; 4,334; and 2,189 individual observation records.
A suite of derivative predictor attributes was engineered from the gravitational-unit-converted triaxial signals (denoted xg, yg, and zg), following the computational framework established by Alvarenga et al. [24]. The set of constructed attributes comprised the signal magnitude area (SMA), signal vector magnitude (SVM), movement variability index (mov.var), energy, entropy, pitch angle, roll angle, resultant inclination angle ((1), (2), (3), (4), (5), (6), (7), (8)), alongside calendar day and pen identifier (the latter serving to cluster observations according to the specific enclosure assignment of each subject). Conceptually, the SMA metric captures the total area circumscribed beneath the accelerometer waveform, representing the aggregate energetic content of the signal epoch. The SVM metric corresponds to the Euclidean norm of the resultant acceleration vector synthesized from the three orthogonal axes, thereby quantifying the instantaneous intensity of the recorded motion. The mov.var metric characterizes the temporal consistency—or conversely, the degree of fluctuation—inherent in a given movement sequence. The energy attribute provides a scalar summary of the total energy output present in the accelerometer trace. Entropy operates as an index of the stochastic complexity or irregularity present in the signal structure. The pitch parameter defines the angular deviation of the device with reference to the transverse x-axis; the roll parameter defines its angular deviation with reference to the longitudinal y-axis; and the inclination parameter defines the composite angular offset of the device relative to the gravitational vertical, integrating contributions from all three Cartesian axes. The designated response variable was behavior, operationalized as a three-level categorical factor: drinking, eating, and other activities.
 (1)
(1)
 (2)
(2)
 (3)
(3)
 (4)
(4)
 (5)
(5)
 (6)
(6)
 (7)
(7)
 (8)
(8)
Where X, Y, and Z correspond to the output channels of the triaxial accelerometer assembly, and the subscripts i and i+1 index temporally adjacent sampling points. Beyond the accelerometer-derived predictor set, both the communal pen assignment variable and the calendar day variable were retained as inputs across all model specifications constructed within this study.
The complete suite of machine learning analyses, covering model construction, performance evaluation metrics, and exploratory data analysis, was executed in Python [25] using the scikit-learn [26] and pandas [27] libraries. The collection of ML techniques deployed in this investigation included a random forest [28], a naive Bayes classifier [29], a support vector machine [30], and a multilayer perceptron [31]. A random forest is a meta-learning algorithm that grows multiple decision trees on distinct bootstrap samples drawn from the original dataset and averages across the ensemble to deliver enhanced predictive accuracy while simultaneously guarding against excessive model overfitting. The naive Bayes classifier embodies a probabilistic approach rooted in Bayes’ theorem, assuming that each pair of predictor variables is conditionally independent given the target class label and that the conditional likelihoods of the predictors follow Gaussian distributions. A support vector machine operates by constructing an arrangement of separating hyperplanes within a feature space that may be of high or even unbounded dimensionality and, in the present application, is directed toward the task of multiclass classification. A multilayer perceptron is a neural network architecture composed of layers of fully connected computational units with nonlinear activation functions, with parameter estimation performed via the backpropagation learning algorithm [32]. All models were fitted using the default hyperparameter settings.
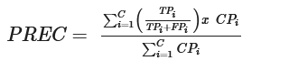
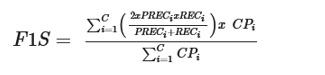
The evaluation benchmarks used to assess the effectiveness of the fitted classifiers comprised accuracy (ACC), recall (REC), precision (PREC), and F1 score (F1S), each computed separately for each behavioral category. To counteract the challenges posed by uneven class distributions, the weighted mean—where the contribution of each class is proportional to its relative representation within the dataset—was adopted for all metrics except accuracy (Eqs. 9-12).
 (9)
(9)
 (10)
(10)
 (11)
(11)
 (12)
(12)
Where TP signifies a true positive (the model correctly identifies an observation as belonging to a given behavioral class), TN signifies a true negative (the model correctly determines that an observation does not belong to a given behavioral class), FP signifies a false positive (the model mistakenly labels an observation as belonging to a given behavioral class when it does not), and FN signifies a false negative (the model mistakenly labels an observation as not belonging to a given behavioral class when it actually does).
As a safeguard against overfitting, the stratified K-fold resampling procedure was applied with 5 folds, and the average across folds was reported for each performance metric. As a complement to the previously described metrics, permutation-based feature importance was also assessed. This method offers a window into the degree to which a model’s predictive accuracy is compromised when the recorded values of a specific predictor are randomly shuffled. At the same time, the remaining predictors are kept intact.
Dedicated transformation workflows were assembled for numeric and categorical variables. For the categorical variables, one-hot encoding was employed, which converts each categorical attribute into a binary indicator matrix. The numeric variables, meanwhile, underwent Z-score normalization, in which each distribution was centered at a mean of zero and scaled to a standard deviation of one. These preparatory transformations were essential to ensure the uninterrupted progression of data through the pipeline toward successful model training.
When examining the entire range of temporal resolutions investigated in this study, behaviors classified under the “other activities” heading were consistently the most frequently occurring among all three categories, with eating ranking second and drinking ranking last, a trend observable for subjects instrumented with both halters and collars alike (Figure 3). Datasets originating from the halter-mounted configuration contained a greater volume of observations across every temporal window when set against those generated from the collar-mounted configuration. Markedly large standard deviation values were recorded for the pitch, roll, and inclination attributes in comparison with the dispersion exhibited by the remaining variables across all constructed datasets.
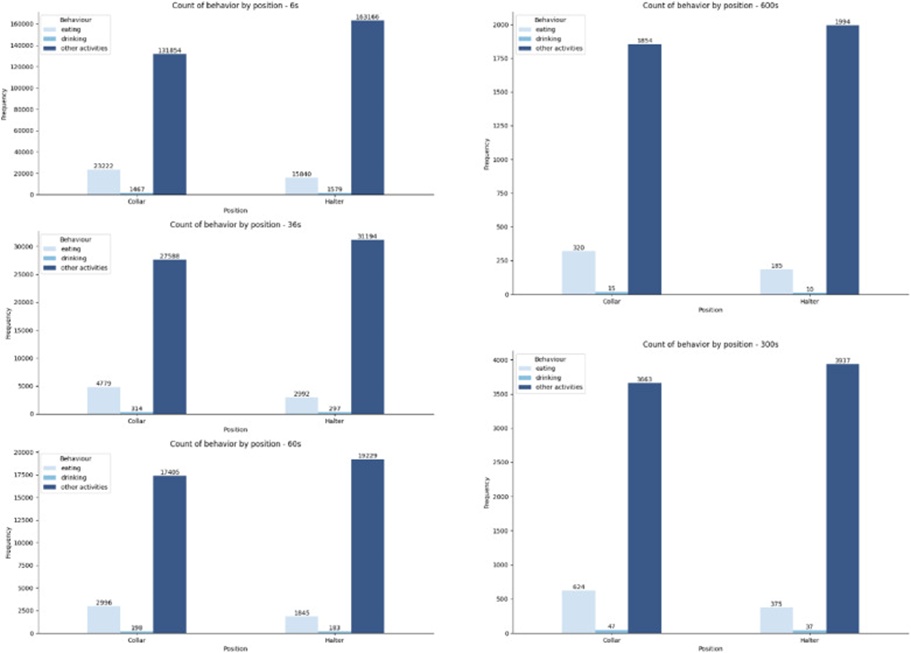
Figure 3. The behavior frequencies measured by the accelerometer at 6, 36, 60, 300, and 600 s.
The performance metrics computed on the held-out test partition were examined to determine whether the trained models could extend their predictive capacity to previously unseen data (Figure 4). Among the competing algorithms, the naive Bayes classifier (NBC) registered the poorest overall metrics, achieving parity with the other modeling approaches only when precision was evaluated for subjects whose accelerometers were fitted to halters. This outcome was followed, in rank order, by the precision scores achieved for collar-instrumented subjects. Within that same algorithmic framework, the recall and F1 score metrics for the halter-equipped cohort were the lowest. Under these specific conditions, the dataset with the fewest observational records (the 600-second window) produced the strongest outcomes. The recall metric for collar-instrumented subjects was marginally higher in scenarios using denser observational datasets (specifically, the 6- and 36-second configurations). No meaningful discrepancies were detected when contrasting the various temporal resolutions within the NBC framework across the remaining assessment scenarios.
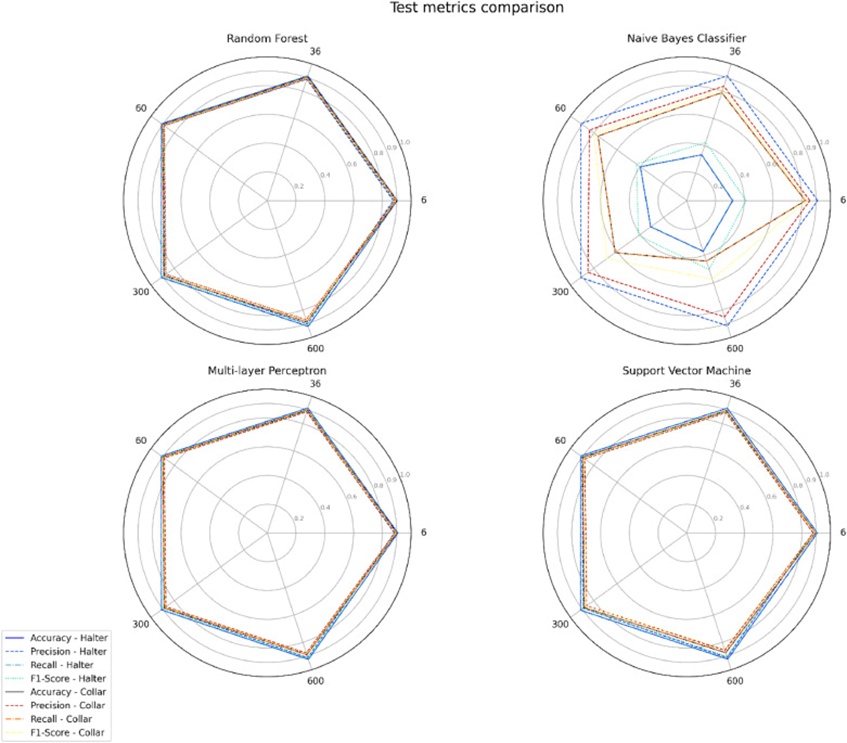
Figure 4. Comparison among the test metrics produced by the RF, naive Bayes classifier, multilayer perceptron, and support vector machine models on the 6-, 36-, 60-, 300-, and 600-s datasets.
Furthermore, negligible performance differences were observed when comparing the random forest (RF), multilayer perceptron (MLP), and support vector machine (SVM) formulations. Marginally higher values for precision, recall, and F1 score emerged when the dataset with the fewest observational records (the 600-second configuration) was used for model construction.
The “pen” variable stood out as the single most influential predictor across all trained model specifications, with its impact being especially pronounced for subjects wearing collars, the solitary exception being the NBC formulation trained on the sparsest dataset (600-second configuration). The “day” variable consistently occupied the position of second-most-influential predictor. The NBC-based model specifications appeared to capitalize the least on the information contained in the predictor variables, a conclusion supported by the observation that these models exhibited the greatest frequency of negative feature importance estimates (Figures 5-7). The MLP-based model specifications demonstrated elevated permutation importance values for the variables under study within the data streams captured from collar-wearing subjects. The modeling frameworks assessed, particularly those constructed using the RF and NB algorithms, did not appear to extract meaningful utility from inclination, roll, pitch, entropy, energy, and mov.var, SVM, SMA, zg, yg, and xg variables, instead registering either low or negative permutation importance estimates for these attributes.
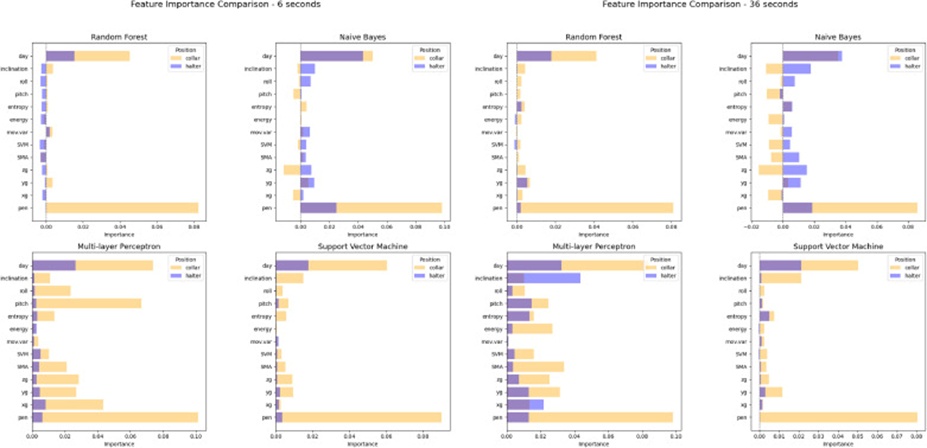
Figure 5. Feature importance levels observed for the datasets with 6- and 36-s time intervals for animals wearing collars and halters.
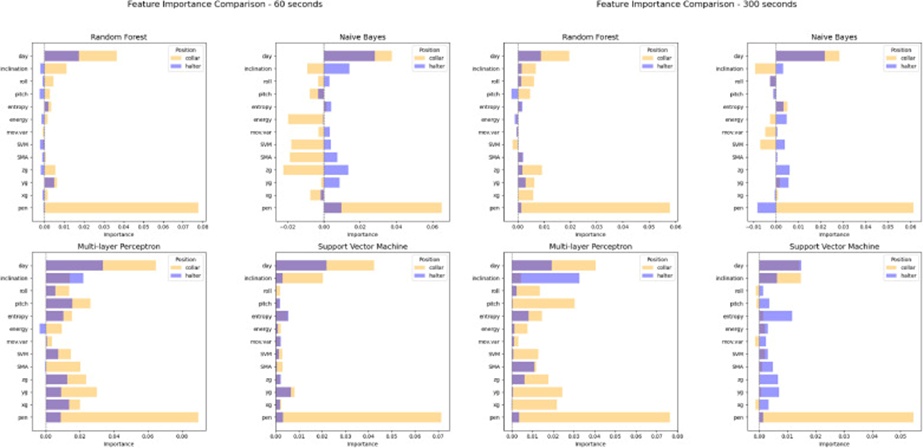
Figure 6. Feature importance levels observed for the datasets with 60- and 300-s time intervals for animals wearing collars and halters.
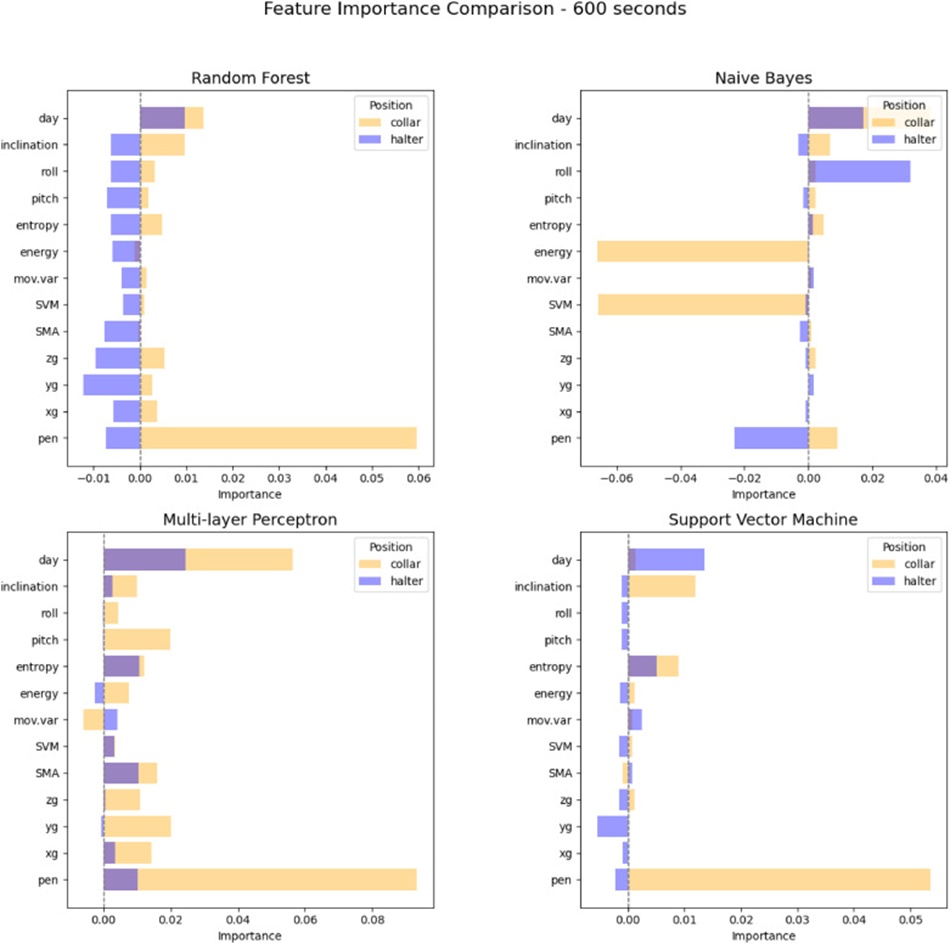
Figure 7. Feature importance levels observed for the dataset with 600-s time intervals for animals wearing collars and halters.
Taken as a whole, the models trained on datasets in which subjects wore accelerometers secured to collars yielded higher permutation importance magnitudes than those derived from subjects instrumented with halters. However, certain notable exceptions were observed, including models built using the NBC algorithm. The MLP algorithm consistently returned higher importance scores for the full set of predictor variables employed—spanning both the day and pen identifiers and the attributes engineered from the accelerometer signals—relative to the other algorithms applied to each dataset.
A side-by-side assessment of the four distinct model types across the range of experimental conditions explored in this investigation revealed that the NBC variant consistently performed at the lower end of the spectrum. A parallel pattern emerges from a study centered on bovine behavior classification that likewise pitted three separate modeling strategies against one another while also examining two alternative sensor placement sites [33]. When juxtaposed with other machine learning paradigms, the NBC framework is encumbered by several well-documented shortcomings, principal among them the foundational assumption that all input features are mutually independent [34] and complications surrounding the selection of relevant attributes [35]. In the specific context of linking behavioral outputs to accelerometer-derived inputs, the NBC formulation lacked the capacity to unravel the nuanced, multifaceted associations bridging the engineered predictors and the outcome variable—a limitation that is further corroborated by the low or even negative permutation-based importance scores this model generated, revealing its fundamental inadequacy in capitalizing on the information furnished by the available variables.
Turning to the remaining three modeling approaches—the RF, the MLP, and the SVM—these yielded broadly comparable performance across all tested scenarios, with only slight upward shifts detectable when the data originated from halter-fitted subjects and were aggregated into 600-second transmission windows. A noteworthy practical distinction, however, lay in the substantially heavier computational footprint demanded by both the MLP and SVM algorithms during training. This burden became especially pronounced when these methods were applied to larger datasets. The multilayer perceptron, by its very design, calls for either deep convolutional stacks or densely interconnected hidden layers [36], and its learning procedure entails the iterative estimation and refinement of synaptic weights and bias parameters for each processing unit [37], thereby inevitably inflating the associated computational cost. A comparable phenomenon characterizes the SVM algorithm, a fact traceable to the nature of the underlying constrained optimization problem [38] as well as to the demands imposed by spatial complexity [39]. In light of these considerations, the RF framework stands out as the more judicious choice for behavioral prediction using machine learning techniques.
The RF algorithm offers the advantage of comparatively modest training times relative to competing approaches, a benefit stemming from its capacity to accommodate sizable datasets without the need for exhaustive preprocessing or handling of data gaps [40]. Furthermore, this method demonstrates considerable robustness to anomalous data points, thereby reducing the need for rigorous data sanitization and preliminary transformation steps [41]. Taken together, these properties position the random forest as a highly capable algorithmic option for forecasting animal behavior. Using the same hardware platform as in the present research, Romanzini et al. [4] reported that the RF formulation outperformed alternative machine learning classifiers.
The modest incremental benefit observed when shifting to the dataset of lower information density (corresponding to more extended aggregation windows), together with the near-negligible differences detected when richer datasets were substituted, speaks to the capacity of the fitted models to operate with considerable effectiveness even when furnished with a comparatively sparse set of training observations. In the view of Feldman et al. [42], amassing ever-larger data corpora does not reliably produce proportional gains in the metrics returned by machine learning systems. The sheer magnitude of input data constitutes only one facet of data characterization; dimensions such as pertinence and fidelity must be accorded equal weight in the assessment.
Although the scholarly literature has emphasized that the anatomical location at which an accelerometer is secured on an animal can exert an influence on the behavioral signal, potentially introducing variability into the captured acceleration waveform [43] and thereby giving rise to systematic measurement distortions [44], the present investigation failed to detect any pronounced divergence in performance metrics among the evaluated model configurations, with the sole exclusion being the NBC. An analogous outcome was observed in a study that systematically compared the effects of three distinct accelerometer fixation points on behavioral categorization accuracy in animals [45]. The application of collar-based sensor systems to livestock with less tractable dispositions constitutes a demonstrably more pragmatic alternative to fitting head halters, and the evidence generated here confirms that collar-mounted deployments can function effectively as a substitute for conventional halter-based arrangements. In addition, although the angular orientation of an accelerometer is susceptible to drift induced by head motion, collar-borne sensors can deliver reliable performance when the task is estimating behavioral state sequences [46].
Shifting attention to the relative contribution made by each predictor within the model construction pipeline, the enclosure identifier emerged as the most consequential variable across the majority of model formulations. The experimental subjects in this trial were housed in group pens, shared with other animals. Bovines maintained under conditions of social separation may exhibit behavioral profiles that differ in meaningful respects from those documented in socially housed conspecifics [47]. Parham et al. [48] have noted that the number of animals accommodated per enclosure can drive behavioral divergence, influencing activities such as ingestion, rumination, and periods of recumbency. In addition to the enclosure variable, the date identifier also exerted a non-trivial influence on the predictive power of the trained models. Research on the activity rhythms of calves managed in intensive production systems has demonstrated that the day factor can shape cattle’s behavioral patterns [49].
When compared with data from the halter-equipped cohort, elevated feature importance magnitudes were evident across virtually all model specifications trained on datasets from animals with sensors attached via collars. The constructed models achieved high classification metrics, indicating that these algorithmic frameworks successfully mined the selected predictor set to achieve accurate predictions [50]. This empirical observation also suggests that integrating accelerometers with collar-based fixation systems may be preferable to halter-based fixation systems.
In marked distinction to the enclosure and date variables, the features computationally derived from the accelerometer signal streams—those intended to capture dimensions of body motion and postural orientation—yielded the most diminished importance scores across the full range of datasets on which the various model formulations were trained. The independence postulate, which underpins the NBC-based model variants, effectively prevented these formulations from capturing the intricate web of relationships linking motion and orientation data to the animals’ expressed behaviors. All of these derived attributes were jointly engineered from the triaxial accelerometer outputs along the x, y, and z axes, resulting in substantial intercorrelations across the entire set of motion and orientation features. It is these pronounced interdependencies that most plausibly account for the meager importance estimates returned by the RF-based model formulations [51]. Because the importance metric was operationalized through the random permutation of a single predictor’s values while all remaining predictors were left undisturbed, the shuffling of any one accelerometer-derived variable failed to produce a detectable effect on this metric, given that the remaining, unaltered accelerometer-based features continued to supply a portion of the informational signal originally conveyed by the displaced variable.
In circumstances where these motion and orientation attributes prove inadequate for reliably disentangling patterns that are uniquely diagnostic of behavior, model formulations relying on MLP and SVM architectures may instead assign greater weight to the enclosure and date variables, which are better positioned to deliver representations that are simultaneously more transparent and more succinct regarding the constellation of factors capable of modulating behavioral expression in animals. The degree of sophistication built into the chosen network topology of an MLP formulation plays a pivotal role in determining its capacity to recover the subtle dependencies that exist among the predictor variables. Should an MLP topology prove insufficiently elaborate, it may struggle to faithfully represent the structure of the underlying data. This predicament becomes especially acute when operating in high-dimensional, highly nonlinear feature spaces [52]. The emergence of low feature importance estimates in the relevant instances in the current study may be traced to the reliance on default hyperparameter configurations in constructing the MLP-based model formulations. This consideration is equally applicable to the model formulations built around the SVM algorithm, using its default hyperparameter settings.
The full complement of model formulations explored in this investigation achieved elevated classification performance, except for those assembled using the naive Bayes classifier. It follows, therefore, that the deployment of accelerometers integrated into collar-based platforms constitutes a more operationally feasible and logistically practical approach than the continued reliance on halter-based mounting, particularly given the comparative simplicity of animal management afforded by the former. Expanding the dataset to achieve a higher density of observational records—by using shorter temporal aggregation windows—failed to yield meaningful gains in the predictive accuracy of the trained models. Hence, adopting datasets composed of a more modest number of observational records is the more strategically advantageous path, as it can facilitate reductions in both computational overhead and the temporal investment required for model training, while concurrently prolonging the functional battery life of the sensing apparatus.
The authors thank the members of UnespFor (Unesp Jaboticabal-SP Forage Team) for their contributions during the field trial setup process and Dr. Walter Maldonado Júnior for his technical support during the initial phase of the experiment.
None
This work was supported by the São Paulo State Research Foundation (FAPESP, process numbers 2015/16631-5, 2017/18750-7 and 2018/20753-7). Rafael Watanabe received a postdoctoral scholarship from the National Council for Scientific and Technological Development (CNPq, process number 151885/2022-2). Matheus Silva received a master’s scholarship from the Brazilian Federal Coordination of Higher Education (CAPES, grant number 001). Julia Rodrigues received a master’s scholarship from FAPESP and CNPq (process numbers 2022/13986-0 and 130045/2022-5). Guilherme do Val received a doctoral scholarship from CAPES/PROEX (88887.374091/2019-00).
The study was conducted in accordance with the guidelines of the National Council for Animal Experiment Control and approved by the Ethics Committee for the Use of Animals (CEUA) of Universidade Estadual Paulista (protocol code #007979/18, approved on 14 January 2018).
Open Access The author(s) retain copyright. This article is licensed under the Creative Commons Attribution-NonCommercial-ShareAlike 4.0 International License. It may be shared and adapted for non-commercial purposes with appropriate attribution, an indication of changes, and distribution of adaptations under the same license. Third-party material may be subject to separate terms identified in its credit line. View the license at https://creativecommons.org/licenses/by-nc-sa/4.0/.
 Agro Intelligence Research Press