The root system is essential not only for nutrient uptake and anchoring the plant but also for shaping crop development and responses to environmental stress. Rhizobox setups permit in situ, non-invasive root observation in soil, representing an economical imaging strategy. Nevertheless, soil’s non-transparent nature frequently produces discontinuous root images with intermittent gaps, diminishing the precision of derived root phenotypic metrics. We propose a root inpainting methodology grounded in a Generative Adversarial Network (GAN) framework. Furthermore, a hybrid root inpainting dataset (HRID) was assembled, containing 1206 cotton root images with genuine gaps and 7716 rice root images with synthetically introduced gaps. Compared with computationally simulated root depictions, our dataset provides authentic root system architecture (RSA) and textural characteristics. Rather than cropping during training, our technique uses downsampled versions of the full image to convey the complete root morphology. Training the model uses binary cross-entropy loss to differentiate between root and background pixels.
Additionally, Dice loss is incorporated to counteract the effects of uneven class representation. Skip connections typical of U-Net are removed, and an edge attention module (EAM) is introduced to retain more granular structural details. Compared with competing approaches, our technique substantially increases recall from 17.35% to 35.75% on a cotton root test collection of 122 images, indicating marked gains in inpainting fidelity. For root area, root length, convex hull area, and root depth, the trait error reduction rates (TERRs) reach 76.07%, 68.63%, 48.64%, and 88.28%, respectively, delivering significantly more accurate root phenotyping outcomes. Both the EU-GAN source code and the 8922 annotated images are openly accessible, offering potential reuse in other AI-driven investigations. This work provides a resilient solution for root phenotyping, thereby accelerating breeding workflows and expanding knowledge of root system behavior.
Constituting the principal interface for water and mineral absorption as well as physical stabilization, the root system underpins vigorous plant growth and sustained crop vitality. Its tissue can store abundant reserves, functioning as the most physiologically dynamic region for resource acquisition and delivering crucial energy and nutritional support when crops encounter stress [1]. The anchoring function of roots enables crops to maintain a firm and stable position within the soil matrix [2]. The subsurface nature of root growth, however, makes it inherently difficult to study their in situ configuration and operation in detail. Shovelomics provided an early means of evaluating in situ crop root traits, yet because root networks are typically expansive and composed of thin, fragile elements, only a small fraction of phenotypic information is preserved through this technique [3]. Advances in phenomics have introduced a broader spectrum of analytical tools for root phenotyping. The application of computed tomography (CT) to visualize whole crop root system phenotypes was reported in 1997, an innovation that subsequently encouraged wider adoption of CT, MRI, and PET modalities in root analyses [4-7]. The substantial equipment investment tied to these imaging technologies has nonetheless spurred efforts to identify more cost-effective phenotyping alternatives. To reveal the structure of the entire root system, different transparent or semi-solid growth media, such as agarose and gels, have been tested. For example, Iyer-Pascuzzi raised 12 rice genotypes in cylindrical gellan gum containers and collected two-dimensional images from multiple orientations to extract comprehensive root system data [8].
A paper bag protocol has similarly been validated for acquiring intact two-dimensional root images. In this method, specially manufactured opaque absorbent paper lines a bag; germinated seeds are placed inside; nutrient solution is supplied; and a flatbed scanner captures the two-dimensional root architecture [9]. However, evidence from Hargreaves showed that root architecture expressed in gel matrices differs from that in genuine soil environments; roots grown in gels showed markedly greater total length and diameter than soil-grown counterparts [10]. The use of rhizoboxes as cultivation units has attracted considerable research interest. To reduce manual handling, Nagel et al. developed GROWSCREEN-Rhizo, a robotic phenotyping platform in which plants grow in rhizoboxes with a single transparent face. These containers are packed closely together, and a mobile imaging chamber navigates between them to record images, thereby economizing on space and labor while enabling high-throughput experimentation within a compact footprint [11]. Along similar lines, Ruppel introduced RootBot, a high-throughput robotic system for root stress phenotyping, comprising multiple clear soil plates arranged in parallel and loaded with soil and polyethylene glycol as the growth substrate. A digital camera and a gantry-style robotic arm, orchestrated by a Raspberry Pi, are mounted on the rig, making fully automated image capture from each soil plate possible [12]. The rhizobox method, which relies on soil as the growth medium, has become increasingly favored within the research community owing to its affordability. Yet the soil’s opacity prevents full visualization of roots against the transparent panel, leading to gaps in the captured root topology and adversely affecting the accuracy of phenotypic measurements. Traditional image processing pipelines are ill-equipped to remedy such distortions, positioning root structure recovery as a significant bottleneck in root phenotyping research.
Ongoing progress in deep learning has proven effective for tackling increasingly intricate phenotyping challenges, spanning tasks such as segmenting plant images [13, 14], identifying stomatal cells [15], and completing plant point clouds [16]. In parallel, deep learning-driven image restoration methodologies present viable pathways for reconstructing obscured portions of root system imagery. Such techniques have already delivered strong performance on object removal and scratch erasure tasks [17, 18]. One notable example is EdgeConnect, a GAN-driven two-stage inpainting network that has been successfully applied to regenerate edge maps as a guide for color image reconstruction [19]. Separately, diffusion-based strategies have been leveraged to iteratively strip away noise and recover high-fidelity original images [20].
Previous investigations have tackled the root of the inpainting problem. For example, [21] proposed the Adversarial Large-scale Root Gap Inpainting (ALRGI) technique, which uses a GAN-based image generation framework to restore cropped root images using a generator, demonstrating promising early results. We note, however, that the generator struggles to predict missing root segments at patch borders. When only a single endpoint is visible to the generator, it may extrapolate unreliable root paths based on the directionality observed from that lone endpoint. When the endpoint corresponds to a root growth tip, extension should not occur. Such shortcomings lead to inaccurate root predictions, and further refinement is warranted. Supplying the generator with the entire root system as context can support the learning of realistic root morphology, thereby enhancing the reliability of inferences about long-distance connectivity.
Accordingly, we describe a root inpainting framework that achieves superior inpainting quality and reliability compared to existing solutions. In the training phase, instead of cropping, we directly scale down images to lower GPU memory consumption. Binary cross-entropy (BCE) loss acts as the principal objective, accompanied by Dice loss to compensate for the imbalanced pixel-class distribution. Our loss formulation computes separate penalty terms for the restored and the originally missing regions, driving the model to devote greater attention to absent root pixels. Moreover, we modify the standard U-Net by discarding its skip connections and embedding an edge attention module (EAM) to strengthen the retention of fine-grained edge cues. At inference time, we likewise downsample the root region, perform prediction, then upsample, and apply a sequence of graphical postprocessing steps to suppress edge artifacts and maintain output quality.
For this study, a soil-based rhizobox served as the cultivation vessel, yielding naturally incomplete images of cotton roots. In contrast, a hydroponic rhizobox was employed to produce fully intact rice root images. The set of 1206 incomplete cotton root images was manually annotated to reconstruct their complete counterparts; meanwhile, the 7716 complete rice root images were algorithmically masked according to predefined rules to create synthetic gap patterns. An enhanced generative adversarial network was trained on this combined information, and the resulting inpainted outputs were further enhanced through repeated inference cycles and postprocessing steps. Figure 1 outlines the overall methodology and data flow.
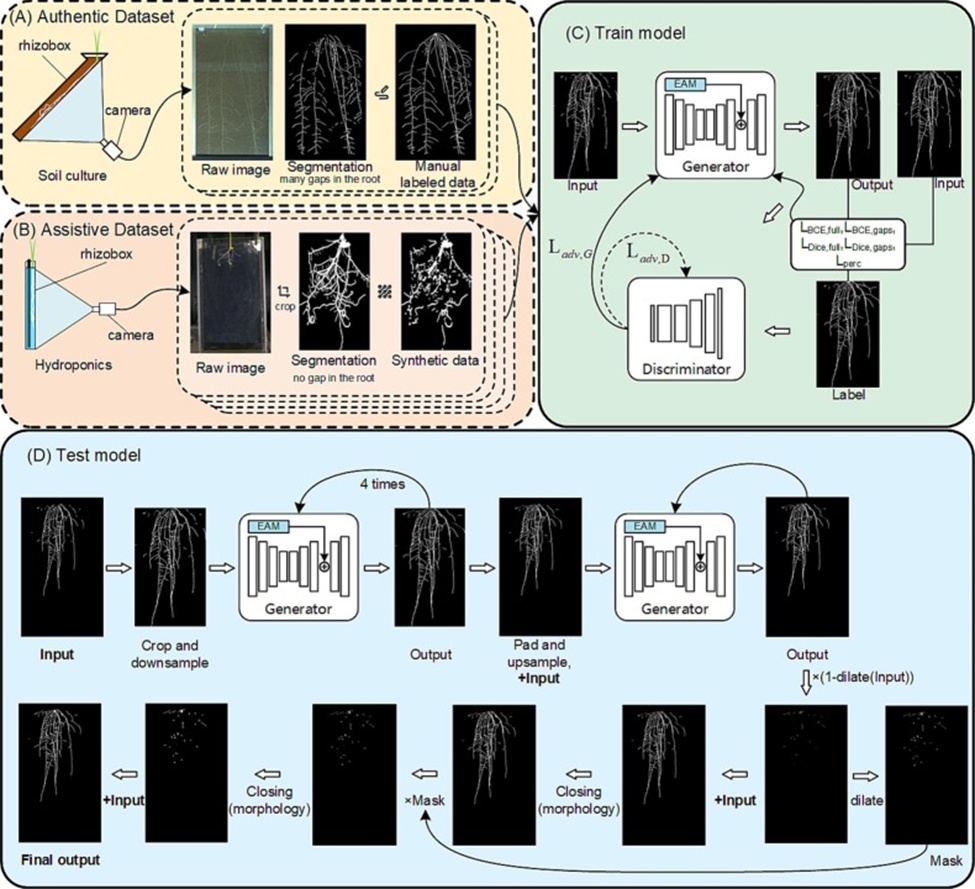
Figure 1. Schematic of the hybrid root inpainting dataset generation and the inpainting pipeline. (A) Soil-based rhizobox imaging acquired raw images featuring root occlusions. Root regions were delineated via segmentation, after which missing root structures were hand-labeled to produce the complete ground-truth references. (B) A hydroponic rhizobox system captured fully intact root images. Following segmentation-based root extraction, adaptive algorithms for random mask generation were deployed to emulate the appearance of naturally occurring root discontinuities. (C) The EU-GAN (Edge-UNet Generative Adversarial Network) model was trained using the hybrid root inpainting dataset assembled from steps (A) and (B). (D) To maximize predictive accuracy for missing root sections while preserving the topological consistency of visible root segments, a multi-scale prediction framework was implemented, involving coarse-grained prediction on downsampled inputs, fine-grained detail refinement, and postprocessing optimization.
All phenotypic data reported here were collected using an automated root-imaging platform at a prominent agricultural research center in central China (Huazhong Agricultural University, Wuhan). Soil-grown cotton roots were the primary focus of the experiment. Cotton seeds were sown into rhizoboxes filled with chernozem and tilted to 45°. A glass panel formed the downward-facing side, permitting photographic capture of the developing root systems.
Seed germination was initiated on May 21, 2022, and 2 days later, the seedlings were transferred into the rhizoboxes. On the tenth day after planting, half of the experimental units were subjected to drought stress, while the remaining half were kept under standard irrigation as controls. In the early growth window, roots were fine yet still distinguishable in the imagery. Starting on May 29, the automated platform collected root images every 2 days. Images from two specific dates, June 10th and June 18th, were selected for constructing the inpainting dataset. At this developmental stage, the cotton root architecture had expanded considerably, making it easier to identify pixels belonging to missing root segments. Several specialists in cotton breeding were brought in to inspect and hand-annotate the missing portions.
Collected images passed through a preprocessing workflow managed by the Root Phenotyping Toolbox (RPT) [22], encompassing perspective correction, root segmentation, and artifact removal, resulting in high-fidelity binary root images. Every image was obtained at a resolution of 2024 pixels (height) by 3400 pixels (width). Across the two collection dates, a total of 1206 cotton root images were acquired and set aside for dataset assembly. Missing root fragments were traced using the open-source labeling application Labelme, with the original color image serving as a visual guide. The quantity of absent root pixels varied from one image to another, with each image demanding roughly 10–20 minutes of annotation effort. The labeled fragments were then combined with the segmentation output (Figure 2A). Even though the overall root system layout could be recognized, precisely completing all the fine root details posed a substantial hurdle. Even highly experienced researchers would require a sizeable time investment to achieve reliable annotations.
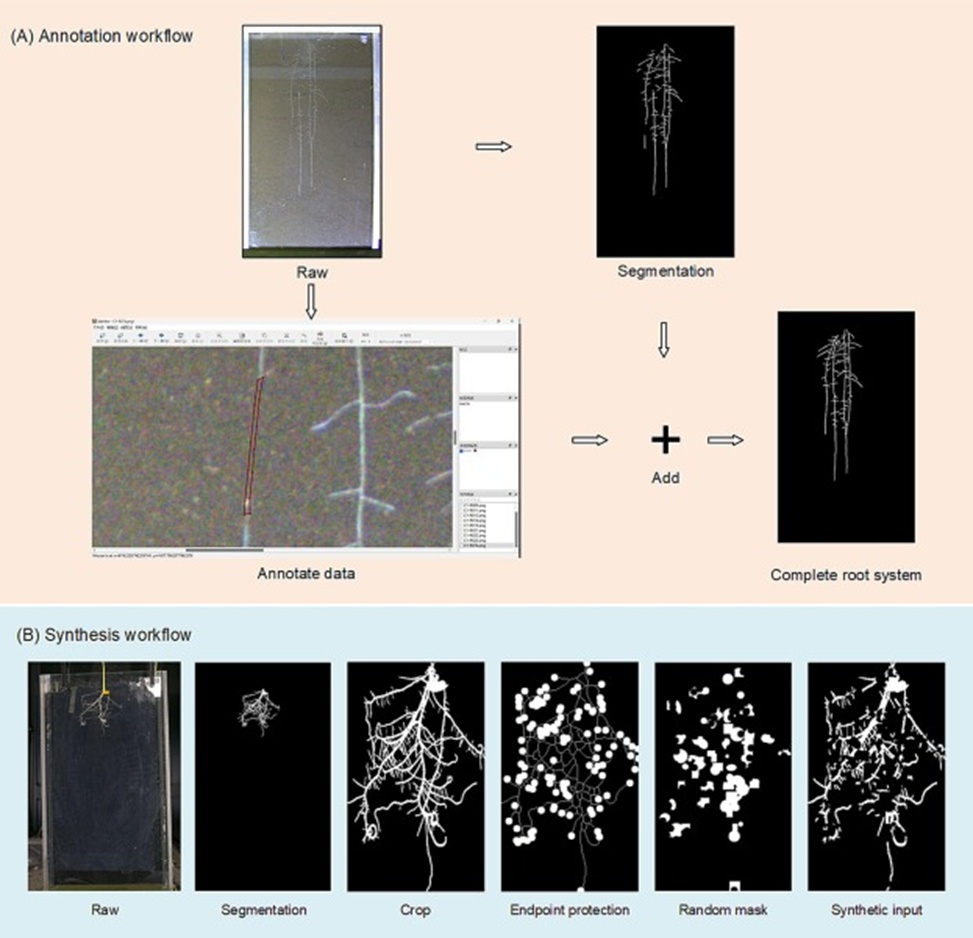
Figure 2. Dataset construction workflow. (A) Annotation procedure for the 1206 cotton root images and (B) Synthesis procedure for the 7716 rice root images.
Synthetic generation pipelines rooted in computer modeling can mass-produce simulated root architectures. By randomly removing pixels from these synthetic images, one can simulate the effect of missing roots, providing a quick route to generating large volumes of root restoration data [23]. Yet a persistent shortcoming of such computer-simulated roots is their unnaturally smooth boundaries, which fail to capture the complex texture profiles of real roots.
To circumvent this constraint, a custom, transparent acrylic rhizobox was designed to capture high-resolution imagery of the hydroponic root system. These real-root images serve as templates onto which randomly generated occlusions are superimposed, yielding an augmented dataset for root restoration grounded in genuine root structures.
The hydroponic dataset contained 7716 images in total, each subjected to controlled random deletion to fabricate root gap regions. To avoid accidentally removing root endpoints—an event that could mislead the model into generating spurious extensions—an eight-neighborhood search was executed to locate every endpoint. Around each identified endpoint, a circular safety buffer of 10-pixel radius was enforced, shielding the enclosed root pixels from deletion. Subsequently, pixels were randomly sampled from the thinned (skeletonized) root structures. These pixels defined the centers of deletion zones with randomized geometry and scale, with shapes drawn from the rectangle, circle, and ellipse categories (Figure 2B).
The finalized Hybrid Root Inpainting Dataset (HRID) was composed of 1206 soil-cultivated root images and 7716 hydroponic root images. From the soil-grown subset, three splits were formed: 70% for training, 20% for validation, and 10% for testing. The hydroponic collection was entirely directed toward training. The average share of missing root pixels was 20.06% in soil-grown images and 26.74% in hydroponic images.
Generative adversarial networks (GANs) stand as a widely adopted paradigm in modern image inpainting literature [24]. Our approach builds upon the classic U-Net as the core architecture for the root inpainting task (Figure 3) [25]. A complication arises, however, from the extremely fine caliber of the roots, which routinely measure less than 10 pixels in diameter. The architecture’s downsampling further compresses these already delicate features. Specifically, the U-Net encoder contracts feature maps to 1/16 of the input spatial dimensions, resulting in a severe attenuation of low-level feature content.
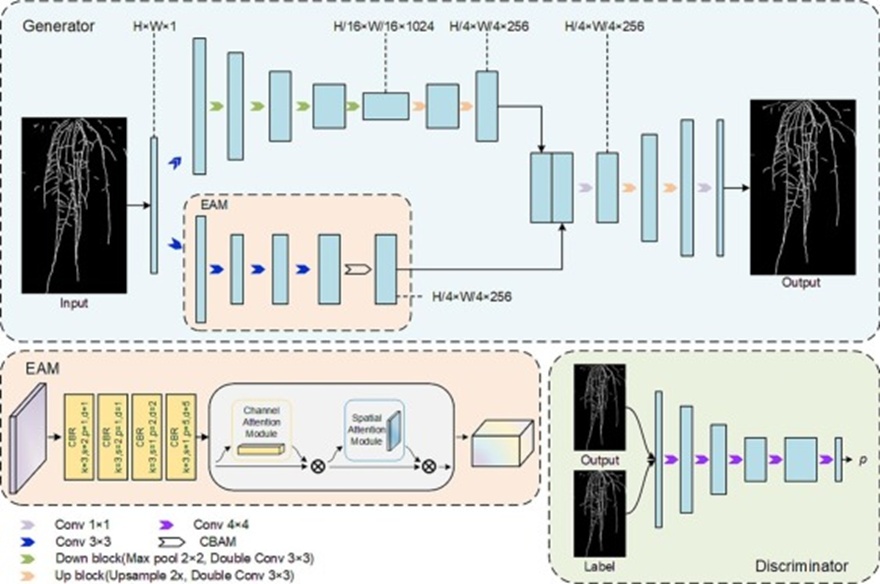
Figure 3. Structure of the root inpainting network. The generator employs a reworked U-Net design in which conventional skip connections are dropped, and an Edge Attention Module (EAM) is introduced to transfer shallow-level, fine-grained signals into deeper semantic representations. The EAM integrates a four-tier convolutional block with a Convolutional Block Attention Module (CBAM). The discriminator follows the standard patch GAN architecture.
Drawing on the two-stream design philosophy of BiSeNet, an Edge Attention Module (EAM) was crafted and paired with a Convolutional Block Attention Module (CBAM) [26, 27]. The EAM is built from four successive 3 × 3 convolutional layers, followed by a CBAM unit. The first two convolutions operate with a stride of 2, halving the spatial resolution of the feature maps twice, while the final two convolutions are configured with dilation rates of 2 and 5. By integrating this EAM into the U-Net framework, the resulting architecture is EU-GAN.
The EAM runs alongside the primary encoder. Upon receiving an input image, the network processes it concurrently through the encoder backbone and the edge attention pathway. Once the encoder path has performed two upsampling stages, the resulting feature maps are concatenated along the channel axis with those emerging from the edge attention stream. This fused representation is then passed through a 1×1 convolutional layer that performs channel-wise blending.
While skip connections in a standard U-Net improve performance by merging features across levels and counteracting vanishing gradients [28], analyses have documented semantic incongruities between encoder and decoder features [29, 30]. In the specific context of root inpainting, the incomplete input image and the complete target image effectively represent separate domains; missing signals embedded in shallow encoder features risk contaminating the learning of deeper semantic representations. For this reason, the Edge Attention Module (EAM) is substituted in place of traditional skip connections. Through a compact set of convolutions and CBAM, the EAM reshapes input features to better align with the decoder’s representational space, preserving fine structural details while enabling favorable gradient propagation. This design rationale echoes concepts from dedicated image inpainting architectures, such as EdgeConnect [19].
For the discriminator component, the model uses a PatchGAN architecture comprising a stack of five 4 × 4 convolutional layers [31]. After the second, third, and fourth convolutions, instance normalization is applied to transform the per-sample features to zero mean and unit variance (Figure 3).
The discriminator’s inputs are the fully intact ground-truth root images and the synthesized complete root images output by the generator. The first four convolutional layers progressively increase the channel dimension to 512, after which the fifth and final convolutional layer reduces it to a single channel.
Training the generator involves minimizing an aggregated loss composed of four components: reconstruction loss, Dice loss, perceptual loss, and adversarial loss. Each component is multiplied by an associated coefficient, and the results are summed.
Reconstruction loss ordinarily quantifies pixel-wise divergence between the network’s output and the ground-truth reference. The standard choice for this purpose is L1 loss, which aligns well with tasks centered on color image synthesis. In the root inpainting setting, however, the network produces a single-channel binary map that separates foreground from background. This framing makes the problem fundamentally akin to pixel-level binary classification.
To improve pixel-wise restoration fidelity, the reconstruction loss was set to binary cross-entropy (BCE), a formulation better suited to binary outputs. The BCE loss is specified as follows:
 (1)
(1)
With y being the ground-truth label and yˆ being the model’s prediction. Alongside the reconstruction loss computed across the entire root system, an additional reconstruction loss term is applied exclusively to the missing root zones, guiding the model’s attention to regions that actually require inpainting. The generator’s reconstruction loss is therefore defined as:
 (2)
(2)
Where x stands for the incomplete input, y for the complete target, Gx for the model’s predicted output, y-x for the ground-truth missing root pixels, and Gx-x for the missing root pixels that the generator synthesizes.
Dice loss captures the degree of spatial agreement between the generated output and the target via set-overlap similarity, naturally concentrating weight on foreground structures. Its mathematical formula is given by:
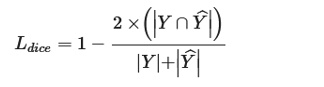 (3)
(3)
A central difficulty in rhizobox imagery is the severe disproportion between foreground root pixels and the dominant soil background; the root system covers only a tiny fraction of the total area. Introducing Dice loss serves to redirect the model’s focus toward the root regions. Here, the total Dice loss is formed by adding the Dice loss calculated on the full root image to the Dice loss calculated solely on the missing root sections. This deliberate double-weighting of missing-root pixel error is designed to drive the model to prioritize its inpainting. Mathematically, it reads:
 (4)
(4)
Perceptual loss operates on feature activations extracted from the hidden layers of a pretrained deep network. Instead of being confined to pixel-level deviations, it evaluates similarity in a latent representational space, thereby encouraging the model to generate outputs that are perceptually more convincing to human observers. A pretrained VGG19 network acts as the feature bank. Feature maps are drawn from five distinct activation layers for both the output and the target, and the perceptual loss is taken as the sum of L1 norms computed between these collected feature sets. Its definition is:
 (5)
(5)
Where fi denotes the i-th group of feature maps, wi is the weight assigned to the i-th L1 distance term, and N is the total number of feature map groups. Adversarial loss is formulated using BCE loss. The complete loss function for the generator can thus be expressed as:
 (6)
(6)
With λ1 through λ4 representing the scalar weights given to each loss term, set to 0.01, 10, 10, and 10, respectively.
The discriminator’s parameters are optimized exclusively via the adversarial signal. This loss comprises two parts: the log-likelihood of the discriminator correctly accepting the ground-truth image as authentic, and the log-likelihood of it correctly rejecting the generator’s output as synthetic. Its mathematical form is:
 (7)
(7)
Feeding entire root images into the model is required for the network to develop a complete understanding of root system architecture. The original soil-grown root images measure 2024 pixels across by 3400 pixels in height, while the hydroponic counterparts are 3672 pixels wide and 5496 pixels tall—dimensions that exceed the processing capacity of standard consumer GPUs. Cropping images into smaller tiles supports learning of local fine-grained detail, but it prevents the model from perceiving the root structure in its entirety. Splitting an image precisely at the tip of an interrupted root segment hampers reconstruction, particularly when the discontinuity spans a considerable distance. To limit information loss from downsampling, we crop each image to the bounding box enclosing its root system, then resize all crops to a standardized 384-pixel width and 640-pixel height. Since root systems vary in shape and extent, mapping them to a fixed frame imposes non-uniform scaling—compression in one direction and stretching in another—which incidentally increases the heterogeneity of the training data. The parameters governing each downsampling operation are recorded, enabling restoration of the native root proportions at the postprocessing stage. Where the resolution reduction obliterates slender roots, the original full-resolution image is injected after the first prediction pass to reintroduce fine-root detail.
The fixed receptive field of convolutional operations means that analysing a large image is equivalent to running a series of overlapping, windowed crops. A model trained on root images at multiple scales can deliver competent global repair on downsampled inputs and also faithfully inpaint roots within native-resolution inputs. Given that the input and output retain identical dimensions, feeding an image through the model multiple times can yield successive refinements in the inpainting result. In a multi-scale prediction setting, small-format outputs must be upsampled back to the original resolution. The dramatic increase in scale introduces substantial aliasing artefacts, which must be rectified through supplementary morphological transformations. The overall procedure is shown in Figure 1D.
At inference time, the root-system bounding box is used to crop and downsample the input image. The resulting compact images are passed through the model five times, and the predictions are then upsampled to match the bounding box extent and padded with zeros to fill the original canvas. Next, the native-resolution image is supplied to the model twice. To counteract aliasing effects, the processed output is subtracted from a morphologically dilated version of the input. Dilating the input thickens root structures so they largely overlie aliasing traces; after subtraction, only the freshly predicted root material remains. These predicted roots are subsequently dilated into a mask and summed with the original input. A morphological closing operation then bridges the newly predicted roots with the original root network. This closing also impacts root regions native to the input. Following the closing steps, root pixels are retained only if they fall within the designated mask area. A final closing pass is performed, and the reconstructed pixels are composited additively with the original image to yield the finished inpainting.
Commonly adopted metrics in the image generation and inpainting literature for assessing visual quality and similarity encompass the Fréchet Inception Distance score and analogues. These measures generally compare broad attributes such as colour distribution, texture patterns, and luminance characteristics across colour, greyscale, or multispectral imagery. Root data, by contrast, take the form of binary black-and-white maps, lacking colour or brightness variation yet requiring strict per-pixel classification accuracy. Intersection over union (IoU), Dice coefficient, precision, and recall are therefore chosen as the primary performance indicators. In addition, we adopt the number of connected components and the tally of newly introduced pixels as supplementary measures that capture the structural quality of root system restoration. All of these indices are computed from the confusion matrix. Precision, which expresses what fraction of the pixels the model flagged as root truly are root, follows:
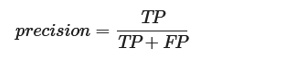 (8)
(8)
Recall, which reflects the model’s sensitivity in retrieving the full set of genuine root pixels from the ground truth, is expressed as:
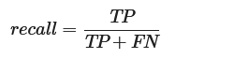 (9)
(9)
Intersection over union (IoU) and Dice coefficient quantify the agreement between the root regions in two images, given by:
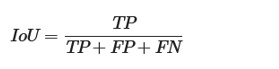 (10)
(10)
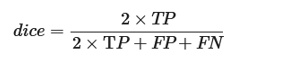 (11)
(11)
The count of connected components equals the number of isolated, contiguous pixel clusters within the image. A drop in this number indicates that distinct root fragments have been successfully bridged into a unified structure. The number of new pixels designates the volume of root pixels generated by the model that were not originally present in the input. This figure provides a straightforward yardstick for the extent of restoration the model has achieved.
Five phenotypic traits—root area, total root length, convex hull area, root width, and root depth—were extracted from the test-set images and compared before and after inpainting to gauge restoration fidelity. Evaluation statistics include the mean, mean absolute error (MAE), Pearson correlation coefficient, root mean squared error (RMSE), and mean absolute percentage error (MAPE). The MAE reduction rate, expressed as shrinkage in trait measurement error attributable to inpainting, was designated the trait error reduction rate (TERR). The count of white pixels defines root area; total root length is the pixel count after the binary root image is skeletonized to a one-pixel-wide medial axis; convex hull area corresponds to the pixel count enclosed within the tightest convex polygon circumscribing the root system; and root width and root depth describe the span of root pixels along the horizontal and vertical axes, respectively. The mean is calculated as:
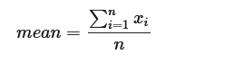 (12)
(12)
Where xi labels the observed value for an individual sample and n is the total number of samples.
The Mean Absolute Error (MAE) is specified by:
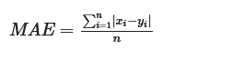 (13)
(13)
Where xi and yi denote the trait values taken from the two datasets being compared.
The Pearson correlation coefficient (r) reads:
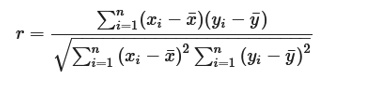 (14)
(14)
Where x¯ and y¯ symbolise the mean values of those traits.
The root mean squared error (RMSE) is given by:
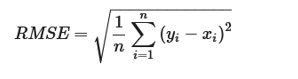 (15)
(15)
Where yi denotes the ground-truth trait value of the i-th sample and xi denotes the phenotypic trait measured from the i-th predicted root image.
The mean absolute percentage error (MAPE) is defined as:
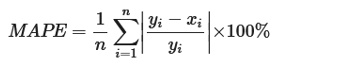 (16)
(16)
The trait error reduction rate (TERR) is computed via:
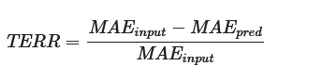 (17)
(17)
Harvesting occurred 26 days after sowing, corresponding to 16 days of drought imposition. Twenty-five individuals were sampled from each of the two groups: those subjected to water deficit and the irrigated controls. For every specimen, six phenotypic parameters were determined both before and after inpainting—namely, root projected area, total length, convex hull area, maximum width, maximum depth, and the width-to-depth ratio. Group-level averages were subsequently derived for the pre- and post-inpainting states, and pairwise differences, along with percentage changes, were analyzed across conditions.
The training procedure used a batch size of 6 and a starting learning rate of 0.0004. Optimization used AdamW, and the learning rate decayed according to a cosine annealing schedule throughout the training run. A five-fold oversampling of the cotton root partition was applied to redress the class distribution skew between the two sub-datasets. All training iterations—150 K in total—were executed on a Windows workstation (Intel(R) Core(TM) i9-9820X CPU, 64 GB RAM, NVIDIA GeForce RTX 3090 GPU with 24 GB VRAM). The code environment consisted of Python 3.9.7, OpenCV-Python 4.5.5, and PyTorch 1.13.1. In parallel, the ALRGI framework was retrained from scratch on our dataset and subsequently tested against the 122 cotton root images. A network variant that substitutes the original U-Net into the generator role (designated U-GAN) was also trained and evaluated head-to-head with EU-GAN.
Leveraging a purpose-built root phenotyping imaging station at Huazhong Agricultural University, a hybrid root inpainting dataset was compiled from two distinct cultivation sources. (1) Soil-grown cotton roots: 1206 raw images were exhaustively hand-labeled by skilled phenotyping annotators to map root portions hidden beneath the soil substrate accurately. (2) Hydroponic rice roots: A suite of adaptive mask generation routines was run across 7716 high-resolution, fully visible root images to synthesize a diverse collection of gap configurations. Side-by-side experimental validation confirmed that the assembled dataset effectively underpins the development of deep-learning-based root inpainting algorithms. Importantly, the global research community currently lacks openly accessible benchmark corpora built specifically for real-world root inpainting. To stimulate progress within plant phenomics, the entire dataset will be made publicly available, equipping researchers worldwide with a resource for both root restoration algorithm design and data augmentation.
Our proposed network and the ALRGI baseline were both trained on the custom root inpainting dataset and compared on the held-out test set across multiple metrics (Table 1). On the server described previously, a single image is processed in roughly 2.58 s. Using the original, incomplete input images as a reference point, precision was 1.0, recall 0.7994, IoU 0.7994, and Dice 0.8885; altogether, 6455 connected components were counted across the 122 images. ALRGI achieved a precision of 0.9790, a recall of 0.7262, an IoU of 0.7151, and a Dice of 0.8339, resulting in a connected component count of 3354.
Table 1. Root inpainting performance indicators. NCC stands for the number of connected components and NNP for the number of new pixels.
Data range | Method | Precision | Recall | IoU | Dice | NCC/NNP |
Entire image | Benchmark | 1.0000 | 0.7994 | 0.7994 | 0.8885 | 6455 |
ALRGI | 0.9790 | 0.7262 | 0.7151 | 0.8339 | 3354 | |
U-Net | 0.8644 | 0.8511 | 0.7509 | 0.8577 | 2310 | |
EU-GAN | 0.9043 | 0.8711 | 0.7976 | 0.8874 | 1601 | |
Root gap area | ALRGI | 0.2198 | 0.1735 | 0.1074 | 0.1939 | 1,398,102 |
U-Net | 0.2793 | 0.2579 | 0.1548 | 0.2681 | 3,897,516 | |
EU-GAN | 0.4377 | 0.3575 | 0.2450 | 0.3935 | 3,446,906 |
Within our pipeline, the U-Net-based generator produced inpainted roots with a precision of 0.8644, recall of 0.8511, IoU of 0.7509, and Dice of 0.8577, reducing the total number of connected components to 2310. Upgrading to EU-GAN improved precision to 0.9043, recall to 0.8711, IoU to 0.7976, and Dice to 0.8874, while further reducing the number of connected components to 1601. The pattern of higher precision alongside lower recall points toward restrained generation of root pixels. Our method outperforms in generating a larger volume of root pixels, capturing the advantage through recall. Integrating the EAM pushed both precision and recall upward and reinforced the topological soundness of the restored root architecture.
When evaluation is confined strictly to the gap zones, our approach continues to exhibit robust metric scores, corroborating the hypothesis that patch-based cropping during training induces unduly cautious model behavior. The addition of the EAM provides auxiliary cues on primary root features, tempering the model’s tendency toward overexuberant predictions—an effect clearly visible in the results (Figure 4). The method distinguishes itself by its capacity to mend short-range root disruptions and to reliably forecast trajectories across long-span gaps.
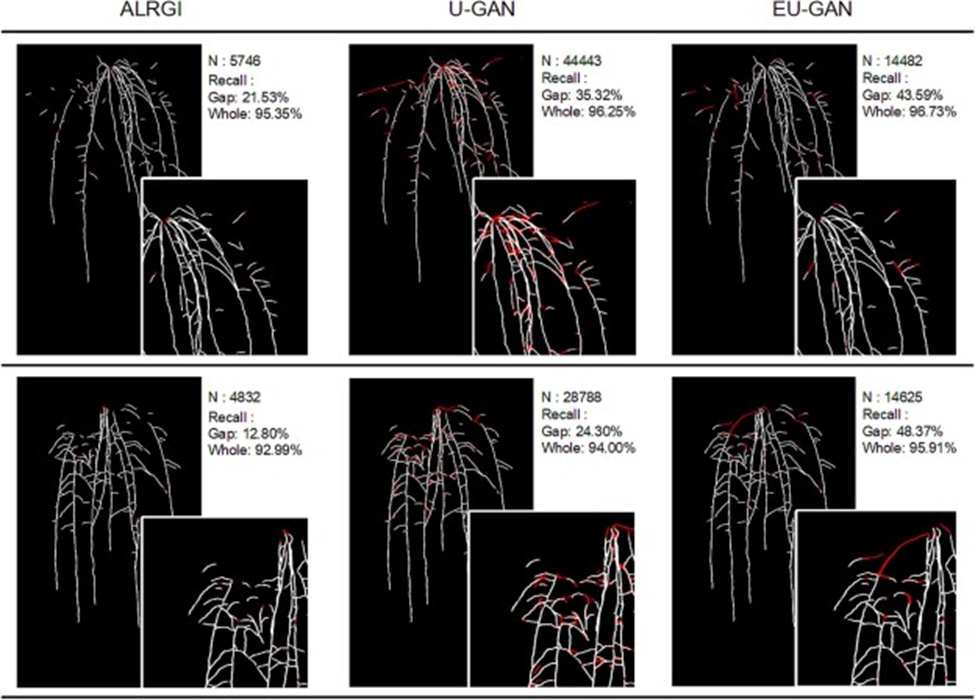
Figure 4. Side-by-side comparison of results from alternative techniques. White denotes the root present in the input; red marks the newly inpainted root; N gives the number of new root pixels. Recall is computed solely over the originally missing root portion (For interpretation of the references to color in this figure legend, the reader is referred to the web version of this article).
When connected components are visualized in distinct colours, it is evident that our approach reconstructs a more complete root network and restores missing upper-level topology with high fidelity (Figure 5). This finding highlights the central benefit of refraining from cropping: the generator absorbs the global architecture of the root system, enabling it to form plausible inferences even for extensive sections of absent upper root material.
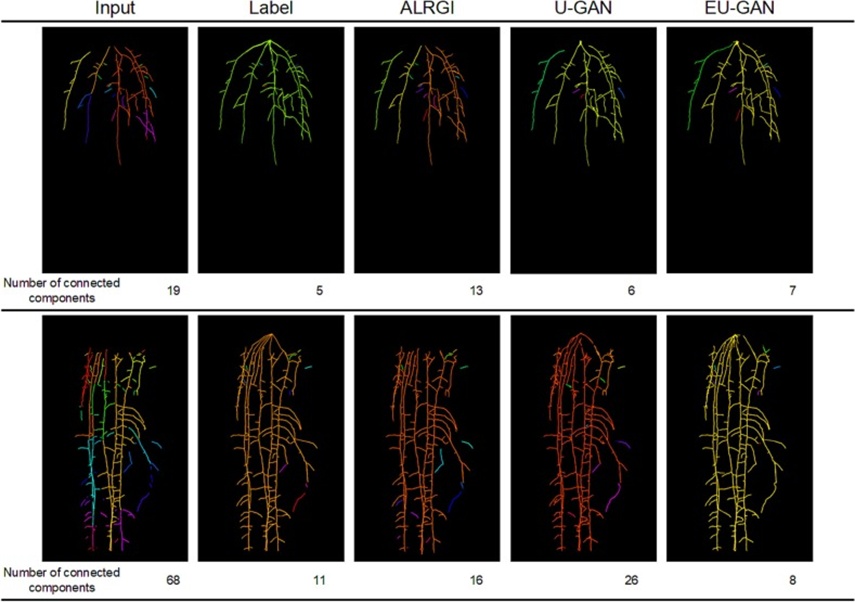
Figure 5. Root inpainting results displayed with colour-coded connected components. Individual colours denote distinct connected components. A reduced colour count inversely reflects the number of disconnected fragments, such that fewer colours correspond to greater topological continuity and a root architecture that is structurally more intact.
Five traits—area, length, convex hull area, width, and depth—were extracted for each test-set root from the input, inpainted, and ground-truth images (Table 2). The mean values across all five traits moved nearer to the ground-truth references. The TERR amounted to 76.07% (root area), 68.63% (root length), 48.6% (convex hull area), 1.32% (root width), and 88.28% (root depth). Pearson correlations between the inpainted images and the labels were 0.9934 for root area, 0.9924 for root length, 0.9979 for convex hull area, 0.9998 for root width, and 0.9998 for root depth. Trait estimates obtained from the inpainted images closely matched those from the labels, with correlations for area, length, convex hull area, and depth all near unity. MAPE and RMSE underwent considerable contraction.
Table 2. Mean values, Pearson correlation coefficient (r), MAPE, and RMSE were computed for the five traits.
Trait | Empty Cell | Mean (pixel) | MAE | r | RMSE | MAPE (%) | TERR (%) |
Area | Input | 137,847.47 | 34,590.6967 | 0.9735 | 41,880.7834 | 20.0742 | 76.0743 |
Pred | 166,100.80 | 8276.0738 | 0.9934 | 11,880.7200 | 5.5746 | ||
Label | 172,438.16 | / | / | / | / | ||
Length | Input | 15,182.90 | 4004.3361 | 0.9651 | 5066.2610 | 19.9035 | 68.6348 |
Pred | 17,953.35 | 1255.9672 | 0.9924 | 1804.1591 | 6.6142 | ||
Label | 19,187.24 | / | / | / | / | ||
Convex hull area | Input | 1,659,212.14 | 39,488.7869 | 0.9974 | 61,501.4791 | 2.3567 | 48.6390 |
Pred | 1,707,600.80 | 20,281.8361 | 0.9979 | 42,346.9654 | 1.2501 | ||
Label | 1,698,700.93 | / | / | / | / | ||
Width | Input | 1321.55 | 2.4918 | 0.9998 | 7.4062 | 0.1671 | 1.3163 |
Pred | 1322.81 | 2.4590 | 0.9998 | 7.8291 | 0.1776 | ||
Label | 1324.04 | / | / | / | / | ||
Depth | Input | 2254.37 | 67.6557 | 0.9906 | 105.4331 | 2.9074 | 88.2845 |
Pred | 2318.57 | 7.9262 | 0.9998 | 13.1258 | 0.4042 | ||
Label | 2322.02 | / | / | / | / |
The Pearson correlation for root width showed minimal change, and, together with the visual evidence (Figure 4), this confirms that our method avoids elongating roots along the axis of growth, thereby keeping the inpainted roots within their original developmental stage. The increase in the correlation coefficient for root length does not indicate that the method artificially ages roots toward a later growth phase. As demonstrated by two representative cases (Figure 5), the method faithfully reconstructs root tops while preserving the growth stage captured in the imagery.
After inpainting, the convex hull area slightly exceeds the ground-truth value. This can occur when roots positioned close to the hull boundary are reconnected along altered courses; an outward deviation in the predicted trajectory can marginally enlarge the enclosed footprint. Such variation is judged to fall within an acceptable tolerance.
Root images of the variety Liaomian 18, taken at eight developmental stages, were examined, with corresponding architectural traits quantified (Figure 6). The trait series continued to track the underlying growth trajectory after completion. This confirms that the inpainting model confines itself to filling gaps appropriate to the current developmental stage, introduces negligible extraneous roots, and, most critically, refrains from extending any root tip.
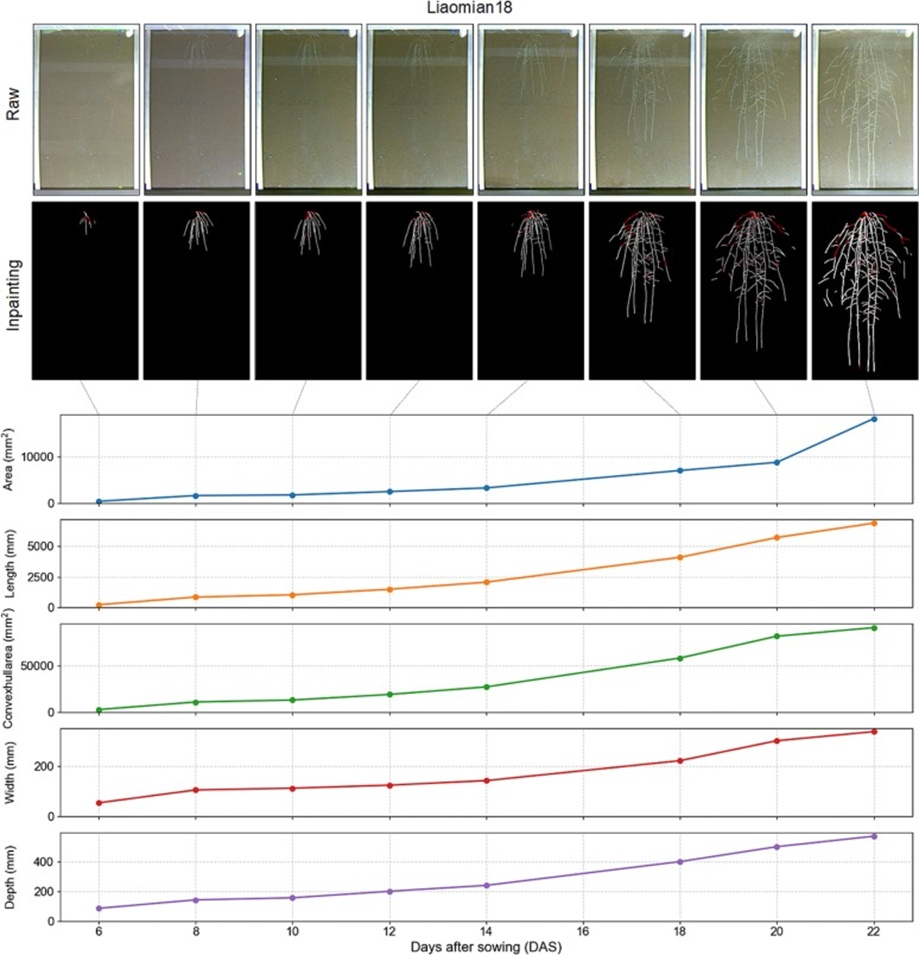
Figure 6. Sequential root images and associated trait profiles spanning eight time points for a single sample. White pixels correspond to the segmented root; red pixels indicate the inpainted root. Five trait metrics—area, length, convex hull area, width, and depth—are charted across the eight timepoints (For interpretation of the references to color in this figure legend, the reader is referred to the web version of this article).
As shown in Table 3, drought stress had a pronounced effect on all root morphological parameters compared with irrigated controls. Compared with the control group, the drought-exposed treatment group (TG) showed steeply reduced values across the board: root area dropped by 54.88% (from 227,373.72 to 102,584.04 px²), root length fell by 51.53% (from 25,534.44 to 12,377.36 px), and convex hull area contracted by 52.24% (from 3,454,465.56 to 1,649,822.40 px²). Reductions in width and depth were comparatively more modest yet still substantial at 26.84 % (1652.84 vs. 1209.28 px) and 30.70 % (2956.80 vs. 2049.20 px), respectively. The uniform decline spanning all parameters implies that water deficit imposes a whole-system suppression on root development. The area-linked metrics (area, length, convex hull) showing > 50% reductions are particularly salient, signalling that drought chiefly curtails the root system’s capacity for spatial expansion and soil exploration.
Table 3. Phenotypic measurements of cotton roots in the drought stress trial (CG: Control group under normal irrigation; TG: Treatment group under drought stress).
Experimental group | Area (px2) | Length (px) | Convex hull area (px2) | Width (px) | Depth (px) |
CG | 227,373.72 | 25,534.44 | 3,454,465.56 | 1652.84 | 2956.80 |
TG | 102,584.04 | 12,377.36 | 1,649,822.40 | 1209.28 | 2049.20 |
difference | 124,789.68 | 13,157.08 | 1,804,643.16 | 443.56 | 907.60 |
relative difference | 54.88 % | 51.53 % | 52.24 % | 26.84 % | 30.70 % |
EU-GAN delivers reliable performance across root images originating from diverse varieties. To gauge model robustness under shifting conditions, an additional set of 8 root images from 6 plant species was sourced from 4 independent root phenotyping facilities. The species included wheat, rice, maize, citrus, chicory, and sesame. Five samples—wheat, rice, maize, and citrus—were obtained at Huazhong Agricultural University, China. Henan University in Henan, China, contributed a wheat sample. A chicory root sample originated from the University of Copenhagen, Taastrup, Denmark [32]. A sesame root image was provided by the University of Florida, Florida, USA [33]. Even though the model was trained only on hydroponic rice roots and soil-cultivated cotton roots, it achieves strikingly effective inpainting on root images from entirely different sources. Given soil-grown root images of wheat, rice, maize, and citrus, it faithfully reconstructs the root structures of these distinct species (Figure 7). These root samples were collected across four independent platforms, each utilizing rhizoboxes of different dimensions. The success on unseen data speaks to the model’s robustness and suggests it can be straightforwardly adapted to root-inpainting tasks spanning a wide array of root system types.
![Figure 7. Inpainting outcomes for root images from different species. (A-F) Root images were collected from four separate root phenotyping platforms. (A) The wheat and rice root samples shown first were gathered at the Crop Phenotyping Center, Huazhong Agricultural University, Wuhan, China, employing a rhizobox of 30 cm width by 50 cm height—the same platform adopted for the cotton root experiment. (B) Maize and rice samples, also from the Crop Phenotyping Center, Huazhong Agricultural University, Wuhan, China, but obtained using a larger rhizobox of 60 cm width by 100 cm height. (C) The second-row wheat root image comes from Henan University, Henan, China. (D) The citrus root image was sourced from the College of Horticulture and Forestry Science, Huazhong Agricultural University, Wuhan, China. (E) The chicory root image originates from the Rhizotrons at the University of Copenhagen, Taastrup, Denmark [32]. (F) The sesame root image was provided by the University of Florida, Florida, USA [33].](https://pubsys.eshragh.co/storage/files/pub-article/19e2b853-c970-4b22-90a6-3e2737736a54-arpkzJVwdPSBC7i7/image.jpg)
Figure 7. Inpainting outcomes for root images from different species. (A-F) Root images were collected from four separate root phenotyping platforms. (A) The wheat and rice root samples shown first were gathered at the Crop Phenotyping Center, Huazhong Agricultural University, Wuhan, China, employing a rhizobox of 30 cm width by 50 cm height—the same platform adopted for the cotton root experiment. (B) Maize and rice samples, also from the Crop Phenotyping Center, Huazhong Agricultural University, Wuhan, China, but obtained using a larger rhizobox of 60 cm width by 100 cm height. (C) The second-row wheat root image comes from Henan University, Henan, China. (D) The citrus root image was sourced from the College of Horticulture and Forestry Science, Huazhong Agricultural University, Wuhan, China. (E) The chicory root image originates from the Rhizotrons at the University of Copenhagen, Taastrup, Denmark [32]. (F) The sesame root image was provided by the University of Florida, Florida, USA [33].
The scope of the root inpainting network extends to related fine-structure completion problems, such as road inpainting in remote sensing road extraction pipelines. Road segments that become fragmented in overhead imagery due to occluding phenomena, such as clouds, can be reconnected using the inpainting network. The Deep Globe Road Extraction Challenge provides abundant satellite image data [34]. We simulated cloud cover using Perlin noise [35], applied a threshold of 170 to extract the densest cloud regions, and removed road pixels within those regions from the label maps. When the occluded images were processed by the model trained in this study, the outputs demonstrated that the network can bridge disconnected road fragments by leveraging textural patterns and directional continuity (Figure 8). This outcome underlines the broad potential of EU-GAN across a variety of fine-structure inpainting scenarios.
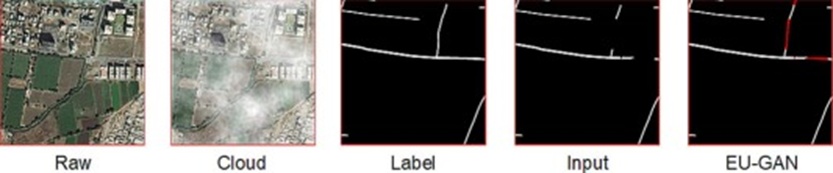
Figure 8. Road inpainting outputs from EU-GAN applied to a remote sensing road segmentation task.
Deriving precise root inpainting evaluation metrics is inherently difficult. For a given pair of endpoints, the trajectory sketched by a human annotator and that produced by the model may diverge marginally, and it is not always clear which reconstruction better represents the truth (Figure 9A). In cases where only a single endpoint is fixed, the model’s predicted other end may depart from human judgement, and deciding whether that prediction constitutes an error is equally ambiguous (Figure 9B). The model also has identifiable weaknesses, among them a limited ability to accurately reconstruct the basal region where the root system initiates (Figure 9C).
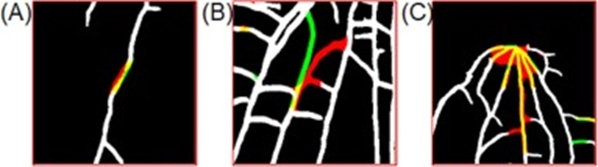
Figure 9. Illustrative failure cases of our approach. White pixels mark the root in the input; red pixels mark erroneously predicted root; yellow pixels mark correctly predicted root; green pixels mark ground-truth root that the model missed. (For interpretation of the references to color in this figure legend, the reader is referred to the web version of this article.)
Improving datasets and network architecture may lead to better performance.
The slender morphology of roots combined with the expansive scale of root systems makes image annotation both technically demanding and resource-intensive [32, 36]. Manually traced missing segments generally capture only an approximation of the root trajectory and can diverge from the authentic root in terms of shape and surface detail. Maintaining a uniform diameter that matches the real root during manual labeling, for instance, proves especially challenging. At the same time, the segmentation model’s accuracy directly impacts dataset quality, necessitating further rounds of manual verification. Moreover, the training corpus was limited to soil-grown cotton roots and hydroponically cultivated rice roots. Different crop species express distinct root architectures under varied cultivation regimes and container geometries. Although EU-GAN has demonstrated strong results on current datasets, assembling a broader, more heterogeneous training dataset could further strengthen the model’s generalization.
In parallel with enriching dataset variety, architectural enhancements to the model itself hold promise. U-Net is a computationally lean and efficient architecture that delivers strong results across a range of tasks, including semantic segmentation. Yet as deep learning continues to advance, larger-capacity networks often achieve superior performance on complex tasks. Investigating more recent backbone designs, including Vision Transformer (ViT) or Vision Mamba (ViM), may unlock additional gains for root inpainting applications [37, 38].
The inpainting algorithm bolsters the dependability of fine-scale root phenotypic parameters, creating opportunities to accelerate candidate gene discovery. In frameworks such as genome-wide association studies (GWAS), phenotypic deviation values typically serve as input features. By refining the reconstruction of root architecture, the algorithm markedly improves the reliability of detailed traits, such as stratified biomass estimates and individual root characteristics. In upcoming work, we intend to collect root phenotypic measurements at higher spatial resolution and to pursue gene-mapping investigations further to substantiate the practical value of this inpainting approach.
A hybrid root inpainting dataset incorporating genuine, fully intact root information has been constructed and publicly released. The dataset encompasses 8912 root images; from the 7716 complete root images, a large volume of paired data can be rapidly synthesized via the adaptive mask generation procedure. Our proposed EU-GAN root inpainting model achieves strong results on soil-cultivated cotton root images, producing higher-accuracy, more structurally complete inpaintings. The approach successfully restores more missing root segments and bridges longer gaps. This gain stems from training on whole-root images rather than cropped patches, enabling the model to internalize the root system’s global architecture. The edge attention module (EAM), by supplying shallow feature information, improved the network’s inpainting performance from 25.79% to 35.75%.
Furthermore, the loss function was deliberately formulated to amplify the penalty for missing root pixels, directing the model’s learning toward the spatial location and magnitude of discontinuities and yielding targeted improvements in inpainting fidelity. Trait computation results confirm that the restored roots exhibit increases in area, length, convex hull area, width, and depth, thereby enhancing the completeness and precision of the extracted phenotypic information. This effectively recovers phenotypic data otherwise lost to soil occlusion, enhances the accuracy of root trait quantification, and provides more precise phenotypic inputs for downstream biological analyses.
This work was supported by the National Key Research and Development Plan (2021YFD1201500, 2022YFD2002304), National Natural Science Foundation of China (U21A20205), Key Agricultural Core Technology Research Project in Hubei Province (HBNYHXGG2023-9), Fundamental Research Funds for the Central Universities (2662024ZKPY003).
None
None
None
Open Access The author(s) retain copyright. This article is licensed under the Creative Commons Attribution-NonCommercial-ShareAlike 4.0 International License. It may be shared and adapted for non-commercial purposes with appropriate attribution, an indication of changes, and distribution of adaptations under the same license. Third-party material may be subject to separate terms identified in its credit line. View the license at https://creativecommons.org/licenses/by-nc-sa/4.0/.
 Agro Intelligence Research Press