Edge devices are increasingly regarded as a portable, budget-friendly alternative to conventional personal computer terminals, offering a promising route toward downsizing equipment and highly flexible robotic fruit harvesting at the field scale. The present study proposes a compact, optimized You Only Look Once version 8n (YOLOv8n) architecture tailored for Orah fruit detection and subsequent deployment on an edge computing platform. Initially, ADown modules were brought into the design to shrink the overall model footprint while safeguarding detection performance. Next, a Concentrated-Comprehensive Dual Convolution (C3_DualConv) component, built around paired convolutional bottlenecks, was devised to reinforce the network’s ability to perceive Orah fruits partly hidden behind branches and foliage; this intervention also contributed to additional model compression. Furthermore, a Bidirectional Feature Pyramid Network (BiFPN) equipped with a high-resolution layer at pyramid level 2 was adopted to facilitate more powerful multi-scale feature aggregation. In parallel, three Coordinate Attention (CA) mechanism modules were embedded to sharpen the system’s sensitivity to Orah fruit features. Finally, a more targeted minimum points distance intersection-over-union loss formulation was applied to improve detection throughput for Orah fruits experiencing dense mutual occlusion. Experimental trials confirmed that the enhanced YOLOv8n architecture reliably pinpointed Orah fruits operating inside challenging orchard scenes, delivering precision of 97.7%, Average Precision at IoU threshold 0.5 ([email protected]) of 98.8%, and an F1 score of 96.69%, all while occupying a lean 4.1 MB of storage on a Windows-based system terminal. The resulting model was then optimally transferred to an Nvidia Jetson Orin Nano via the TensorRT Python Application Programming Interface (API), achieving a mean interface throughput of over 30 fps and thereby verifying real-time detection performance. The outcomes of this work stand to offer technical foundations for Orah fruit robotic harvesting powered by edge-based computing.
Citrus leads all fruit categories in Chinese production volume, with output figures touching 64.3376 million tons in the year 2023. Within this broad genus, Orah fruit—a variety cultivated extensively across the southern provinces—commands strong consumer preference thanks to its appealing flavor profile and high nutritional value, and has matured into a cornerstone of the rural economy for communities pursuing poverty alleviation and revitalization. Throughout Orah fruit production, harvesting is the single most labor-intensive operation, accounting for an estimated 50%-70% of total production labor [1]. Despite this, harvesting to date has relied heavily on human effort. These circumstances create a clear and pressing demand for the invention of intelligent robotic harvesting systems purpose-built for Orah fruit, paving the way to displace the manual harvesting paradigm.
The success of intelligent robotic harvesting hinges on accurate fruit perception in messy orchard environments, where both detection precision and temporal responsiveness determine the feasibility of effective automation. Yet robotic picking of Orah fruit poses significant challenges due to erratic lighting swings, fruit-to-fruit overlap, and visual obstructions from branches and leaves. Over the past ten years, a growing body of scholarship has turned to established machine vision pipelines to overcome these barriers in citrus contexts. For example, [2] constructed a monocular vision apparatus based on LBP features and a Support Vector Machine (SVM) to flag ripe citrus specimens across naturalistic orchard backdrops autonomously. Their setup yielded identification accuracy exceeding 86% for mature fruit under heterogeneous lighting and occlusion conditions. [3] developed a citrus detection routine based on LBP-driven reconstruction of occluded contours, achieving a precision of 82.3%. While delivering improved detection fidelity under shifting lighting and occluding elements, their approach leaned on manually tuned artificial lighting, curtailing adaptability when transitioning between dissimilar scenes. addressed the twin problems of erratic illumination and leaf-fruit occlusion by proposing a mature-fruit detection and spatial referencing framework that couples machine vision with the Hough transform to recover the authentic citrus boundary. Their technique achieved 97.44% recognition for nearby mature specimens. [4] engineered an LBP-based pipeline to detect and enumerate immature green citrus under mixed lighting and stochastic occlusion, achieving an overall accuracy of 85.6% and offering new insights into recognizing objects whose coloration blends foreground and background. [5] combined super-pixel partitioning with the Finlayson two-dimensional integration algorithm to remove shadow artifacts from sunlit citrus imagery, achieving 83.16% accuracy and establishing a reference case for targets where lighting casts shade across fruit surfaces amid occluding branches, foliage, and neighboring fruit. [6] refined an image-centric manifold ranking framework for green citrus segmentation, achieving 94% segmentation accuracy, a 3.19% false positive rate, and a 1.64% false negative rate, and offering transferable lessons for detecting other green-skinned fruit that share foreground-background color similarities. [7] developed an RGB-D-driven algorithm for detecting and spatially localizing citrus in natural orchard environments, achieving an F1 score of 0.9197 and thereby demonstrating robust detection under continuously evolving natural illumination. [8] proposed a noise-immune RGB-D feature fusion network to address the limitations of purely RGB-based citrus detection, charting an alternative path for scenarios marred by degraded depth imagery and elevated noise due to unconstrained lighting and cluttered orchard scenery. Moreover, turning to citrus species bearing close resemblance to Orah fruit in outward color and overall shape, [9] rolled out a navel orange identification technique anchored in wavelet transformation and Otsu threshold denoising, logging a total recognition rate of 92.07% for navel orange samples spanning varying occlusion, lighting, and surface pigmentation conditions. [10] recommended a progressive center-localization scheme for disentangling mutually overlapping pomelos and pinpointing fruit pedicels, achieving an average recognition rate of 94.02% and providing a meaningful touchstone for handling overlapping fruit configurations. That being said, model recognition efficacy erodes under heavy occlusion and dramatic lighting disturbances. While the foregoing conventional machine vision strategies provide partial solutions for automated citrus sensing and classification, their outputs remain highly sensitive to illumination conditions. Beyond this, fruit-on-fruit occlusions and canopy obstructions are recurring stumbling blocks, especially when fruits crowd together or recede behind leafy branches, making it exceptionally taxing for classical machine vision tools to parse and locate individual specimens correctly. Collectively, those methods exhibit limited adaptability and limited generalization, forcing per-scene threshold or parameter retuning. Additionally, their throughput rates struggle to meet the real-time operational requirements of intelligent robotic harvesting platforms. Accordingly, elevating the flexibility and generalization strength of fruit perception algorithms demands an urgent pivot toward the investigation and assimilation of emerging technologies.
Driven by ongoing progress in object detection methodology, networks built on convolutional architectures now deliver substantially stronger generalization and appreciably higher accuracy when tasked with citrus fruit perception under adverse visual conditions—namely, erratic illumination, mutual fruit occlusion, and canopy obstruction. Consider, for instance, the work of [11], who adapted the YOLOv4 framework and developed a rapid citrus identification pipeline suitable for orchard deployment. The refined algorithm proved more capable of accommodating small objects, noisy background noise, and heavy occlusive interference. Their reported average detection rate across citrus at various phenological stages was 96.04%. In another case, Li et al. fused feasible convolutional operations with SimAM attention weighting to achieve small, tightly grouped citrus, ultimately reporting an average precision of 86.86% and a precision rate of 92.90%; the integration clearly strengthened detection in scenarios characterized by substantial size heterogeneity and dense clustering. A notable shortcoming, however, was that the recall metric stalled at merely 76.07%. [12] modified the YOLOv5 codebase to emphasize small-target fruits populating high-density citrus zones, achieving an average precision of 98.4%. While their enhancements meaningfully improved sensitivity toward small, closely packed fruits, the overall parameter bulk of the model has yet to be sufficiently trimmed. [13] proposed a streamlined architecture, YOLOv3-LITE, achieving an F1 score of 93.69% and an AP of 91.13%. When executed on GPU hardware, it processes citrus targets at 246 fps and occupies a slender 28 MB memory footprint, demonstrating that compactness and reliable accuracy can indeed coexist. [14] jointly employed convolutional neural network representations and visual saliency heatmaps to classify citrus ripeness under field conditions, achieving an accuracy of 95.07%; this beat the results obtained with VGG16 and K-Nearest Neighbors (KNN) by margins of approximately 3.14% and 18.24%, respectively. [15] engineered an FR-YOLOv4 model variant specifically aimed at Chun Jian citrus. They achieved an average precision of 94.6% at a frame processing rate of 51 fps, thereby elevating detection accuracy for small citrus specimens under dense occlusions. [16] described a citrus recognition system, YOLOv8-MEIN, that yielded an average precision of 96.9% and a recall of 91.7%, and the entire model required only 5.8 MB of storage—substantially improving recognition performance when extensive fruit overlap and foliage occlusion were present. [17] introduced the MFAF-YOLO detector, reporting an average precision of 90.2% on citrus fruit detection tasks in challenging backgrounds while simultaneously reducing the model size to 10.7 MB, striking a harmonious trade-off between lightness and accuracy. Xu et al. developed the HPL-YOLOv4 model for citrus detection, achieving an AP score of 98.21% and a precision of 93.45%, while reducing storage requirements from 250.7 MB to 43.5 MB. Taken together, these published results convincingly illustrate that deep convolutional architectures possess inherently strong generalization properties. Their high degree of adaptability and innate feature extraction power make them exceptionally well-suited for discerning fruit in complex visual environments rife with variable lighting, multi-fruit overlap, and branch-and-leaf screening.
Mounting portable, low-power, physically compact edge processing units in outdoor environments with constrained resources has attracted substantial research interest over recent years. Nonetheless, striking a workable compromise that preserves model detection strength while shrinking the footprint to a level compatible with installation on intelligent citrus harvesters remains an unresolved bottleneck. The single-stage You Only Look Once (YOLO) detection paradigm [18] combines a series of efficient architectures that localize and classify objects in a single unified forward pass, yielding response speeds suitable for real-time applications. Compared with traditional machine vision processing chains, the YOLO family imposes markedly lower computational loads, largely because it dispenses entirely with laborious hand-engineered feature extraction and downstream post-processing [19]. Furthermore, the core design principles of the YOLO lineage deliberately prioritize model parsimony. By selecting structurally simple but strategically effective network components and training recipes—for example, expanding the stride parameters inside convolutional layers and exploiting multi-resolution feature representations—YOLO models dramatically curtail both parameter counts and arithmetic complexity while upholding competitive detection output, thus rendering them naturally amenable to operation on edge-class hardware [20]. It follows, then, that developing a resource-frugal model rooted in the YOLO tradition and targeting edge deployment has emerged as a highly appealing pathway.
To achieve trustworthy Orah fruit detection in the demanding visual environment of actual orchards, this contribution presents a compact, optimized version of YOLOv8n (You Only Look Once, version 8n) specifically configured for operation on edge computing units tasked with identifying Orah fruits. The precise objectives driving this work can be enumerated as follows: 1) to assemble a high-precision yet lightweight refined YOLOv8n model capable of picking out Orah fruits within intricate orchard backdrops; 2) to place the detection performance of this refined model alongside that of other prominent lightweight competitors in a comparative evaluation; 3) to transfer the optimized YOLOv8n model onto an edge device and subsequently assess both its detection correctness and its inference throughput.
The present investigation commences with a granular explanation of the steps followed to compile the Orah fruit image dataset. It then provides an exposition of the modifications introduced into the YOLOv8n framework, emphasizing the nature of each modification and its effect on detection capability. The narrative subsequently turns to the conceptualization and realization of an Orah fruit detection system interface built atop an edge computing platform. Following this, the study proceeds to detail the deployment procedure and the resultant test metrics gathered from the edge device. A high-level depiction of the complete research workflow appears in Figure 1.
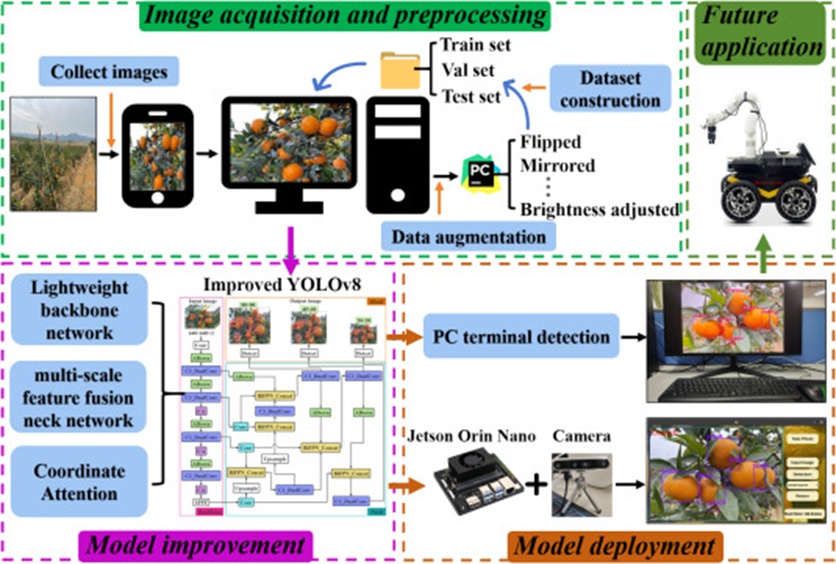
Figure 1. The overall research route.
This research used two consumer smartphones for image acquisition: the iPhone 12 Pro Max and the Huawei Honor 10. Picture-taking was timed so that Orah fruits had reached the standard harvest maturity window (as indicated by over 80% of the peel area having transitioned to shades of orange-yellow or orange-red) [21]. Fieldwork was performed at a commercial Orah fruit plantation in Wuming District, Nanning City, Guangxi Province, China, on December 30, 2022. Photographs were gathered at several points throughout the day and from a variety of camera orientations, maintaining an approximate subject distance of 0.4-1.0 m. In sum, the collection effort yielded 844 raw images that span a range of realistically challenging conditions—including directional light shifts, fruit bodies overlapping one another, and visual obstruction by branches and foliage—as illustrated in Figure 2. Out of this pool, the iPhone 12 Pro Max contributed 512 frames at 4032 × 3024 pixel resolution, and the Huawei Honor 10 supplied 332 frames at 4608 × 3456 pixels. All imagery was archived using the .jpg file format. To inject further environmental diversity and to guard against the risk of model overfitting, the original field imagery was subjected to a randomized sequence of digital augmentation operations—specifically flipping, mirror reflection, rotation, synthetic noise addition, and brightness modulation—applied through the PyCharm software environment (Figure 3). Augmentation expanded the dataset to a final count of 3376 images.
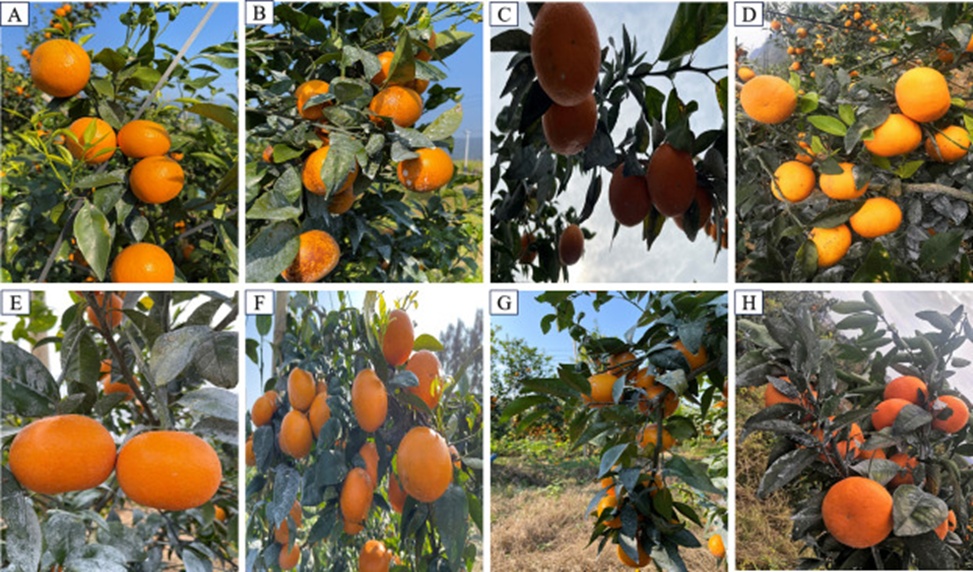
Figure 2. Images of Orah fruits in complex orchard environments: A) Straight sunlight, B) Side light, C) Back light, D) Cloudy, E) Slight occlusion, F) Fruit overlapping, G) Branch-leaf occlusion, and H) Fruit overlapping and branch-leaf occlusion.
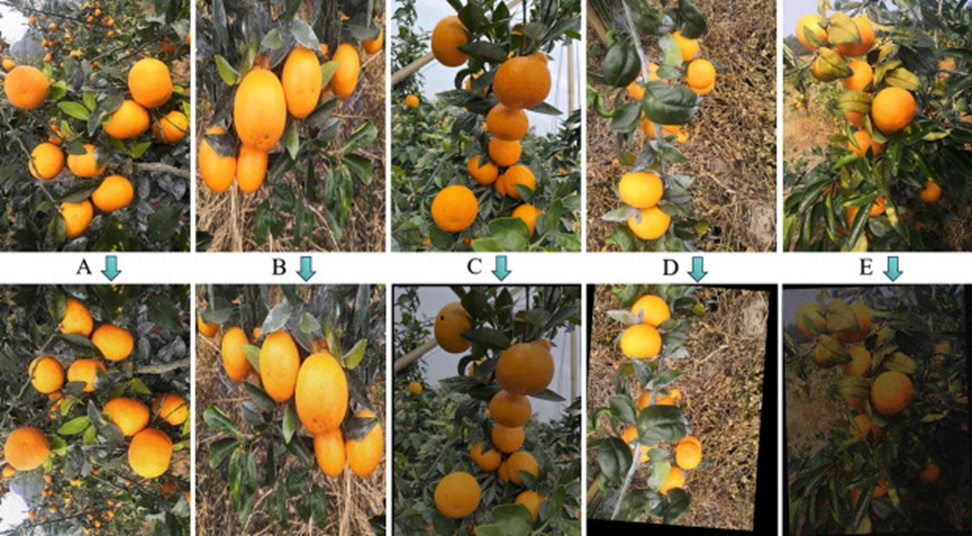
Figure 3. Images of complex scenes after data augmentation: A) Flipped, B) Mirrored, C) Noise added, D) Flipped and rotated, and E) Rotated, noise added, and brightness adjusted.
This study structured its training pipeline around the Pattern Analysis, Statistical Modeling, and Computational Learning (PASCAL VOC) data format standard. Target fruit instances visible in the collected images were hand-labeled with rectangular bounding boxes by operators using the LabelImg graphical annotation tool. Mindful of the practical scenario of robotic Orah fruit picking, the labeling protocol directed annotators to enclose exclusively those fruits clearly presented in frontal view; specimens receding into the far background or suffering from pronounced blur were intentionally left unlabeled. Finished annotations were serialized into “xml” metadata files that captured details including the corresponding fruit image filename, the four-corner pixel coordinates bounding each labeled area, and the designated object class. Cognizant of the need for labels to remain tightly coupled with their associated image data and desiring a uniform data split, the PyCharm software program was used to randomly shuffle and partition the full dataset into training, validation, and test sets with 70%, 15%, and 15% distributions, respectively. As a result of this division, the training partition encloses 2363 images populated with 12,117 annotated bounding box instances; the validation partition enfolds 506 images containing 2711 annotated bounding box instances; and the test partition accommodates 507 images alongside 3641 annotated bounding box instances.
YOLOv8 [22] is widely recognized as a leading-edge real-time object detector, known equally for its high accuracy, rapid execution speed, and resource efficiency. The architecture has been widely exploited to discern numerous agricultural targets, including citrus [23], grape clusters, cabbage heads [24], and rice plants [25]. In its nano configuration, YOLOv8n delivers an especially low memory and computational footprint, qualities that make it an attractive candidate for embedding in edge-located inference hardware [26]. Motivated by the twin goals of realizing a lightweight deployment profile and enabling real-time Orah fruit perception on edge devices, YOLOv8n was adopted as the foundational reference model. Its internal structural organization is illustrated in Figure 4.
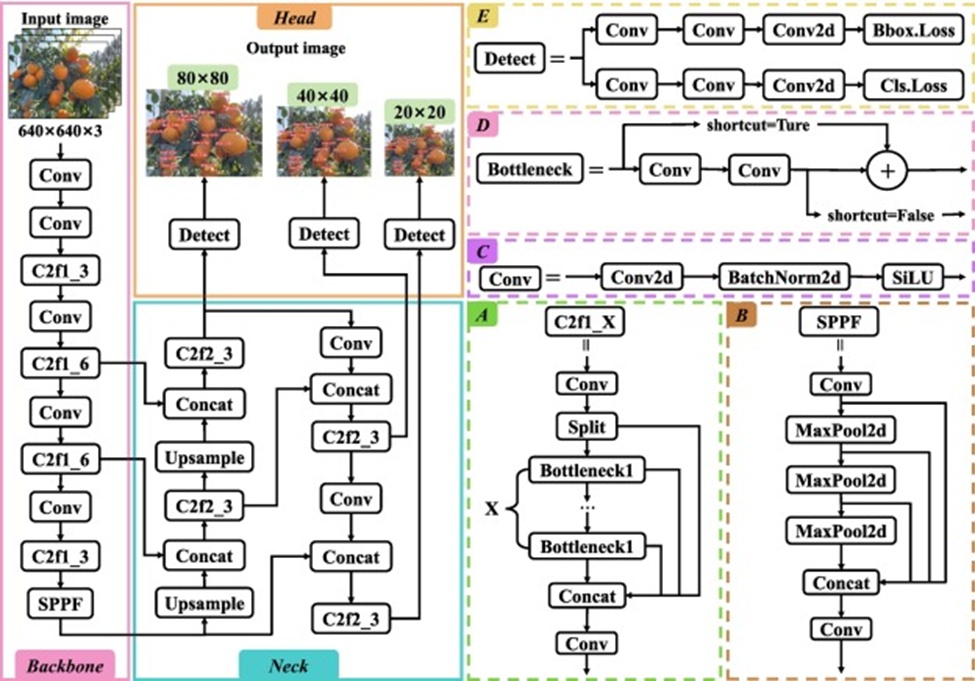
Figure 4. Architecture of the YOLOv8n model: A) C2f1_X cross-stage partial convolution block, B) Fast spatial pyramid pooling module, C) Classic convolutional module, D) Bottleneck module, and E) Detection head.
Functionally, the YOLOv8n network can be decomposed into four essential stages: the input module, the backbone feature extractor, the neck aggregator, and the output head. Within the input module, incoming image frames first undergo conditioning treatments—most notably, rescaling to a fixed size (640 × 640 pixels by default) and intensity normalization. The backbone section implements the CSPDarknet53 [19] structure and is tasked with distilling salient visual features from the input; it is assembled principally from classic Convolutional modules (Conv) (Figure 4C), Cross Stage Partial convolution blocks (C2f) (Figure 4A) [22], and a Fast Spatial Pyramid Pooling unit (SPPF) (Figure 4B) [27]. The SPPF unit operates by executing a cascade of three successive max-pooling passes, then merging their outputs, thereby endowing the network with the ability to learn features spanning multiple spatial resolutions. The neck segment orchestrates feature refinement via the Path Aggregation Network (PANet) [28], while the detection head (Figure 4E) serves as the terminal stage that produces final predictions: estimated bounding box coordinates, object class assignments, and accompanying confidence scores.
Aiming to improve detection quality while streamlining eventual deployment, this section details the series of refinements applied to the baseline YOLOv8n architecture. As a first step, selected Conv modules distributed across the backbone and neck subnetworks were substituted with parameter-efficient ADown down-sampling units. This exchange compressed the model’s storage profile without degrading its object localization accuracy. Moving forward, the network’s sensitivity to Orah fruit cues, partially masked by overhanging branches and a dense canopy, was strengthened—while further reducing model dimensions—by incorporating a Concentrated-Comprehensive Dual Convolution module (C3_DualConv) that merges twin dual-convolution bottleneck pathways. The C3_DualConv block demonstrated a strong aptitude for teasing out fine-detail features and merging broader contextual signals from incoming feature maps. It systematically replaced every C2f block previously used in the YOLOv8n model. In a further alteration to the neck subnetwork, this investigation moved away from the default PANet and instead installed a Bidirectional Feature Pyramid Network (BiFPN) [29] to enable richer multi-scale feature harvesting and blending. This complementary information flow spanning multiple hierarchical levels equipped the model to maintain high Orah fruit recognition rates even under challenging, variable natural lighting.
Given that Orah fruits naturally occur in tight aggregations with frequent fruit-on-fruit crowding and visual obstruction by twigs and foliage, measures were needed to upgrade the model’s precision in pinpointing fruit locations and distinguishing fruit-specific characteristics. For this purpose, a Coordinate Attention (CA) [30] mechanism module was appended directly after the C3_DualConv block at each of three differently scaled feature extraction layers—specifically, Pyramid Level 3, Pyramid Level 4, and Pyramid Level 5 (P3, P4, P5)—contained within the backbone. In a culminating optimization step, the training objective was reformulated as a joint loss that marries the More Focused Intersection over Union Loss (Focaler-IoU) [17] with the Minimum Points Distance Intersection over Union Loss (MPDIoU) [31]. This combination sped up model convergence while tightening bounding box regression. The structural diagram of the resulting improved YOLOv8n model is provided in Figure 5.
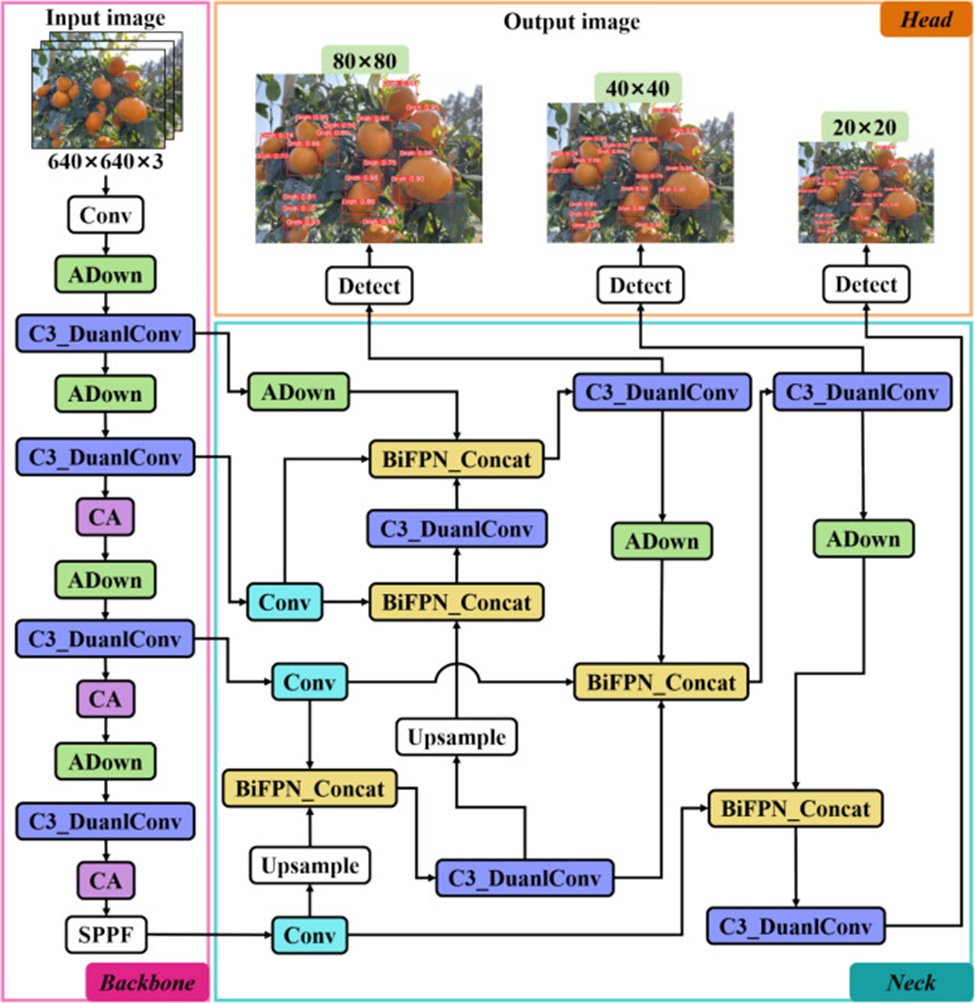
Figure 5. Architecture of the improved YOLOv8n model (colored parts indicate the modified modules).
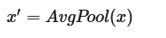
Relying on a lone convolution pass as performed in the standard Conv module tends to let subtle yet informative details slip away during resolution reduction. While compact architectures such as MobileNet [32], ShuffleNet [33], and GhostNet [34] curb arithmetic demands through strategies like depth-wise separable convolutions and channel group convolutions, this parsimony sometimes comes at the expense of detection precision. Seeking to trim model girth without sacrificing performance, the present study integrated ADown modules into both the backbone and the neck. Within an object detection pipeline, the ADown unit performs efficient downsampling and feature amalgamation by splitting into two concurrent branches: a max-pooling branch and a convolutional branch. The max-pooling arm contracts the spatial map size while preserving the strongest activations, whereas the convolutional arm conserves fine-grained original signals and extracts semantically higher-level descriptors; these two output streams are subsequently fused through channel-wise concatenation. The full sequence of operations carried out by the ADown module is formalized in Eqs. 1-4:
 (1)
(1)
 (2)
(2)
 (3)
(3)
 (4)
(4)
Where x is the input feature map, and x′ is the map obtained after x undergoes average pooling. x1 and x2 denote the two partitions created by splitting x′. Conv corresponds to the convolution operation, stride specifies the convolutional stride, pad specifies padding, and concat represents the channel-dimension concatenation step. The final output tensor is written as y.
The internal architecture of the ADown module is sketched in Figure 6.
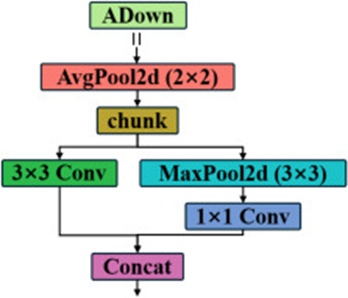
Figure 6. Structure diagram of the ADown module.
To become adept at picking up on the subtle textural patterns and edge outlines belonging to Orah fruits that are partly concealed behind leaves and branches, the model must be equipped with a stronger mechanism for absorbing local spatial detail. Concurrently, the push toward lightweight edge deployment and real-time responsiveness compels the adoption of a leaner network structure. In response, this investigation turned to Dual Convolution (DualConv) [35] as the foundation for crafting a Bottleneck_DC building block. This block was then embedded into the Concentrated Comprehensive Convolution (C3) module [36], inherited from the YOLOv5 lineage, where Bottleneck_DC replaced the original Bottleneck via class inheritance and served as the primary gradient-propagation branch. Every Bottleneck_DC instance contained a Conv unit and a DualConv unit, with residual shortcuts to prevent gradient decay. Within the DualConv unit, 3 × 3 kernels were used to gather spatially rich context, and 1 × 1 kernels were used to consolidate feature channels without substantially increasing the number of parameters or computation. This paired convolutional strategy effectively revealed additional local spatial content and improved the model’s performance on fine-grained discrimination tasks, ultimately strengthening its ability to detect occluded objects. The configuration of the C3_DualConv module is rendered in Figure 7.
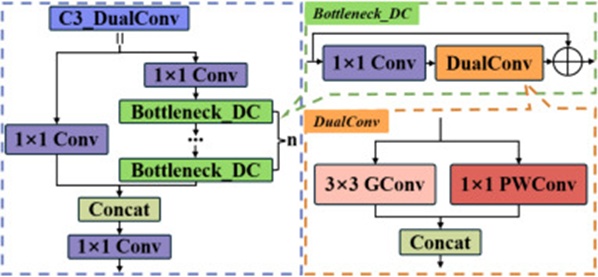
Figure 7. Structure diagram of the C3_DualConv module.
Aggregating features drawn from multiple resolution levels is widely viewed as an effective strategy for producing richer representations. Earlier research has leaned heavily on multi-scale fusion schemes such as Feature Pyramid Network (FPN) [37] and PANet. A weakness of these earlier solutions is that they often do not adequately account for the inherent dissimilarities among features sourced from distinct resolutions at the time of fusion, leading to an uneven contribution mix in the merged output. The BiFPN design tackles this shortcoming by attaching learnable importance weights and structuring the fusion process along a bidirectional pathway that flows both top-down and bottom-up. The baseline BiFPN blueprint is shown in Figure 8A. Aware of the multifaceted challenges posed by orchard environments—chiefly, inconsistent illumination and pervasive occlusion—this work augmented the BiFPN topology by incorporating the P2 high-resolution feature layer. Fusing features across this expanded scale spectrum improved the model’s robustness and output consistency when interpreting objects of varying dimensions and under shifting lighting conditions, thereby reducing both omission errors and spurious detections. The upgraded BiFPN arrangement is shown in Figure 8B.
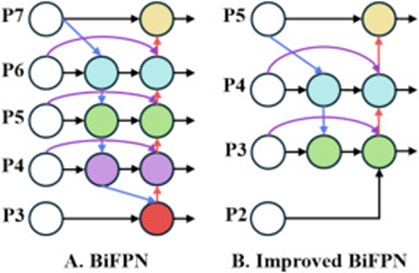
Figure 8. The BiFPN multi-scale feature fusion network: A) Original BiFPN network, which utilized bidirectional information flow to merge multi-scale features from layers P3 to P7, and B) Improved BiFPN network, which incorporated the P2 high-resolution feature layer.
Expanding the receptive field allows the model to form stronger feature associations spanning disparate scales and image regions, thereby bolstering the global coherence of the learned representations. This attribute becomes especially critical when contending with overlapping targets: the model must disentangle the spatial arrangement and boundary information linking adjacent objects. By drawing on pixel information from a wider neighborhood, the model can trace each target’s outline with greater fidelity, measurably reducing ambiguity within overlapping regions. The CA attention mechanism encodes positional coordinate data within the channel attention pathway, effectively broadening the global receptive field accessible to lightweight mobile-style networks. This design facilitates efficient modeling of long-range dependencies, thereby reinforcing the representational capacity of convolutional backbones. A step-by-step depiction of the process is shown in Figure 9. Starting with the input feature map, two independent one-dimensional global average pooling operations are applied to condense features along the vertical and horizontal axes, producing a pair of feature descriptors with directional awareness. These direction-enriched descriptors are next transformed into a corresponding pair of attention maps, each encoding long-range spatial dependencies along one of the two axes. The derived attention maps are subsequently multiplied back onto the original input feature map to weight its contents, enabling more faithful detection of the relevant objects.
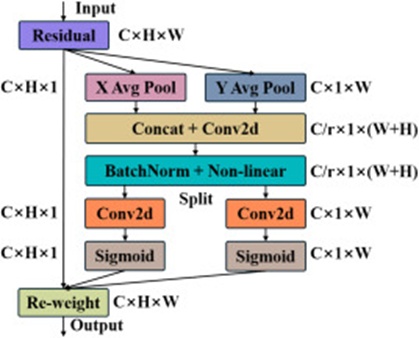
Figure 9. Structure of the CA attention mechanism module. C represents the number of image channels, H is the image height, W is the image width, and r is the down-sampling reduction rate. X Avg Pool denotes horizontal average pooling, and Y Avg Pool denotes vertical average pooling. Non-linear refers to a non-linear activation function, Sigmoid to the activation function, and Re-weight to weight retrieval.
In its default configuration, YOLOv8 employs the Complete-IOU (CIoU) [38] regression loss, which simultaneously considers the overlapping region, the separation between box centers, and the mismatch in aspect ratios between predicted and ground-truth boxes. However, under circumstances where the predicted and ground-truth boxes happen to share the same aspect ratio but diverge in physical dimensions or spatial placement, the additional terms involving center distance and aspect ratio become uninformative, and CIoU collapses down to the simpler Intersection over Union (IoU) [39] metric. To address this weakness, the present study adopted the More Focused Minimum Point Distance Intersection over Union joint loss function (Focaler-MPDIoU) as the replacement objective. The Focal-IoU component was introduced to counteract CIoU’s limited generalizability in complex detection scenes by incorporating adjustable weighting coefficients. This permits the training process to assign differential emphasis to predicted boxes depending on their IoU scores, with low-IoU boxes receiving steeper penalties so that challenging-to-detect instances exert less distortion on the overall loss landscape. Focaler-IoU relies on a linear interval mapping technique to reshape and enhance the standard IoU loss for bounding box regression, as formulated in Eq. 5:
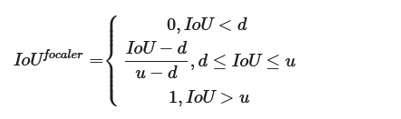 (5)
(5)
Where IoUfocaler stands for the reconstructed Focaler-IoU, and IoU represents the unmodified IoU score. The parameters d and u specify predefined lower and upper bounds, respectively, with [d, u] ∈ [0, 1]. By altering the values of d and u, IoUfocaler can be directed to concentrate on different subsets of regression samples. Its associated loss is defined as shown in Eq. 6:
 (6)
(6)
The MPDIoU metric integrates all relevant factors from existing loss formulations—specifically, the degree of overlap, the displacement between box centers, and discrepancies in width and height—to provide a tighter loss signal by straightforwardly shrinking the distance between corresponding key points on the predicted and true boxes. The MPDIoU calculation proceeds as specified in Eq. 7:
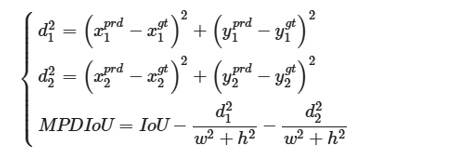 (7)
(7)
Where ( , ), ( , ) denote the top-left and bottom-right corner coordinates of the predicted box, respectively; ( , ),( , ) denote the top-left and bottom-right corner coordinates of the ground-truth box, respectively; and w and h denote the width and height of the input image. The loss formulation built upon MPDIoU is provided in Eq. 8:
 (8)
(8)
The components of LMPDIoU are illustrated in Figure 10.
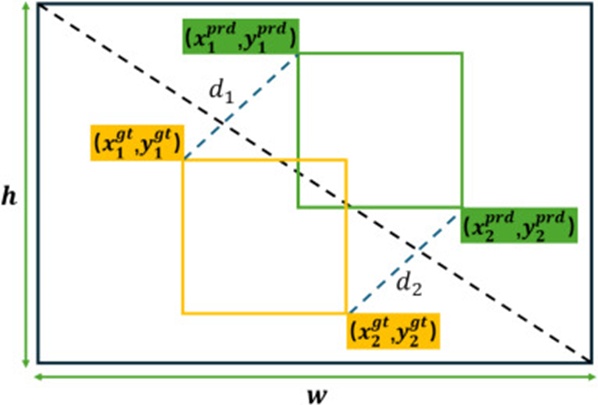
Figure 10. Depicts the elements of LMPDIoU.
Ultimately, by nesting the Focaler-IoU loss expression within the MPDIoU loss framework, the unified Focaler-MPDIoU loss can be written as Eq. 9:
 (9)
(9)
The Focaler−MPDIoU formulation can moderate the contribution of training samples spanning a spectrum of difficulty by tuning the emphasis placed on different IoU intervals, while simultaneously refining the geometric alignment between predicted outputs and ground-truth boxes.
A practical test of whether the refined YOLOv8n architecture could function on resource-constrained hardware was conducted by transferring the model onto an Nvidia Jetson Orin Nano developer kit, whose silicon draws from the NVIDIA Pascal GPU lineage. Specifications of the chosen edge platform are as follows: an ARM A78 processor with 6 physical cores, a CUDA-capable graphics processor with 1024 shader cores, 8 gigabytes of working memory, and a Low-Power Double Data Rate 5 (LPDDR5) interface with a 128-bit bus width. Image frames streamed into the system during live inference originated from a RealSense D455 industrial-grade camera unit. A complete enumeration of the runtime environment configured atop the Nvidia Jetson Orin Nano is provided in Table 1.
Table 1. The specific operating environment.
Configuration | Version |
System | Ubuntu 20.04 |
CUDA | 11.4 |
CUDNN | 8.6.0 |
Jetpack | 5.1.2 |
TensorRT | 8.5.2 |
A dedicated software tool for Orah fruit perception was built on the Python Qt 5 (PyQt5) toolkit, supporting two distinct workflows: one driven by a continuous camera feed and the other operating on individual static images. The arrangement of interface components is rendered in Figure 11. From the entry screen (Figure 11A), two operational mode buttons permit the operator to switch between the live-stream detection pipeline and the image-file detection pipeline. Upon entering the live detection screen (Figure 11B), clicking the “Start” control launches the attached camera and initiates uninterrupted Orah fruit recognition. This view dynamically refreshes readings of current inference throughput and the running count of identified fruit, while a drop-down menu enables selection of different model backends. The static image analysis screen (Figure 11C) accepts input through two channels: capturing a photograph on demand or browsing for an existing image file. After selecting the target detection model from the drop-down list, the operator initiates processing by pressing the “Detection” control; the interface then reports both the number of Orah fruits recognized and the elapsed detection time. Internally, the application packages three model variants: the stock YOLOv8n, the custom-enhanced YOLOv8n, and the custom-enhanced YOLOv8n further optimized through TensorRT Python Application Programming Interface (API) inference. The pull-down list labels these entries as “YOLOv8n,” “YOLOv8n-improve,” and “YOLOv8n-improve-engine-py,” respectively.
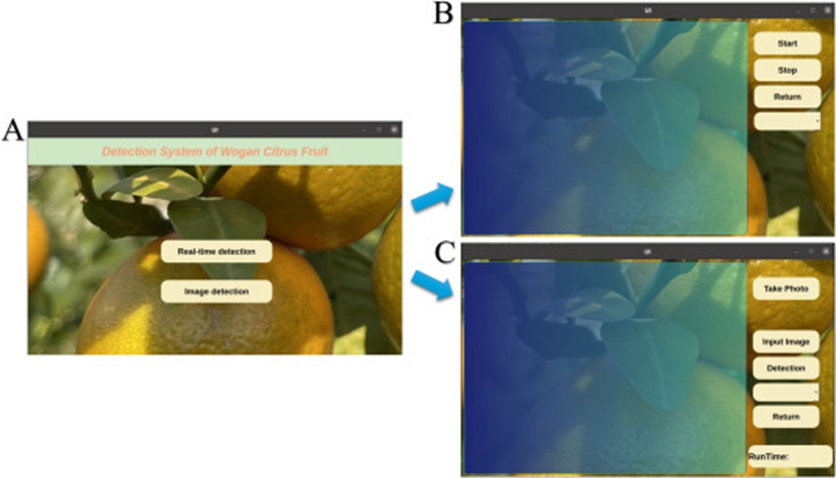
Figure 11. Interface layout of the Orah fruit detection system: A) Main interface, B) Real-time detection mode interface, and C) Single-image detection mode interface.
All training experiments were executed on a workstation equipped with an Intel i5-13600KF central processor and an NVIDIA RTX 4090 discrete graphics adapter with 24 gigabytes of onboard video memory. The software environment consisted of Microsoft Windows 10 64-bit, Python 3.9, PyTorch 2.2.2, and CUDA 12.1. Every input frame was standardized to a spatial resolution of 640 × 640 pixels, with 16 samples per mini-batch. The data loading pipeline was configured to spawn 8 worker threads. Optimization of network parameters was handled by the SGD routine, with the learning rate initialized at 0.01 and held constant throughout. The weight decay multiplier is set to 0.0005. The training schedule spanned 300 epochs, after which the stored parameter snapshot delivering peak performance was used for all subsequent benchmarking.
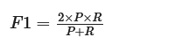
Multiple quantitative criteria were adopted to characterize detection capability: Precision (P), Recall (R), Average Precision computed at a 0.5 IoU cutoff ([email protected]), total trainable parameters (Parameters), Floating Point Operations (FLOPs), disk storage occupied (Size), processing rate expressed in frames per second (FPS), and the harmonic F1 Score (F1). The computational formulas governing these metrics appear in Eqs. 10-17:
 (10)
(10)
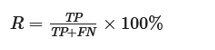 (11)
(11)
Where TP designates the count of samples correctly classified as Orah fruit, FP the count incorrectly classified as Orah fruit, and FN the count of Orah fruit samples that went undetected.
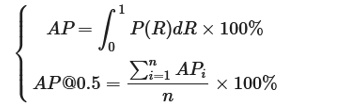 (12)
(12)
Where Average Precision (AP) is defined by the integral under the P-R curve, and n indicates the total number of object classes; because only a single variety—Orah fruit—is under study, n assumes a value of 1.
 (13)
(13)
 (14)
(14)
 (15)
(15)
 (16)
(16)
 (17)
(17)
Where Cin and Cout denote the respective channel dimensionalities of input and output feature maps, K corresponds to the side length of the square convolution kernel, nin and nout refer to the nodal counts at the input and output layers, H×W captures the spatial extent (height times width) of the output feature map, S is the step size of the convolution, Tpreprocess measures the time needed to prepare one image before inference, Tinference is the duration the network spends computing a forward pass for one image, and Tpostprocess accounts for the wall-clock time consumed by post-inference processing steps.
To disentangle and measure the effect of each design alteration on the final enhanced YOLOv8n model, progressive ablation trials were conducted, with the resulting measurements organized in Table 2. Examination of the tabulated data reveals that when selected Conv modules populating the backbone and neck sections of the YOLOv8n network were replaced with ADown blocks, the metrics for Parameters, FLOPs, and Model size, respectively, fell to 86.0%, 88.9%, and 87.1% of the baseline measurements. This swap was accompanied by a fractional gain in P coupled with a minor retreat in both R and [email protected]. Extending the modifications to uniformly replace every C2f module with the C3_DualConv design further compressed Parameters, FLOPs, and Size by margins of 31.7%, 27.8%, and 29.6%, respectively. P advanced by 0.4 percentage points, but R regressed to the 94.9% mark. Simultaneous contraction of model bulk, parameter volume, and floating-point operations may undermine the network’s capacity to represent intricate feature patterns, thereby allowing some target instances to escape detection. The subsequent incorporation of the upgraded BiFPN layout added a small amount of overhead to Parameters, FLOPs, and Size. Yet, it restored R to 95.3% and gave P another 0.5 percentage-point boost. These outcomes confirm that BiFPN not only amplifies the fusion of multi-scale representations but also offsets the representational degradation associated with the C3_DualConv module. Thereafter, embedding CA attention mechanisms into the architecture increased R by 0.8 percentage points without affecting P or [email protected], while imposing only a negligible increase in Parameters and Size. In the concluding ablation step, migrating the loss formulation to Focaler-MPDIoU resulted in gains for both P and [email protected], affirming that this joint objective function strengthens the alignment between model predictions and ground-truth annotations and thereby elevates detection precision.
Table 2. Ablation experiments of the improved YOLOv8n model.
Model | Size | FLOPs | Parameters | F1 | R | P | |
X | 6.2 | 8.1 | 3.01 | 96.55 % | 98.7 % | 96.8 % | 96.3 % |
X + ① | 5.4 | 7.2 | 2.59 | 96.25 % | 98.4 % | 96.0% | 96.5 % |
X + ①② | 3.8 | 5.2 | 1.77 | 95.89 % | 98.5 % | 94.9 % | 96.9 % |
X + ①②③ | 4.0 | 5.7 | 1.89 | 96.34 % | 98.6 % | 95.3 % | 97.4 % |
X + ①②③④ | 4.1 | 5.7 | 1.90 | 96.79 % | 98.7 % | 96.1 % | 97.5 % |
X + ①②③④⑤ | 4.1 | 5.7 | 1.90 | 96.69 % | 98.8 % | 95.7 % | 97.7 % |
Note: X is YOLOv8n; ① is ADown; ② is C3_DualConv; ③ is BiFPN; ④ is CA; ⑤ is Focaler-MPDIoU.
Aggregating the insights from the full ablation sequence, the refined YOLOv8n model exhibited the following performance shifts compared to the unaltered YOLOv8n when applied to Orah fruit perception: P climbed by 1.4%, R slipped by 1.1%, [email protected] edged up by 0.1%, Parameters contracted by 36.88%, FLOPs were trimmed by 29.63%, and Size was cut by 33.87%. Seeing as the magnitude of increase in P exceeded the magnitude of decrease in R, the composite F1 score registered a net gain of 0.14%. The downturn in R can, in part, be attributed to the fact that the architectural simplifications and leaner feature-extraction modules, while pursued for compactness, somewhat compromise the model’s competence at identifying Orah fruits under dense occlusion or at the extremes of illumination variation. Given that both Precision and model Size serve as pivotal determinants of harvesting efficacy and throughput in edge-based intelligent robotic picking systems, the assessment is that the enhanced YOLOv8n model delivers a meaningful dual improvement—sharper detection combined with a markedly reduced footprint—when compared with the reference model.
To make the benefits conferred by the modification strategies in the enhanced YOLOv8n model more visually accessible, the Grad-CAM (Class Activation Mapping) visualization technique was applied to generate feature-activation heatmaps across successive ablation configurations.
As conveyed in Figure 12, the original C2f module concentrated the bulk of its activation on fruit in the immediate foreground, devoting markedly less saliency to canopy regions where branches and leaves create partial obscuration. Such behavior tends to translate into unreliable detection of occluded fruit specimens. In marked contrast, the proposed C3_DualConv module distributed its high-activation focus more uniformly and precisely across the entire target area, a property enabled by its richer extraction of local spatial structure. It focused on the fruit’s core regions, reflecting superior robustness under occlusion-prone conditions.
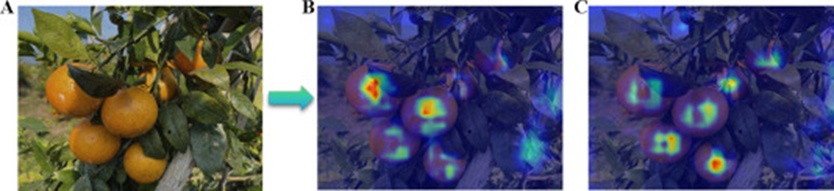
Figure 12. Comparison of heatmaps in introducing a C2f and introducing a C3_DualConv: (A) Input image, (B) Heatmap by introducing C2f, and (C) Heatmap by introducing C3_DualConv. Red areas indicate regions of close attention by the model, and yellow areas represent regions of moderate attention. Blue areas signify regions of low attention, and the same applies in Figures 13 and 14 (For interpretation of the references to color in this figure legend, the reader is referred to the web version of this article).
The evidence depicted in Figure 13 demonstrates that, once BiFPN was introduced into the architecture, the resulting activation heatmaps showed strongly emphasized regions covering a substantially larger number of fruit instances in difficult environmental contexts. These empirical observations indicate that the added BiFPN module successfully directs the model’s focus toward a broader set of targets and provides increased robustness in areas affected by cast shadows.
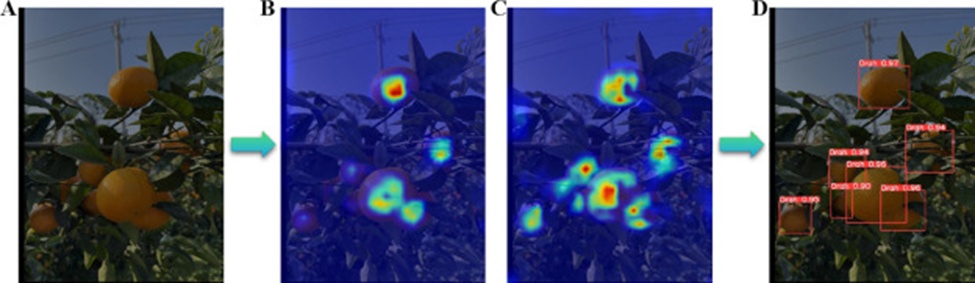
Figure 13. Comparison of medium-scale feature layer heatmaps in the neck before and after adding BiFPN: (A) Input image, (B) The heatmap resulting from adding BiFPN, (C) The heatmap resulting from adding BiFPN, and (D) Output image.
Early-stage features processed by convolutional neural networks are predominantly tasked with detecting elementary visual cues—edges, chromatic patterns, and textural motifs—which collectively scaffold the holistic scene understanding constructed by deeper layers of the hierarchy. Figure 14 presents a side-by-side comparison of shallow-feature heatmaps before and after activation of the CA attention module. The CA-augmented version yielded heatmaps with more compact clusters of high-intensity hotspots and crisper delineation of boundary details within regions of interest, resulting in stronger detection of multiple overlapping targets. Furthermore, the expansive receptive field characteristic of the CA attention mechanism promotes a more evenly distributed allocation of high-response zones, enhancing responsiveness to informative features while curbing excessive or spurious activation.
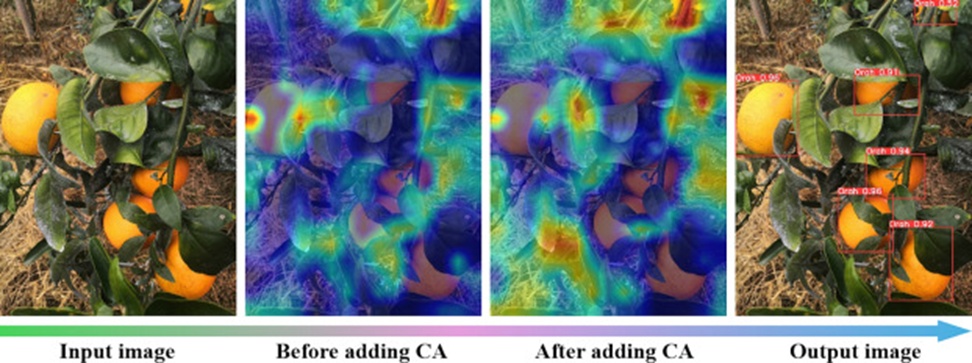
Figure 14. Heatmaps before and after adding CA.
A set of trials was conducted to examine the effect of the attention mechanism type on the quality of the detection pipeline’s output. Into a fixed location within the already-enhanced YOLOv8n architecture, an equal quantity of five distinct attention formulations was inserted: CA, Squeeze-and-Excitation Attention (SE) [40], Convolutional Block Attention Module (CBAM) [41], Expectation-Maximization Attention (EMA) [42], and Simple, Parameter-free Attention (SimAM) [43]. What emerged from these runs is documented in Table 3. One consistent pattern was that every attention variant pulled recall downward — the reductions ranged from 1.14% to 0.72%. Yet despite shouldering the largest recall penalty, the CA-equipped variant achieved precision of 97.7%, a figure that clears SE by 1 full percentage point, tops CBAM by 0.7 points, surpasses EMA by 1.3 points, and exceeds SimAM by 0.9 points. Another distinction favoring CA: it was the only module that lifted [email protected] by 0.1%, whereas each of the other four dragged that indicator downward. Across all five variants, the parameter budgets, floating-point operation counts, and storage requirements were essentially indistinguishable. When the full picture is considered, CA produced a marginal F1 gain that fell just 0.01% short of SE’s top mark. These patterns collectively suggest that embedding the CA attention module into the backbone network materially improves the model’s stability and resilience when operating amid the visual clutter of real orchard scenes, culminating in Orah fruit detections that are more consistently on target.
Table 3. Quantitative results of the impact of different attention mechanisms on model detection performance.
Model | Number | Size | FLOPs | Parameters | F1 | R | P | |
X + CA | 3 | 4.1 | 5.7 | 1.90 | 96.69 % | 98.8 % | 95.7 % | 97.7 % |
X + SE | 3 | 4.0 | 5.7 | 1.89 | 96.70 % | 98.6 % | 96.7 % | 96.7 % |
X + CBAM | 3 | 4.2 | 5.8 | 1.98 | 96.55 % | 98.6 % | 96.1 % | 97.0% |
X + EMA | 3 | 4.1 | 5.7 | 1.89 | 96.30 % | 98.5 % | 96.2 % | 96.4 % |
X + SimAM | 3 | 4.0 | 5.7 | 1.89 | 96.45 % | 98.5 % | 96.1 % | 96.8 % |
Note: X is the YOLOv8n + ADown+C3_DualConv+BiFPN+Focaler-MPDIoU.
The YOLOv8 framework shipped with CIoU as its bounding-box regressor, and throughout network optimization, it proved quite effective. That said, a blind spot exists: whenever the estimated box and the reference box share identical aspect ratios but are mismatched in spatial extent or placement, the auxiliary cues that CIoU encodes lose their utility, and its behavior becomes indistinguishable from a vanilla IoU computation. Motivated by the question of whether additional performance could be squeezed from the refined YOLOv8n by revisiting the training objective, the present work evaluated convergence behavior under a palette of alternative formulations — specifically CIoU, Efficient-IOU (EIoU) [35], MPDIoU, Stronger-IOU (SIoU) [44], and Generalized-IoU (GIoU) [45] — and the findings are collated in Table 4. Holding model Parameters, FLOPs, and Size equal across the board, the Focaler-MPDIoU pairing rose to the top in overall detection capability, achieving an [email protected] of 98.8%. It must be noted that X + Focaler-MPDIoU (Table 4) trailed X + EIoU by 0.1% on the [email protected] metric — the latter having hit 97.8% — yet on F1, the Focaler-MPDIoU configuration registered 96.58%, outperforming the X + EIoU combination by 0.11 points. Of particular interest is the observation that migrating from the baseline X + CIoU to Focaler-MPDIoU cost 0.1% in F1 while earning back 0.2% in P and 0.1% in [email protected].
Table 4. Comparison of different loss function models.
Model+Loss | Size | FLOPs | Parameters | F1 | R | P | |
X + CIoU | 4.1 | 5.7 | 1.90 | 96.79 % | 98.7 % | 96.1 % | 97.5 % |
X + EIoU | 4.1 | 5.7 | 1.90 | 96.58 % | 98.6 % | 95.4 % | 97.8 % |
X + MPDIoU | 4.1 | 5.7 | 1.90 | 96.45 % | 98.7 % | 96 % | 96.9 % |
X + GIoU | 4.1 | 5.7 | 1.90 | 96.55 % | 98.7 % | 96.4 % | 96.7 % |
X + SIoU | 4.1 | 5.7 | 1.90 | 96.59 % | 98.8 % | 95.7 % | 97.5 % |
X + Focaler-CIoU | 4.1 | 5.7 | 1.90 | 96.65 % | 98.6 % | 96.5 % | 96.8 % |
X + Focaler-EIoU | 4.1 | 5.7 | 1.90 | 96.50 % | 98.6 % | 96.8 % | 96.2 % |
X + Focaler-MPDIoU | 4.1 | 5.7 | 1.90 | 96.69 % | 98.8 % | 95.7 % | 97.7 % |
Note: X is YOLOv8n + ADown + C3_DualConv + BiFPN + CA.
Figure 15 displays how the validation loss unfolded over the course of training. The empirical evidence shows that the X+Focaler-MPDIoU variant converges in fewer updates and maintains a lower loss plateau throughout, particularly compared to X+CIoU. This acceleration may partly owe to the higher cost imposed on boundary-case examples, which drives the aggregate loss term downward more aggressively. The same pattern — swifter stabilization and a deeper loss basin — held when Focaler-MPDIoU was measured alongside the other candidate objectives. Assembling the entire comparative dataset, the switch to the Focaler-MPDIoU criterion proves an effective lever for compressing loss magnitude and strengthening the model’s competence at flagging Orah fruits.
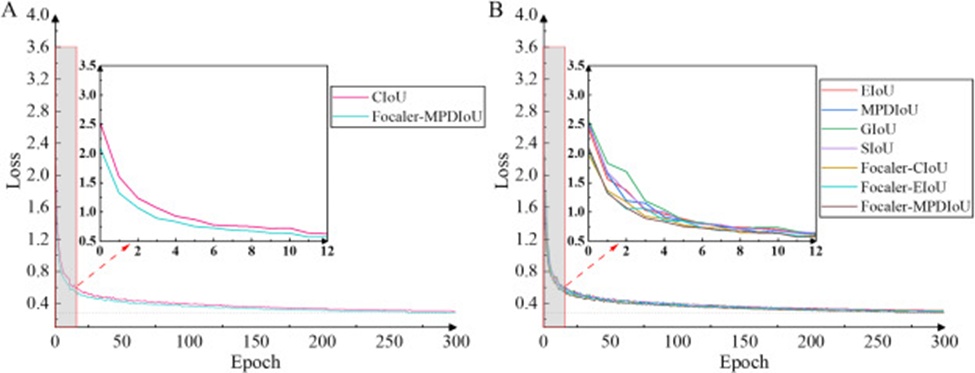
Figure 15. Comparison of loss curves for different loss functions: A) Comparison with the original loss function, and B) Comparison with other loss functions.
Seeking to understand where the refined YOLOv8n model stands within the broader landscape of compact detectors, this investigation benchmarked it head-to-head against a collection of widely adopted lightweight detection architectures. The side-by-side metrics are compiled in Table 5.
Table 5. Comparison of different model performances.
Model | FPS | Size | FLOPs | Parameters | F1 | R | P | |
YOLOv4‑tiny | 250 | 22.4 | 16.5 | 6.06 | 85.35 % | 89.6 % | 79.6 % | 92.0% |
YOLOv5s | 125 | 14.4 | 15.8 | 7.01 | 96.69 % | 98.6 % | 95.8 % | 97.6 % |
YOLOv6n | 232 | 8.7 | 11.8 | 4.23 | 96.25 % | 98.3 % | 95.6 % | 96.9 % |
YOLOv7‑tiny | 141 | 12.3 | 13.0 | 6.01 | 95.49 % | 98.5 % | 94.5 % | 96.5 % |
YOLOv8s | 213 | 22.5 | 28.4 | 11.13 | 97.00 % | 98.5 % | 97.0 % | 97.0% |
YOLOv8n | 232 | 6.2 | 8.1 | 3.01 | 96.55 % | 98.7 % | 96.8 % | 96.3 % |
Ours | 175 | 4.1 | 5.7 | 1.90 | 96.69 % | 98.8 % | 95.7 % | 97.7 % |
Note: The advantageous results are highlighted in bold.
Even a cursory reading of Table 5 reveals that the refined YOLOv8n outstrips every rival on the axes of Parameters, FLOPs, and Size — on the Size dimension alone, it delivers reductions of 81.7% relative to YOLOv4 tiny, 71.53% versus YOLOv5s, 52.87% against YOLOv6n, 66.67% compared to YOLOv7 tiny, 81.78% over YOLOv8s, and 33.87% next to the baseline YOLOv8n. The refined model likewise posts P and [email protected] values that exceed those of all six competitors, with the P edge ranging from 0.1 to 5.7 percentage points. Credit for this can be assigned to the C3_DualConv blocks operating in concert with the upgraded BiFPN topology. This combination markedly deepened the network’s capacity to extract and blend features pertinent to Orah fruit perception. On the R and F1 front, the YOLOv8s variant captured the highest readings at 97% on both counts, placing it ahead of the refined YOLOv8n by narrow gaps of 1.3% and 0.01%, respectively. However, those top scores are packaged inside a model that also claims the largest Parameters, FLOPs, and Size of any architecture in the comparison set. Considering inference latency, YOLOv4 tiny registered the fastest FPS, but also posted the weakest figures across every critical quality metric — P, R, [email protected], and F1 alike. It is worth underlining that the stock YOLOv8n’s processing speed ranks second only to YOLOv4 tiny, and it possesses the smallest Size among the YOLO-family models examined, factors that together motivated its selection as the starting point. The refined YOLOv8n experienced a 22.84% slowdown in inference speed compared to the unaltered YOLOv8n. Yet, this deceleration is defensible in light of the considerably superior trade-off now achieved between aggregate detection quality and storage footprint, and it still clears the bar for real-time operation. The added latency can be traced to the parallel processing pathways inherent to the ADown module and the iterative weight recalibration loop inside the CA mechanism, both of which elevate the computational workload and memory bandwidth consumption.
The refined YOLOv8n also yielded activation heatmaps characterized by even, tightly focused response zones spread consistently across multiple fruit targets within each frame, a property made visible in Figure 16. Placed alongside the other evaluated designs, the refined model proved better at harmonizing the spread of activated features against the intensity of those activations, signaling a more capable multi-object perception faculty.
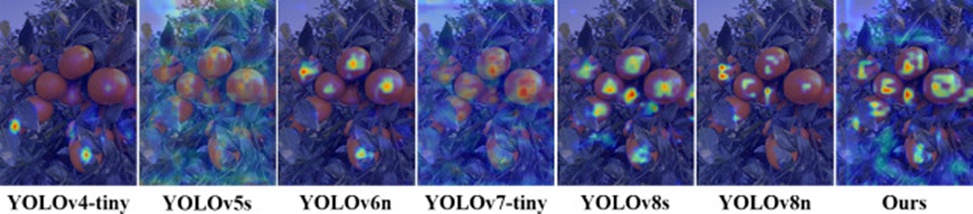
Figure 16. Heatmap visualizations that resulted from different models.
To equip the reader with an at-a-glance visual sense of how detection quality for Orah fruits varies under compounded challenges — fluctuating light, partial obscuration, and fruit clustering — Figures 17 and 18 present detection snapshots from the refined YOLOv8n interleaved with those from the reference architectures. The emphasis in Figure 17 is on frames in which lighting conditions dominate. In most of these illumination scenarios, models correctly localized the plainly visible Orah fruits. One exception emerged under strong backlighting: there, the refined YOLOv8n failed to catch three Orah fruits that YOLOv6n did identify. However, it should be noted that none of the remaining models detected those same three instances either. This shared failure suggests that harsh backlighting may flatten the perceived depth contrast between Orah fruits and the scenery behind them, sapping the detection signal. In every other lighting regime, the competing models sprinkled occasional misses and false positives, whereas the refined YOLOv8n successfully caught every target instance.
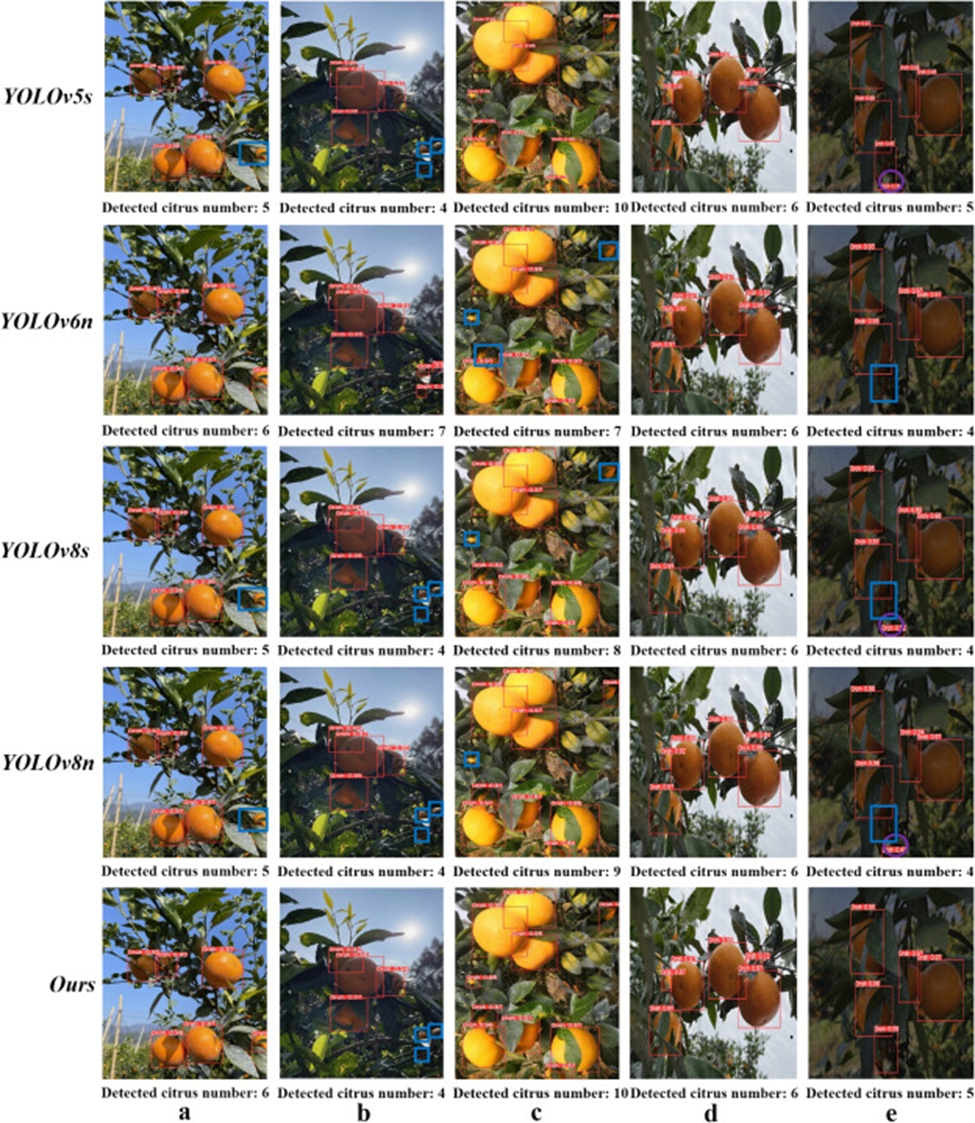
Figure 17. Detection results of Orah fruits dominated by various light conditions: a) Results with straight light, b) Results with back light, c) Results of cloudy with straight light, d) Results of cloudy with back light, and e) Results with darker light. Note: the missed detections are marked with blue squares, while false detections are indicated with purple circles. (For interpretation of the references to color in this figure legend, the reader is referred to the web version of this article.)
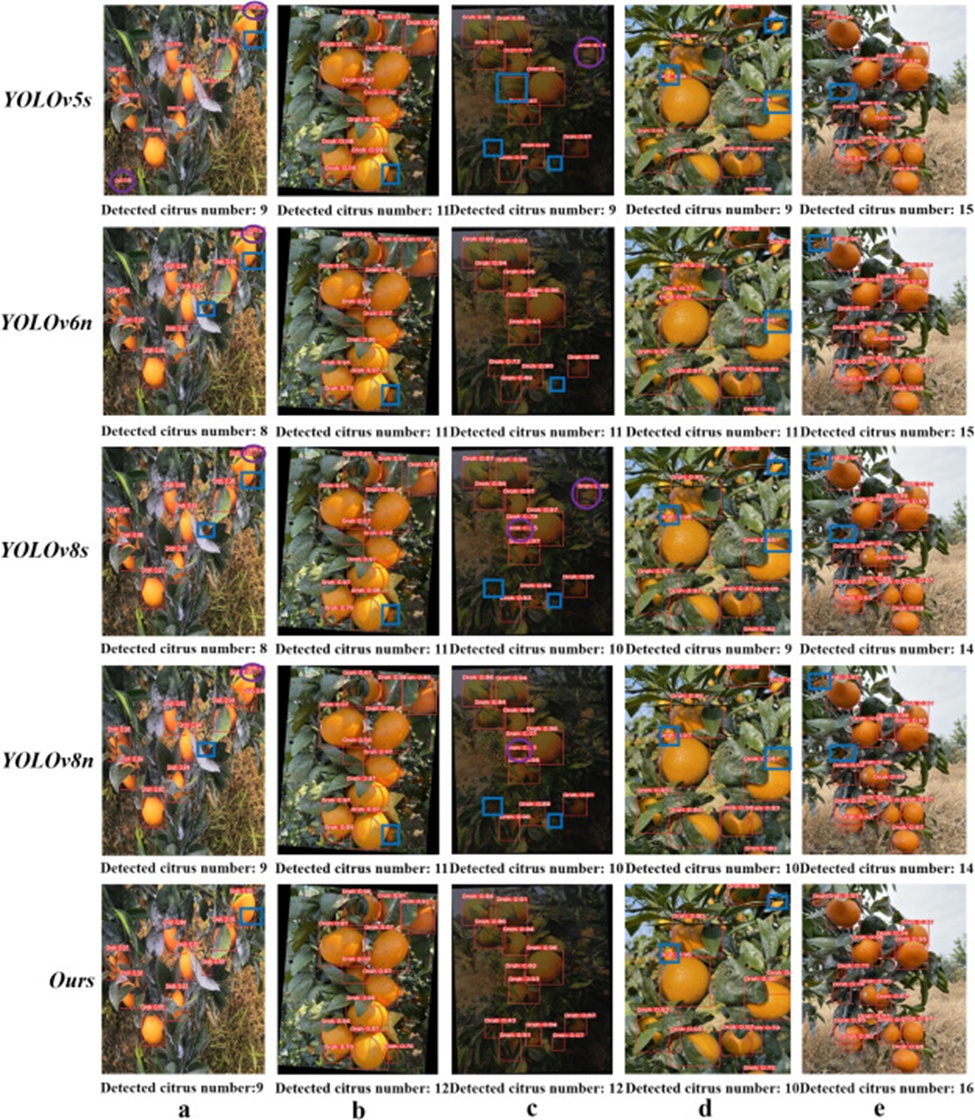
Figure 18. Detection results of Orah fruits affected by single or multiple factors: a) Results of occlusion, b) Results of overlapping, c) Results of darker light with occlusion, d) Results of sunlight with occlusion and overlapping, and e) Results of cloudy with occlusion and overlapping.
The focus of Figure 18 shifts to outcomes recorded under either a single stressor or a layered mix — occlusion operating alone, fruits packed against one another, or dim or harsh lighting superimposed on either of the former. What emerges from these panels is that the refined YOLOv8n performed meaningfully better under conditions combining weak illumination and partial blockage. More generally, the refined YOLOv8n consistently maintained a detection advantage, whereas the benchmark models were prone to erratic missed detections and false classifications. A closer examination of the failure cases pinpoints the predominant source: targets with either a small pixel footprint or blur, whether from motion or poor focus. This diagnostic offers a constructive heading for future rounds of model refinement.
What follows is a direct benchmarking of the outcomes reported in the current study against figures drawn from earlier citrus detection publications, with the comparison rendered graphically in Figure 19. Across the board—on P, R, [email protected], Size, and F1—the enhanced YOLOv8n architecture introduced here posts numbers that eclipse those of preceding contributions. Breaking this down more granularly: relative to the detectors crafted by [15], the P figure achieved in this work climbs by 2.2 and 4.25 percentage points, respectively. The R reading advances by 3.7 percentage points when contrasted with that of [15]. On the specific yardstick of [email protected], the gains land at 4.2 percentage points above [15] and 8.6 percentage points beyond [17]. Assessing F1, the present YOLOv8n formulation outperforms the [13] and Xu et al. networks by 3.00 and 2.69 percentage points, respectively. As for the sheer model bulk, when set alongside the designs from [13], and [17], storage consumed has been pared down by 85.36%, 90.57%, and 61.68%, respectively. The portrait that crystallizes from these numbers is one in which the refined YOLOv8 variant contributed to this work achieves a dual accomplishment: raising the ceiling of detection quality while simultaneously dramatically reducing the model footprint, striking a rare equilibrium between discriminatory power and deployment practicality.
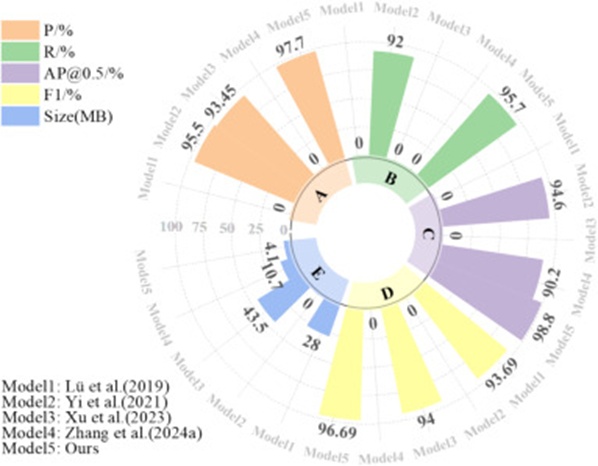
Figure 19. Comparison with the previous research. A indicates the P. B indicates the R. C indicates the [email protected]. D indicates the F1, and E indicates the Size. The “0” value indicates the missing data in the research used for comparison.
A head-to-head latency comparison spanning the base YOLOv8n, the enhanced YOLOv8n, and the deployment-optimized enhanced YOLOv8n, each run across a fixed corpus of fifty photographs, is plotted in Figure 20. The visual tells an unambiguous story: after undergoing deployment optimization, the refined YOLOv8n derivatives registered inference latencies dramatically shorter than those clocked by the baseline YOLOv8n.
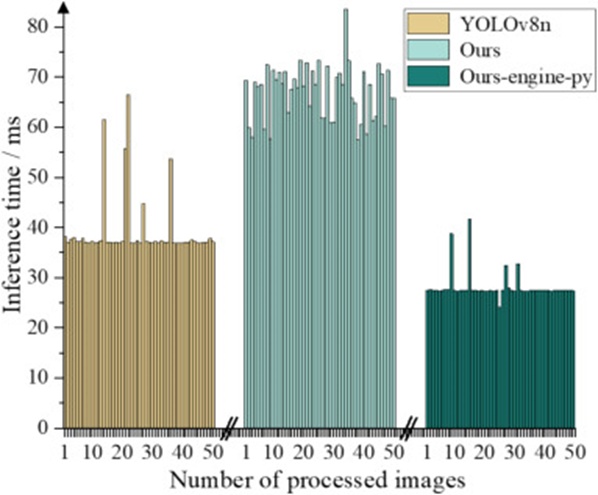
Figure 20. Inference times of various models deployed on the edge device. Note: “YOLOv8n” represents the original model deployment, “ours” represents the improved YOLOv8n model without TensorRT-optimized deployment, and “Ours-engine-py” represents the improved YOLOv8n model with TensorRT-optimized deployment.
The observation that the enhanced YOLOv8n, in its raw form, actually processed frames more slowly than the unmodified YOLOv8n (Table 5) prompted an exploration of the TensorRT Python API to accelerate on-device execution. The workflow proceeded within a Python environment through three sequential stages: first, the learned weight values of the enhanced YOLOv8n were exported into an Open Neural Network Exchange (ONNX) format serving as a portable intermediate artifact; next, this representation underwent serialization into a TensorRT engine; and finally, the engine was loaded from disk and invoked to carry out inference. The performance dividend unlocked by this TensorRT Python API pipeline on the Nvidia Jetson Orin Nano proved substantial. As the measurements in Table 6 document, the optimally deployed enhanced YOLOv8n achieved a mean inference cadence of 35.57 fps, a 58.11 increase over its pre-optimized state. Simultaneously, when this throughput is compared with that of the original YOLOv8n, a 28.09% speed advantage emerges, comfortably meeting the criterion for real-time perception when executed on the Nvidia Jetson Orin Nano.
Table 6. Inference performance of various models deployed on the edge device.
Inference performance | Ours-engine-py | Ours | YOLOv8n |
Average inference time (ms) | 28.11 | 67.12 | 39.10 |
Average inference speed (fps) | 35.57 | 14.90 | 25.58 |
An equally crucial finding is that the TensorRT Python API optimization did not exact any toll on detection fidelity in exchange for its speedup. Figure 21 supplies visual corroboration: under single-image inference, the enhanced YOLOv8n (Figure 21B) and its TensorRT-accelerated incarnation (Figure 21C) both deliver cleanly correct Orah fruit localizations. The unaltered YOLOv8n, by way of distinction, hallucinated detections in background patches—instances marked with a red circle in Figure 21A. Summing up, TensorRT-based optimization succeeded in dramatically shortening inference latency on the edge node while leaving the model’s ability to detect Orah fruits wholly intact.
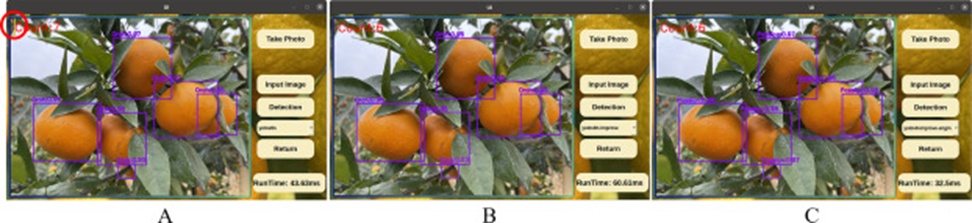
Figure 21. Comparison of detection results under edge device deployment: A) Results with original YOLOv8n model deployment, B) Results with improved YOLOv8n model without TensorRT-optimized deployment, and C) Results with improved YOLOv8n model with TensorRT-optimized deployment.
Although the training imagery was augmented before being fed into the learning procedure, the open question of how well a model trained on smartphone-derived photographs generalizes to alternative imaging hardware remains to be empirically scrutinized. To this end, the present study gauged the detection competence of the proposed model when mated with an industrial camera by collecting a fresh batch of 250 Orah fruit pictures on December 31, 2024, from a Nanning, Guangxi Orah plantation, this time using a RealSense D455 device configured to a pixel grid of 1280 × 720. This collection was stochastically partitioned into five groups (each serving as a test set), each containing 50 sample photographs. The proposed model was then evaluated in five separate passes, one per test group. The per-group and summary results are presented in Table 7.
Table 7. Results of the improved YOLOv8n model on the test sets collected with the RealSense D455 camera.
Group | R | P | |
① | 98.6 % | 95.3 % | 97.2 % |
② | 98.7 % | 94.1 % | 97.1 % |
③ | 98.9 % | 96.0 % | 97.6 % |
④ | 98.9 % | 95.2 % | 97.3 % |
⑤ | 98.7 % | 94.4 % | 97.8 % |
Average | 98.76 % | 95.0 % | 97.4 % |
Inspecting the mean values pooled across the five test iterations reveals that the P, R, and [email protected] numbers remain fairly steady across groups, deviating only slightly downward from the corresponding entries shown in Table 5 (see the row marked “ours”). Even so, these readings from RealSense D455 captures continue to exceed the benchmarks set by the antecedent comparative investigations, as charted in Figure 19. It would be disingenuous, however, to ignore the reality that imagery from smartphone sensors and that from industrial cameras are not perfectly interchangeable. The residual gap between them does manifest in modest performance differentials. The practical takeaway, therefore, is that industrial cameras are preferred wherever circumstances permit, to sidestep or at least attenuate such sensor-domain discrepancies.
A curated gallery of detection outputs spanning a spectrum of field conditions is presented in Figure 22. These visual examples, taken at face value, suggest that the proposed model has a healthy capacity to generalize across frames from an industrial imaging pipeline.
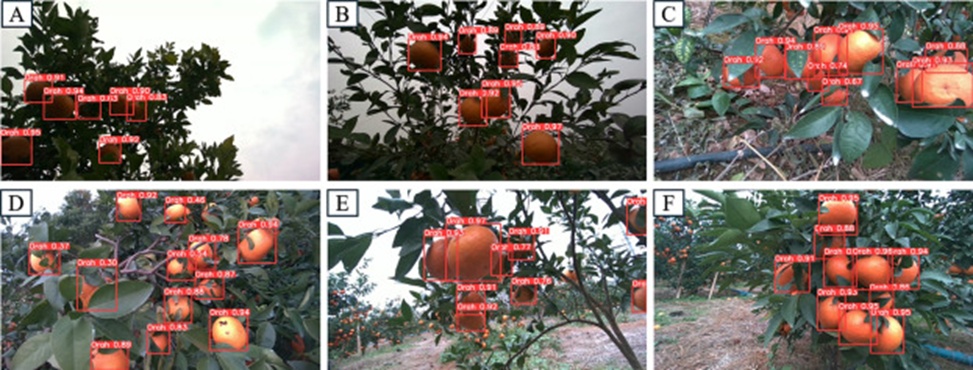
Figure 22. Detection results of Orah fruit images in complex scenarios captured by the depth camera: A) Results of cloudy and back light conditions, B) Results of back light and branch-leaf occlusion conditions, C) Results of fruit overlapping, D) Results of branch-leaf occlusions, E) Results of back light and fruit overlapping conditions, and F) Results of overlapping and branch-leaf occlusion conditions.
This section crystallizes the principal merits and the unresolved drawbacks of the investigation. On the merit side, three points deserve highlighting:
1) The image corpus assembled for this work covers Orah fruit specimens recorded under taxing field conditions—volatile natural illumination, fruit bodies occluding one another, and canopy-induced visual obstruction—with an explicit focus on stress-testing detection reliability. The empirical record indicates that the proposed YOLOv8n variant exhibits strong generalization performance.
2) Owing to its aggressively compressed parameter envelope, the enhanced YOLOv8n model can be hosted directly on edge-class compute hardware. This property aligns with the requirements of portable, in-orchard operation.
3) Using the Nvidia Jetson Orin Nano as the deployment substrate, an inference workflow accelerated via TensorRT optimization was realized, delivering a dramatic injection of processing speed on a compute-limited edge platform and thereby advancing the case for embedding edge computing modules inside robotic harvesters.
Alongside these favorable traits, certain shortcomings persist and must be candidly acknowledged. One concrete example: despite achieving an overall improvement in detection quality, the enhanced model showed a marginal softening in its R statistic compared with the baseline YOLOv8n. A partial explanation for this retrenchment may reside in the architectural economizing and the pared-down feature extraction stages—deliberate design decisions motivated by the pursuit of a lightweight model—that can somewhat erode the model’s capacity to pick out Orah fruits laboring under severe occlusion or caught in extreme illumination regimes.
The work reported here sets forth a lightweight, enhanced YOLOv8n model whose architectural identity is shaped by the joint influence of ADown modules, C3_DualConv modules, a CA attention mechanism, an upgraded BiFPN design, and a Focaler-MPDIoU composite loss formulation—all of which synergistically elevate detection performance for Orah fruits situated within complex visual contexts. Grounded in this model, a Jetson Orin Nano-hosted detection system was constructed via PyQt5, and the empirical record demonstrates that TensorRT-optimized deployment can meaningfully amplify inference throughput on edge devices despite their circumscribed compute envelopes. This edge-centric visual Orah fruit perception pipeline establishes a technological foundation for robotic Orah fruit-picking operations. That said, lingering issues—most notably the dip in recall and the shortfall in detection fidelity under extreme environmental conditions—constitute open questions that warrant sustained investigation in follow-up work.
This research was supported by the National Natural Science Foundation of China [grant No. 62163005, 32401709], the Youth Science Foundation of Guangxi Province [grant No. 2025GXNSFBA069270], the Natural Science Foundation of Guangxi Province [grant No. 2022GXNSFAA035633], and the Open Fund of the National Key Laboratory of Agricultural Equipment Technology (South China Agricultural University) [grant No. SKLAET-202407]. In addition, the authors would like to thank the editor and the anonymous reviewers for their constructive comments and helpful suggestions.
None
None
None
Open Access The author(s) retain copyright. This article is licensed under the Creative Commons Attribution-NonCommercial-ShareAlike 4.0 International License. It may be shared and adapted for non-commercial purposes with appropriate attribution, an indication of changes, and distribution of adaptations under the same license. Third-party material may be subject to separate terms identified in its credit line. View the license at https://creativecommons.org/licenses/by-nc-sa/4.0/.
 Agro Intelligence Research Press