China’s rapid socioeconomic transformation, marked by urbanization and land-use shifts, is creating novel contexts for the implementation of precision agriculture (PA). Two PA approaches were tested in a single-year experiment to evaluate their economic returns: precision seeding applied alone and precision seeding paired with land leveling. Although the trial produced favorable results, it could not, by itself, confirm longer-term advantages. The outlay for land leveling is concentrated in a single year, whereas its benefits may persist for multiple years. Therefore, if this PA practice yields benefits that extend into future seasons, the economic appraisal would improperly concentrate all expenditures in a single year of returns. In other words, the benefit-cost ratio would be underestimated. To determine whether benefits carried forward, we employed NDVI and GUI as proxy measures for gains in subsequent years. From the single-year experiment, our results demonstrated that: (1) Winter wheat output climbed by 23.2% when precision seeding and laser leveling were jointly applied. (2) Used in isolation or combination, the technologies markedly lowered soil ammonium nitrogen levels at the 60 cm depth; (3) The treatment benefit/cost ratios outperformed the baseline by roughly 10%, equating to an increase of several hundred US dollars per hectare. NDVI analysis indicated that the influence of laser land leveling persisted for up to 2 years. Factoring in the multi-year effect, the benefit/cost ratio of PSLL climbs to 23.5% and 22.9%, depending on whether laser land leveling subsidies are included. Elucidating the economic benefits of PA technology adoption should facilitate its broader adoption across the region.
Meeting the food demands of a swiftly growing populace using finite land, water, and environmental assets has become an ever more formidable task. Precision agriculture (PA) seeks to improve the financial and ecological performance of farming while curbing environmental harm, safeguarding crop output, quality, and food safety [1-4]. Modern PA systems generally feature the synergistic deployment of information technologies—such as Remote Sensing (RS), Geographical Information Systems (GIS), Global Navigation Satellite Systems (GNSS), and machine-mounted sensors—for activities like laser-guided land grading, sowing, variable rate nutrient delivery, reaping, spraying, and water-conserving irrigation setups. Yet, on-site assessments of PA remain infrequent. Within China, the potential effects of PA on harvest volumes, produce quality, and farm profitability have not been thoroughly demonstrated, a gap that likely represents a major impediment to its dissemination (e.g., [5].
Sowing stands as the single most vital operation in crop cultivation, exerting a direct influence on sprouting, plant development, and final yield, thus dictating overall productivity and the economic proceeds that follow [6, 7]. Precision seeding lies at the heart of PA advancement, acting as both the precondition and the platform for extending other precision operations: irrigation, fertilization, and harvesting [8]. The technology holds the capacity to lift germination percentages, conserve seed quantities [9, 10], fine-tune stand density, elevate harvests [10-12], and diminish manual tasks like thinning—collectively boosting farm revenue [13]. A pivotal element governing sowing outcomes is the standard of seedbed preparation [14]. Laser-guided land-grading implements deliver perfectly even fields, substantially improving micro-topographical attributes and thereby providing the essential base for precision sowing [15]. Broadly speaking, it can raise crop production [16, 17], strengthen the utilization efficiency of both fertilizers and water [14, 17-19], and consequently heighten economic returns [19, 20]. Certain reservations have been voiced that laser grading disturbs soil salinity and fertility, given that surface soil is cut from elevated zones and deposited in depressions during the operation [21]. 19 reported no meaningful distinctions in available nitrogen, phosphorus, potassium, and organic matter when comparing graded and non-graded plots.
Earlier investigations have largely examined the operational effects and economic viability of applying solitary technologies, with scant attention paid to integrated systems. To date, no inquiry has examined the combined effects of precision seeding and laser land-grading technologies in China. Accordingly, the present work sets out to quantify the impacts of precision seeding and its bundled application with laser land leveling on winter wheat output, residual soil nitrogen, and the attendant economic outcomes. Winter wheat constitutes a staple crop across China’s central plains. Trials were situated in Henan Province, which leads the nation in both aggregate wheat output and per-unit productivity. An additional objective is to investigate the lingering effect of the land grading element—specifically, that the advantages of grading remain detectable 2–3 years beyond the initial expenditure.
We document a single-year investigation of the inputs and yields from field tests of precision seeding (PS) and precision seeding with land leveling (PSLL), benchmarking the results against standard farming methods. To account for the enduring effect of land leveling and to bolster the single-season economic dataset, we use remote sensing to trace its influence across successive years. Remote sensing instruments can deliver an array of yield-correlated crop metrics for monitoring plant status and forecasting output, such as the Normalized Difference Vegetation Index (NDVI). Tightly linked to vegetation vitality, NDVI has been widely recognized since the early 1980s as a tool for crop surveillance and yield estimation [22, 23].
Two components formed the investigative framework. The first focused on conducting a single-season field trial to capture outputs on yield, leftover nitrogen effects, and the economic viability of both precision sowing alone and laser-flat ground paired with precision sowing. The second component drew upon a four-year archive of remote sensing imagery to explore how long laser leveling influences persist, subsequently informing an economic appraisal corrected through cost distribution across multiple years. A comprehensive depiction of the methodological flow appears in Figure 1.
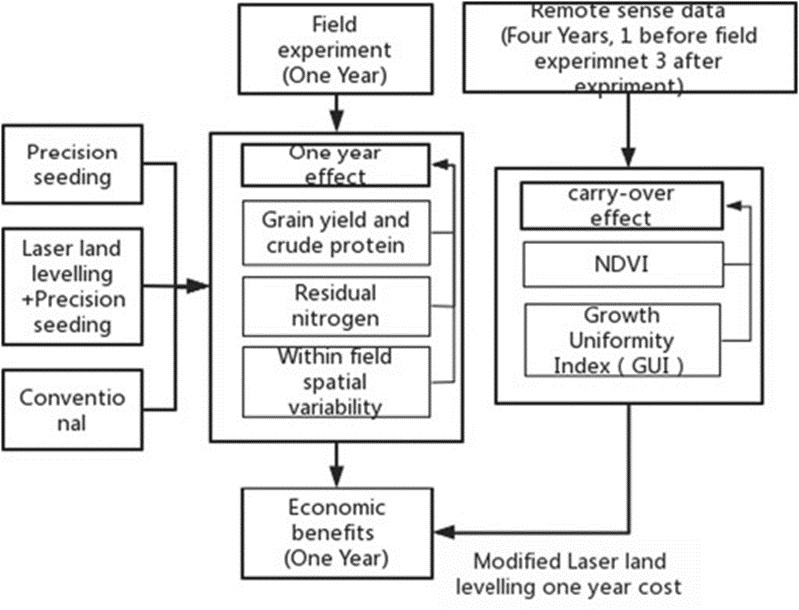
Figure 1. Flow diagram of this study.
Field operations were based at the 2011 National Collaborative Innovation Pilot for Modern Agriculture (113°58′26″ E, 34°12′06″ N), found within Chang’ge City, Henan Province, China. Farmers there routinely rotate winter wheat with summer maize. The zone falls under a north temperate continental monsoon regime, with a mean annual air temperature of 14.3 °C, a mean annual rainfall of 711.1 mm, and a mean frost-free interval of 217 days. The ground displays a medium textural class: within the uppermost layer (0–20 cm), organic matter reads 18.40 g kg−1, alkali-hydrolyzable nitrogen reads 101.22 mg kg−1, rapidly available phosphorus reads 9.83 mg kg−1, rapidly available kalium reads 98.44 mg kg−1, and pH reads 7.65.
A visual representation of the field layout, the contrasting treatments, and the sampling node arrangement is given in Figure 2. Three approaches to land grading and sowing were evaluated against one another: precision seeding deployed independently (PS), a bundled system merging precision seeding with laser land leveling (PSLL), and standard large-scale producer practice in the vicinity (C). The primary plot extended 300 m by 150 m, further partitioned into 50 m × 50 m sub-plots. A total of 18 sampling stations were marked out per treatment. Within PS, conventionally designed planters received upgrades in the form of a wheat seeding monitor and a GPS guidance unit—both outputs of the National Engineering Research Center for Agricultural Information Technology (NERCITA)—to deliver spatially precise seed placement (Figure 3). Such an arrangement affords tight command over seed distribution uniformity and the straightness of planted rows. The PSLL plots were treated with NERCITA’s 1PJ-2500 laser land leveling unit, operated to perform non-longitudinal cross-slope smoothing (Figure 4), with a 2.5 m span and a vertical accuracy of 2 cm. Standard land-shaping equipment was used for the remaining treatments.
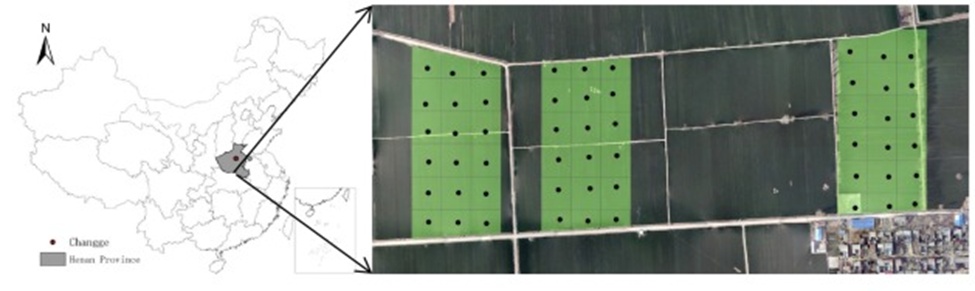
Figure 2. Experiment design and sampling point distribution.
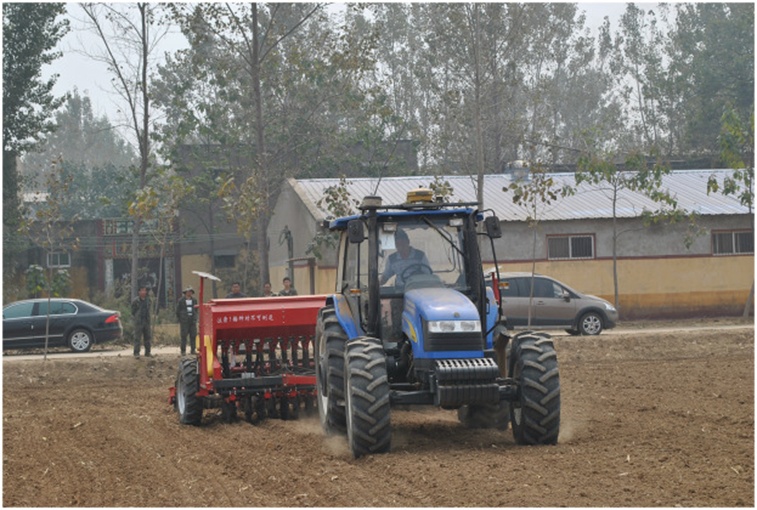
Figure 3. The accurate seeding machinery.
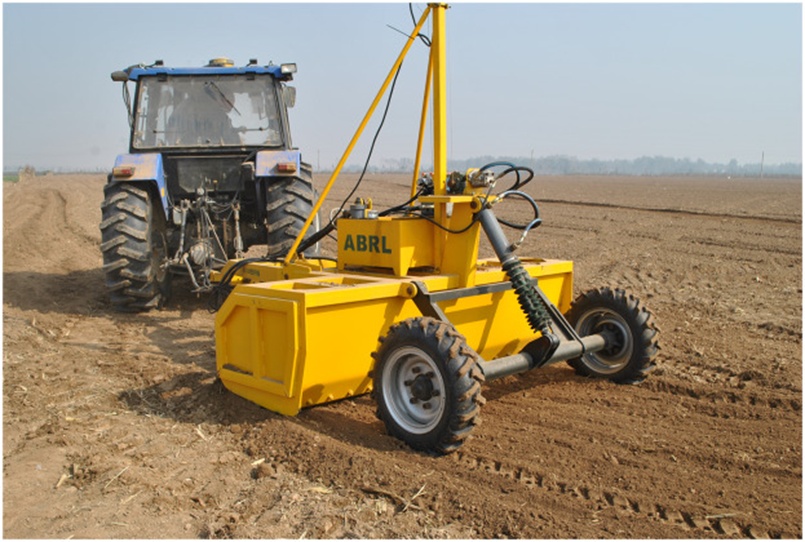
Figure 4. The laser land leveling machinery.
Xi Nong 979 served as the test cultivar, planted on October 5th, 2014. Sowing amounts for both PS and PSLL reached 195 kg ha−1, whereas C plots received seed at 225 kg ha−1, all adhering to a 16.5 cm inter-row gap. A basal nutrient dose of 750 kg ha−1 was incorporated (N: P: K = 23:16: 6), followed by a supplemental 225 kg ha−1 dressing of compound fertilizer delivered in early March 2015, capitalizing on rainfall events around the jointing phase. Across its lifecycle, the wheat stand received exactly one watering, supplied by local operators employing traditional hose-type sprinklers (widely nicknamed the “little white dragon”) [24]. Every facet of crop husbandry—irrigation timing and volume, fertilizer scheduling, topdressing, pesticide sprays, and other interventions—was kept strictly consistent among all three experimental groups throughout the growing window. Spanning the period from October 2014 to July 2017, a single application of laser land leveling, together with precision seeding, was applied to the PSLL plots in October 2014.
Eighteen sampling coordinates were laid out per treatment, spaced at 50 m × 50 m with a handheld GPS receiver (Trimble Juno 3B). Once the crop reached full maturity, aboveground biomass was manually cut from a 1 m² quadrat centered over each point. The harvested spikes were threshed with a plot-scale thresher, then dried in a batch-type grain dryer, after which weight measurements were taken. Reported wheat grain yields are standardized to a 12% moisture basis. A fraction of the grain was subsequently ground to a powder, thoroughly mixed, sieved, and assayed for Kjeldahl nitrogen content following the standard Kjeldahl protocol [25]. Crude grain protein concentration was then derived by multiplying the nitrogen result by a factor of 6.25. Coinciding with harvest, soil cores were drawn from three randomly selected positions surrounding each sampling station. A 5 cm-diameter auger extracted material from the 0–60 cm profile, segregated into 20 cm depth increments. These samples were placed in Ziploc bags and transported to the laboratory. Soil moisture percentage was determined by oven-drying at 105 °C. Nitrate and ammonium nitrogen fractions were liberated from fresh subsamples through extraction with a 1 mol L−1 KCL solution. Quantification of both soil nitrate and ammonium levels employed a flow analyzer instrument (Seal AA3).
The financial evaluation encompassed all cost components: tillage service charges, outlays for seed material, fertilizer products, pesticide agents (water for irrigation was supplied at no cost by the experimental station), and farm managerial overhead. Operations, including field preparation, crop establishment, nutrient and pesticide distribution, water delivery, and combine harvesting, were carried out entirely by agricultural machinery cooperatives and growers’ collectives. Hence, labor contributions were inherently embedded within these contracted service fees. Given that the landholding falls under the Henan Food and Oil Group, managerial expenses correspond to the remuneration paid to that organization’s personnel responsible for land supervision. Aggregate per-treatment expenditure was determined through the following expression:
 (1)
(1)
Where TCC = total cost of cultivation, C1 = agricultural material cost, C2 = agro-mechanization service cost, C3 = managerial pay; i = agricultural inputs, e.g., seed, fertilizer, pesticide, Ii = quantity employed of the ith agricultural input, Pi = unit price of the ith agricultural input.
Gross returns (GR) represent the product of grain yield and the state-mandated minimum support price for wheat (0.4 US$ kg−1) enforced in China. Net returns (NR) were calculated by subtracting total cultivation outlay from gross returns (NR = GR - TCC). The benefit-to-cost ratio was calculated by dividing GR by TCC.
NDVI readings acquired over the March–May window supply robust proxies for gauging winter wheat vigor and predicting productivity across the North China Plain [26]. Recognizing that a principal ambition of PSLL is to foster evenness in emergence and stand development, we hypothesize that PSLL reduces spatial heterogeneity and promotes more rapid canopy progression compared with standard practice. The present inquiry introduces an innovative remotely sensed diagnostic—the Growth Uniformity Index (GUI) [27]—built on NDVI foundations, serving to categorize wheat growth status and assess any carryover effects.
Archived GF-1 satellite overpasses dating from 2014 through 2017 and fully covering the experiment location were retrieved from the United States Geological Survey online portal and the Land Observation Satellite Data Service Platform (Table 1).
Table 1. The information on GF-1 satellite images of the experimental site.
Satellite | Spatial resolution | Quality Level | Date | |||
GF-1 | 16 M | 1A | 2014.03.14 | 2015.03.13 | 2016.03.11 | 2017.03.16 |
Within the ENVI (The Environment for Visualizing Images) environment, preparatory processing of the GF-1 scenes involved radiance calibration, atmospheric correction, RPC orthographic rectification, and geometric co-registration. For the geometric correction step, high-resolution digital basemaps were selected as the spatial reference, and an image-to-image matching routine was executed. NDVI magnitudes covering the study footprint were generated by invoking the BandMath utility of ENVI. NDVI was computed from the underlying spectral bands through this relationship:
 (2)
(2)
Within this formulation, NIR designates band 4 of the GF-1 instrument, while Red designates band 3.
Computation of the Growth Uniformity Index (GUI) proceeded according to the expression below. The metric ranges from 0 to 1, with values approaching 1 indicating healthier, more homogeneous crop development.
 (3)
(3)
Here, NDVICV stands for the Coefficient of Variance computed from NDVI readings; NDVICV min corresponds to the lowest recorded NDVI coefficient of variation within the identical time window; NDVICV max corresponds to the highest recorded NDVI coefficient of variation within the identical time window.
Measurements of grain yield, crude protein, and residual nitrogen were confirmed to adhere to normal distributions. The dataset was analyzed using analysis of variance (ANOVA) via the general linear model function in the Statistical Product and Service Solutions (SPSS) 16.0. Separation of treatment means was accomplished via Fischer’s protected least significant difference (LSD) procedure at the P ≤ 0.05 threshold.
A spatial rendering of plot-level yield data is supplied in Figure 5. Examining the 18 sampling stations established per treatment, grain harvests exceeding 8000 kg ha⁻¹ were recorded at 33% of PS positions, as opposed to 83% under PSLL and a scant 22% under C. Turning to average productivity, PS generated a 7.8% lift in winter wheat grain output—an increment that fell short of statistical significance. In contrast, PSLL achieved a pronounced 23.2% boost (Figure 6a). Mean crude protein readings for PS, PSLL, and C were 13.6%, 13.6%, and 13.7% in that order, and these modest variations lacked statistical importance (Figure 6b).
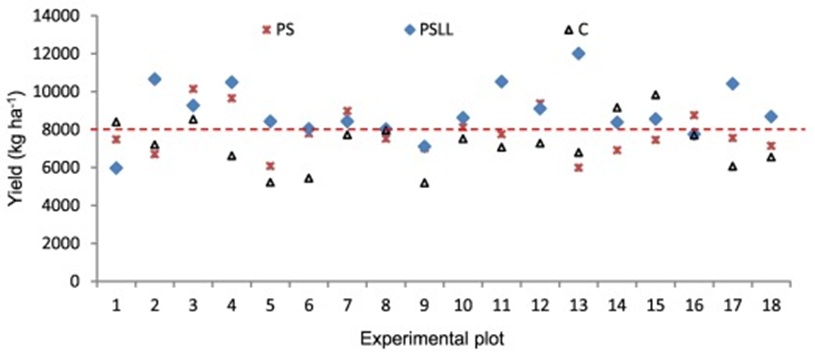
Figure 5. Wheat yield at the 18 sampling points in each of the three treatments.
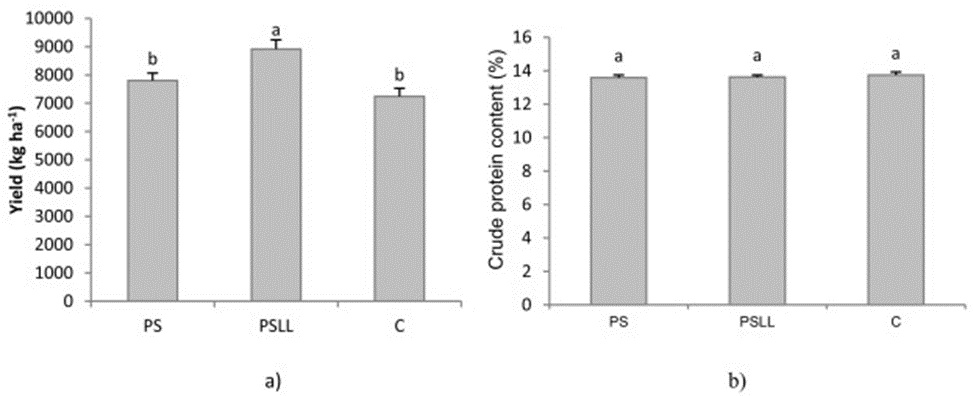
Figure 6. a) Grain yield and b) crude protein content (lowercase letters indicate significant differences).
Across all treatments, residual nitrate nitrogen pools in the soil after the winter wheat harvest decreased with increasing depth (Figure 7a). However, compared with conventional cultivation, the precision agriculture regimes showed a tendency toward somewhat lower residual nitrate levels. However, this downward trend never reached statistical significance. Compared with C, the quantity of residual nitrate nitrogen present throughout the 0–60 cm soil column under PS and PSLL declined by 7.9% and 4.9%, respectively.
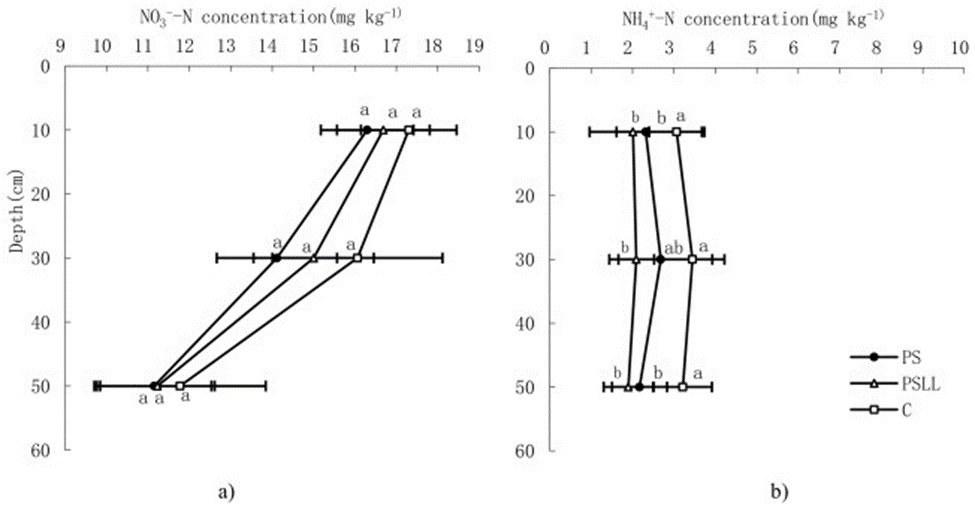
Figure 7. a) Soil nitrate and b) ammonium nitrogen concentration at the depth of 0–20, 20–40, and 40–60 cm during wheat harvest (a and b in the figure indicate significant differences, P < 0.05).
Residual ammonium nitrogen values at successive depths stayed broadly equivalent under all three treatments (Figure 7b). A modest concentration peak emerged within the 20–40 cm band relative to shallower and deeper layers. The two precision agriculture interventions led to a significant reduction in soil ammonium nitrogen (P ≤ 0.05). PSLL exerted a stronger depressive effect on ammonium nitrogen than PS did. Ammonium nitrogen stocks across the full 0–60 cm interval shrank by 26.3% and 38.2% under PS and PSLL, respectively, with no statistically meaningful separation between these two outcomes.
Contrasts among the plot-level treatments are summarized in Table 2. The coefficient of variation discloses that within-field spatial heterogeneity in residual nitrate nitrogen and ammonium nitrogen (inorganic nitrogen) residing in the uppermost 0–20 cm layer far outstripped the heterogeneity observed for either protein content or grain yield. Spatially, inorganic nitrogen levels exhibited no substantial linkage with crop yield or protein content (R² < 0.3). The spatial variability of winter wheat yield proved to be narrower under PS and PSLL than under C, with PS registering the absolute lowest degree of yield variability. Neither PS nor PSLL succeeded in compressing the spatial variability of grain protein content or inorganic nitrogen levels in the surface soil (0–20 cm).
Table 2. Spatial variability of grain yield, protein content and soil inorganic nitrogen concentration at the depth of 0-20 cm under different treatments.
Variables | Treatments | C·V.% | S.D. | Maximum | Mean | Minimum | Number of sampling points |
Yield (kgha−1) | PS | 15 | 1173.7 | 10,149.8 | 7805.5 | 5997.3 | 18 |
PSLL | 16.3 | 1456.2 | 12,015.3 | 8919.6 | 5969.8 | 18 | |
C | 17.9 | 1293.8 | 9836.2 | 7242.8 | 5196.8 | 18 | |
Crude protein content (%) | PS | 4.8 | 0.6 | 14.6 | 13.6 | 12.8 | 18 |
PSLL | 5 | 0.7 | 14.8 | 13.6 | 12.6 | 18 | |
C | 5.7 | 0.8 | 14.9 | 13.8 | 12 | 18 | |
Soil inorganic nitrogen concentration of the 0–20 cm layer (mg kg−1) | PS | 31.1 | 5.8 | 33.9 | 18.5 | 10.4 | 18 |
PSLL | 31.8 | 5.9 | 29.9 | 18.7 | 12 | 18 | |
C | 31.3 | 6.4 | 36.4 | 20.4 | 11.8 | 18 |
Projected input quantities alongside their monetary costs are catalogued in Table 3, while Table 4 presents the aggregated costs and benefits broken down by treatment. The overall cultivation expenditure for C totalled 1380.3 US$ ha⁻¹, which was lower than the corresponding sums for both PS and PSLL. Stacked against C, the PS and PSLL regimes incurred additional charges for laser land grading, seeding rate monitoring, and GPS-based navigation. For purposes of this study, these items were treated as contracted service outlays; specifically, laser land grading was invoiced at US$ 185.6 ha⁻¹, while the tandem of seeding monitoring and GPS guidance added US$23.2 per hectare. China’s central authorities currently underwrite a portion of laser land grading expenses. In the case of Tianjin, the subsidy allocation is US$116.0 per hectare [28]. Consequently, the precision agriculture surcharges for PS and PSLL worked out to 92.8 US$ ha⁻¹ when laser land grading subsidies were incorporated, and 208.8 US$ ha⁻¹ when those subsidies were omitted.
Table 3. Inputs and management measures.
Management | Input | Unit | C | PSLL | PS |
Basal dressing (compound fertilizer, N:P:K = 23:16:6) | Fertilizer application rate | Kg ha−1 | 750.0 | 750.0 | 750.0 |
Land preparation | Mechanical plowing and straw incorporation service costs | US$ ha−1 | 185.6 | 185.6 | 185.6 |
Land preparation | Laser leveling charges (with/without subsidies) | US$ ha−1 | 0.0 | 69.6 / 185.6 | 0.0 |
Seeding | Seed quantity | Kg ha−1 | 225.0 | 195.0 | 195.0 |
Seeding | Seeder operation fees | US$ ha−1 | 23.2 | 23.2 | 23.2 |
Seeding | Monitoring and GPS-guided sowing costs | US$ ha−1 | 0.0 | 23.2 | 23.2 |
Topdressing (compound fertilizer N:P:K = 23:16:6) | Fertilizer quantity applied | Kg ha−1 | 225.0 | 225.0 | 225.0 |
Topdressing | Fertilizer spreading service fees | US$ ha−1 | 23.2 | 23.2 | 23.2 |
Irrigation (once during 2014–2015) | Electricity and labor expenses | US$ ha−1 | 92.8 | 92.8 | 92.8 |
Irrigation | Pipe installation cost | US$ ha−1 | 309.3 | 309.3 | 309.3 |
Spraying | Herbicide application (chemicals + machinery cost) | US$ ha−1 | 16.2 | 16.2 | 16.2 |
Spraying | Pesticide application (chemicals + machinery cost) | US$ ha−1 | 18.6 | 18.6 | 18.6 |
Spraying | Pest, dry, hot wind, and lodging control (chemical + aerial spraying) | US$ ha−1 | 34.8 | 34.8 | 34.8 |
Harvesting | Combine harvester service cost | US$ ha−1 | 69.6 | 69.6 | 69.6 |
Management | Administrative personnel wages | US$ ha−1 | 13.9 | 13.9 | 13.9 |
Note: The rate of laser land leveling subsidies is 115.8 US$ ha⁻¹.
Table 4. Economic benefits of different wheat treatments during 2014–2015.
Economic indicators | C | PSLL |
| PS |
| Without subsidies | With subsidies | ||
Conventional agriculture cost (US$ha−1) | 1380.3 | 1363.6 | 1363.6 | 1363.6 |
Precision agriculture cost (US$ha−1) | 0.0 | 208.8 | 92.8 | 23.2 |
Total cost of cultivation (US$ha−1) | 1380.3 | 1572.4 | 1456.4 | 1386.8 |
Gross benefit (US$ha−1) | 2689.1 | 3311.7 | 3311.7 | 2898.0 |
Net return (US$ha−1) | 1308.8 | 1739.2 | 1855.2 | 1511.2 |
Benefit/cost ratio | 1.95 | 2.11 | 2.27 | 2.09 |
Note: According to the e-commerce platform Jingdong, compound fertilizer is 0.5 US$ kg⁻¹ and seed is 0.6 US$ kg⁻¹.
As shown in Table 4, C posts a benefit-to-cost ratio of 1.95 (Gross Benefit/Total Cultivation Cost). PS lifted this indicator by 7.3% to reach 2.09, whereas the bundled PSLL strategy drove gains of 16.7% (reaching 2.27) when laser land grading subsidies were included, or 8.1% (reaching 2.11) when no such subsidies applied. Relative to the C baseline, net return under PS expanded by 15.5% (202.4 US$ ha⁻¹). Under PSLL, the increment exceeded 40% (546.4 US$ ha⁻¹) with subsidy support and reached 30% (430.4 US$ ha⁻¹) in the absence of laser land-grading subsidies.
NDVI metrics extracted from GF-1 imagery are assembled in Table 5. The coefficient of variation (CV%) for PSLL trails the C value in both 2015 and 2017. It is lower than PS across the entire 2015–2017 window—an indication of superior repeatability in the experimental yield findings. Only in 2015 does the CV for PS fall beneath the corresponding C figure. These trends mirror the GUI dataset. It must be noted, however, that the PS plots were struck by a heavy pest outbreak in 2016; the PSLL plots experienced minor spill-over effects, most pronounced along the eastern boundary adjoining the PS area (PSLL occupies the western side of PS, per Figure 2). Upon discarding the pest-damaged eastern fringe of PSLL from the 2016 dataset, the C.V. and GUI metrics for PSLL rebounded to 4.68% and 0.62, respectively, values that outperform those associated with C. The preceding body of evidence therefore supports the conclusion that a single round of laser land grading executed in year one yields beneficial carryover repercussions lasting no fewer than three seasons. In contrast, the impact attributable to precision seeding in isolation is not year-to-year stable.
Table 5. NDVI mean and other parameters of winter wheat at the reviving stage under different treatments for four years.
Date | Treatments | GUI pest adjusted | C.V.% pest adjusted | GUI | C.V.% | S.D. | Maximum | Mean | Minimum | Number of points |
14/03/2014 | C |
|
| 0.50 | 4.11 | 0.03 | 0.79 | 0.75 | 0.71 | 432 |
14/03/2014 | C | – | – | – | 3.49 | 0.03 | 0.78 | 0.75 | 0.61 | 432 |
13/03/2015 | PS | – | – | 0.65 | 1.29 | 0.01 | 0.60 | 0.58 | 0.56 | 144 |
PSLL | – | – | 0.49 | 1.87 | 0.01 | 0.60 | 0.58 | 0.54 | 144 | |
C | – | – | 0.35 | 2.39 | 0.01 | 0.60 | 0.58 | 0.51 | 144 | |
11/03/2016 | PS | 0.38 | – | 0.41 | 7.80 | 0.04 | 0.60 | 0.54 | 0.38 | 144 |
PSLL | 0.62 | 4.68 | 0.50 | 6.61 | 0.04 | 0.62 | 0.58 | 0.45 | 144 | |
C | 0.57 | – | 0.59 | 5.41 | 0.03 | 0.61 | 0.57 | 0.39 | 144 | |
16/03/2017 | PS | – | – | 0.42 | 2.80 | 0.02 | 0.73 | 0.70 | 0.60 | 144 |
PSLL | – | – | 0.58 | 2.03 | 0.01 | 0.72 | 0.70 | 0.62 | 144 | |
C | – | – | 0.50 | 2.43 | 0.02 | 0.72 | 0.70 | 0.62 | 144 |
Accordingly, once the multi-year persistence of laser land grading is acknowledged, the initial outlay can be apportioned evenly over a three-year horizon. Under this scenario, the benefit/cost ratio of PSLL climbs by 20.9% to 23.5% when subsidies are available, and by 21.1% to 22.9% when they are not.
The data generated by this study reveal that precision seeding alone and its fusion with laser land grading increased winter wheat grain production by 7.8% and 23.2%, respectively. Such outcomes resonate with earlier published accounts suggesting yield uplifts ranging from 5% to 40% following the introduction of precision seeding or laser land grading, together with concurrent improvements in water and nutrient utilization efficiency [8, 17, 21, 29-31]. PSLL outstripped PS in yield enhancement, a superiority rooted in a pair of complementary mechanisms. To begin with, laser land grading produces a more planar field surface [32], which regularizes sowing depth, stimulates better emergence and improves the microenvironment for growth [33, 34], thereby magnifying the benefits of precision seeding. In parallel, precision seeding itself guarantees consistency in both the quantity of seed dispensed and the spacing between rows [9], thereby curtailing double-seeding and missed patches, promoting vigorous emergence, fine-tuning plant population architecture, and creating the conditions under which the advantages of laser land grading can be fully expressed. Stated succinctly, laser land grading and precision seeding operate synergistically, jointly delivering superior yields. Grain quality is governed not merely by genetic constitution but equally by the growing environment and the suite of husbandry practices applied [35, 36]. The present investigation documents that PS and PSLL maintained wheat protein concentrations indistinguishable from those obtained under conventional cultivation.
The pools of nitrate and ammonium nitrogen lingering in the soil post-harvest amplify the threat of nitrogen escape via leaching [37]. Prior scholarship has shown that PA tools, through enhanced nitrogen recovery, can reduce residual soil nitrogen stocks [38, 39]. Countervailing studies, however, contend that PA interventions may fail to depress soil nitrate nitrogen residues [40, 41]. Within the confines of the present work, PS and PSLL displayed a proclivity to moderate the magnitude of both nitrate and ammonium nitrogen remnants after the winter wheat was taken off (Figure 5). The two treatments exerted a particularly pronounced effect on ammonium nitrogen concentrations. The predominant reason is that both PA regimens substantially increased wheat yields, leading to greater nitrogen offtake by the crop and, consequently, leaner post-season nitrogen pools [42, 43]. The observation that PSLL was less potent than PS in trimming nitrate nitrogen is largely attributable to the compaction inflicted by laser land grading machinery traversing the field repeatedly; this elevates soil bulk density, impedes the downward infiltration of moisture [14], and fosters the entrapment of highly mobile nitrate nitrogen within the surface strata. Conversely, PSLL surpassed PS in suppressing ammonium nitrogen, chiefly because winter wheat under PSLL attained more robust growth and extracted a larger quantum of nitrogen. In contrast, ammonium nitrogen—unlike its nitrate counterpart—does not readily travel with percolating water.
NDVI serves as a sensitive recorder of the spatiotemporal fluctuations inherent in wheat yield [23, 26, 44]. The physiological indicator (C·V) for yield, whether derived from direct field measurements or inferred from NDVI, indicates that PS and PSLL were capable of reducing spatial scatter in winter wheat productivity in 2015 relative to conventional practice. Precision seeding can raise the level of planting uniformity [10, 45], and laser land grading can supply a more even substrate for the delivery of seed, nutrients, crop protection agents, and other farm inputs [19, 46]. Both technologies operate to suppress the spatial patchiness of winter wheat yield. That said, during laser land grading operations, formerly subsurface horizons may be brought to the surface, heightening near-surface spatial heterogeneity in soil chemical, physical, and biological attributes [32, 46]—a dynamic that plausibly explains why the spatial variability of wheat yield under PSLL exceeds that observed under PS. In both 2016 and 2017, the NDVI C.V. of PSLL remained lower than that of C, whereas the PS counterpart did not. The explanation lies in the documented longevity of a single laser land grading treatment, which persists for 3–4 years [19, 47].
The financial footprint of PA technologies on modestly priced staple crops such as wheat and maize tends to be broadly constructive. Annual net income streams originating from laser-leveled parcels—spanning two cropping cycles under a rice-wheat sequence and three under a maize-wheat sequence—registered a 32% uplift over those generated by unleveled fields [19]. Data from rice-wheat rotational trials indicate that deploying laser land-grading technology increases annual farm revenue by $145 ha⁻¹ [21]. Assembling multiple PA components can yield higher earnings than relying on any single component alone [48, 49]. It should be noted, however, that [21] and [50] reported negative net income during the inaugural year, largely because the capital sunk into laser land grading was recouped across only one wheat cycle. The current analysis projects positive benefit-to-cost ratios and net returns for the various PA treatments relative to conventional practice.
As a practical matter, annual re-leveling is unnecessary, thereby sparing growers from piling recurring costs onto the production budget. [19] document that fields can remain unrelevelled for at least 3 years. [47] reported that a single laser land-grading pass remains effective for at least 4 years. Drawing on remote sensing observations, the present study finds that the impacts of laser land grading persist for at least 3 years and that the benefit/cost ratio of PSLL consequently increases by roughly 5 percentage points.
The architecture of agricultural policy shapes farmers’ choices [51, 52]. Formulating government-led initiatives to expand socialized services—including subsidy mechanisms for PA technologies—can further catalyze the spread and routine use of PA across China’s farming landscape.
Stacked against the locally dominant conventional large-scale cultivation model, precision seeding applied alone and the combined precision seeding plus laser leveling package both increased winter wheat productivity, with the latter delivering a statistically significant and more substantial gain. Both approaches concurrently dampened the spatial variability of yield. Regarding quality attributes, the PA interventions had no adverse effect on grain protein content in the harvested wheat crop.
Precision seeding by itself, together with the integration of precision seeding and laser leveling, reduced soil nitrate and ammonium nitrogen burdens within the 0–60 cm stratum after wheat harvest when contrasted with conventional farming, thereby diminishing the risks of ammonia volatilization and nitrate nitrogen leaching loss.
Turning to economic performance, precision seeding improved the benefit/cost ratio by 7.3%, whilst the integrated precision seeding and laser leveling package lifted the ratio by 16.7% with laser land leveling subsidies operational, or by 8.1% without such subsidies. Net return under precision seeding expanded by 15.5% (202.4 US$ ha⁻¹). Under the combined precision seeding and laser land leveling treatment, the gain exceeded 30% (430.4 US$ ha⁻¹) in the absence of laser land leveling subsidies, and surpassed 40% (546.4 US$ ha⁻¹) with subsidies applied. Given that a one-time laser land leveling operation lasts for 3 years, after distributing the laser land leveling cost evenly across those 3 years, the benefit uplift under PSLL rose to 554.2 US$ ha⁻¹ without subsidies or 592.8 US$ ha⁻¹ with subsidies, compared to C, both figures clearing the 40% mark.
For subsequent inquiry, it is recommended that further investigations be directed toward appraising the effectiveness and efficiency of varied bundled precision agriculture technologies. These should extend to variable-rate fertilization, variable spraying, variable irrigation, and complementary interventions, as well as methodologies to raise awareness of the superior economic and environmental dividends attainable in dryland farming systems across China’s central plains.
This study is funded by the National Key Research and Development Program of China (2017YFE0122500). We greatly appreciate the time, effort, and generosity of Henan Agricultural University and Henan Food & Oil Group, who graciously allowed us to use their fields for this study, as well as Ma Xingming, Yang Guijun, and An Xiaofei for their continuous support and useful discussions.
None
None
None
Open Access The author(s) retain copyright. This article is licensed under the Creative Commons Attribution-NonCommercial-ShareAlike 4.0 International License. It may be shared and adapted for non-commercial purposes with appropriate attribution, an indication of changes, and distribution of adaptations under the same license. Third-party material may be subject to separate terms identified in its credit line. View the license at https://creativecommons.org/licenses/by-nc-sa/4.0/.
 Agro Intelligence Research Press