The tractor functions as a fundamental power source for farming activities. Still, the available power is frequently not fully exploited because of poor matching between the tractor and the attached implement under actual field conditions. To improve overall system productivity, it is essential to gather information on performance-related variables characterising the tractor-implement unit. In this work, we build a real-time Instrumented Tractor Performance Monitoring System (ITPMS) that leverages the Internet of Things (IoT). The hardware foundation comprises a Raspberry Pi, a GPS sensor, a proximity sensor, a rotary potentiometer, and a three-point hitch dynamometer. The rotary potentiometer records tillage depth, whereas the three-point hitch dynamometer captures draft force values. Proximity sensors are mounted on a two-wheel-drive (2WD) tractor to measure forward speed and drive-wheel slip. A dedicated web server is set up within a Google® Firebase® project, allowing storage of data streams from all sensors via the Raspberry Pi. Alongside this, a web interface and a mobile application are constructed to present the sensor-generated data in real time. Field experiments were conducted to assess and observe the performance variables of the tractor-implement unit employing the built ITPMS. The findings reveal that the system can reliably monitor the performance variables required for the tractor-implement unit. Furthermore, the system’s ability to transmit updated information to the IoT server without delay is verified. Altogether, designing and deploying this Raspberry Pi–centred IoT framework provides a trustworthy and effective approach for real-time performance monitoring of instrumented tractors.
Precision farming represents an advancing strategy in crop production that leverages information technology to enhance the efficiency, impact, and sustainability of farming operations while reducing costs and minimizing environmental harm [1-4]. Even though significant attention has been directed toward reducing spending on chemicals and fertilisers and increasing harvested output, other equally important cost drivers behind total farm production expenses have remained relatively overlooked [5]. Chief among these cost drivers, tractors serve as the primary power unit for land preparation, crop care, and transport, thereby strongly influencing whether productive, cost-effective farming routines are achieved.
Tractors lie at the heart of agricultural output, and how they perform directly shapes operational effectiveness and financial returns through smarter resource use [6, 7]. Conventionally, the process of coupling tractors with implements has been steered by accumulated know-how rather than by a science-based understanding of what governs performance. That habit does not consistently lead to the best combinations. Proper farm machinery management requires using measured performance data when matching tractors to implements for specific field conditions. Doing so is pivotal for controlling costs associated with crop production, ranging from ownership, fuel, and repairs to upkeep and broader operational concerns [8-11]. For these reasons, a responsive system capable of assessing a tractor’s behavior in genuine field conditions is needed.
The pathway for performance-monitoring technologies for tractors and precision farming is making notable strides. Yahya et al. [8] rolled out a data-gathering arrangement with DGPS to map how tractor-implement combinations perform, a move that marked an early, decisive phase in the development of precision farming instruments. Advancement carried forward when Al-Suhaibani et al. [12] assembled and trialled a thorough instrumentation package intended for tractors and tillage implements. That package, which included a drawbar dynamometer, a wheel torque transducer, and weight transducers, improved the accuracy of performance readings, especially when determining drawbar pull and three-point linkage loads under varying depth and speed conditions.
Singh and Singh [13] further expanded the area by introducing a high-accuracy computerised instrumentation suite to measure several tractor performance metrics. Built around the Campbell Scientific CR3000 data logger and multiple sensors, the suite delivered strong precision and accuracy, thereby underscoring the need for broader field testing across diverse soil classes. Molari et al. [7] contributed a system that tracks tractor working parameters via CAN-Bus technology. The aim was to capture the mission profile of tractors using small memory modules, thereby improving the ability to log and analyse data to enhance tractor design and enable predictive maintenance.
Shafaei et al. [10] and Shrivastava et al. [11] made a significant advance in the precise sensing of tractor performance measures by deploying a digital system with a human-machine interface. The contribution proved a workable measurement and data storage, pointing toward further upgrade potential. Rijanto et al. [6] developed a novel embedded monitoring system to track the maintenance and operational state of cane harvester tractors, enabling improved oversight of upkeep and operational behaviour.
The attention later shifted to the examination of low-power wide-area network (LPWAN) wireless technologies for communication in smart-agriculture tractor settings. Klaina et al. [14] highlighted the suitability of LPWAN for enhancing communication in smart farming contexts, while also signalling that further study across a broader set of field conditions was necessary. Shrivastava et al. [15] proposed a radio-telemetry-based arrangement enabling wireless engine control and tracking of tractor implement performance, which delivered better control and oversight but remained to be confirmed across diverse field environments. Other investigators [16-22] have likewise built instrumentation arrangements for tractor performance tracking.
Looked at as a whole, this progression maps a steady climb from simple digital and computerised arrangements toward platforms that bring together numerous sensors, mirroring sustained innovation focused on sharpening precision farming and tractor performance tracking. Those earlier efforts focused primarily on capturing final measured quantities but lacked real-time monitoring. Beyond that, the arrangements tended to be heavy, awkward to set up and run, costly, and demanded a large amount of room inside the tractor cabin. On top of this, their usability remained limited to certain tractor models, hindering widespread adoption.
To tackle these constraints, a holistic and unified framework that acquires, interprets, and operationalises data for the execution of precision farming techniques is called for. Such a framework would yield actionable intelligence to guide well-informed decisions for running agricultural activities in a streamlined manner, ultimately reducing ecological strain by enabling more productive, precisely targeted input delivery.
Over recent years, the Internet of Things (IoT) has emerged as a powerful technology for the real-time monitoring and orchestration of various agricultural processes [23-26]. As a case in point, Billa et al. [27] crafted an IoT-centred system for efficient crop surveillance and safeguarding built around the Raspberry Pi. This configuration continuously tracks soil moisture, ambient temperature, and humidity while imaging plants to flag diseases or unauthorised entry, thereby reliably protecting the harvest.
Anusha and Mahadevaswamy [28] assembled an automated system for plant observation and watering that uses a Raspberry Pi processor to record environmental factors, including temperature, humidity, soil moisture, and luminance. Pereira et al. [29] developed an IoT-centred system for live cloud-based monitoring of a decentralised photovoltaic setup using a Raspberry Pi, logging PV voltage, current, ambient and module temperatures, solar irradiance, and relative humidity, thereby offering an end-to-end solution for renewable energy oversight. Oudah et al. [30] developed an automated irrigation setup using computer vision and artificial intelligence on a Raspberry Pi. The arrangement captures soil colour shifts with a camera and deploys a random forest algorithm to estimate watering requirements, thereby mechanising irrigation, reducing human input, and boosting water-use efficiency.
Additionally, Imteaj et al. [31] described an IoT-based autonomous irrigation system built on a Raspberry Pi that self-sufficiently delivers water to fields based on soil moisture and daylight brightness, ensuring optimal water consumption and crop conditions. Lavanya et al. [32] developed an IoT-enabled fertiliser advisory system for intelligent farming, using a Raspberry Pi to assess soil nutrient levels and deliver fertiliser guidance via SMS, streamlining fertiliser application and boosting crop yields. Parallel work by other investigators [33-36] has likewise underscored the flexibility and power of the Raspberry Pi across an array of IoT use cases, delivering significant gains in farming and renewable energy. These bodies of work lay a sturdy foundation for exploiting IoT technology using a Raspberry Pi to observe the performance of an instrumented tractor.
Accordingly, this paper outlines the creation and rollout of an IoT framework powered by Raspberry Pi for the live performance observation of an instrumented tractor. This framework enables end users to inspect and analyze live data streaming from a tractor with high accuracy. It harvests signals from sensors mounted on the tractor-implement unit and forwards them to the cloud for scrutiny. That intelligence would then be leveraged to improve the effectiveness of farming activities, spot looming problems before they trigger failure, reduce costs, and enhance safety. This live performance observation platform provides a foundation for integrating machine learning to support the selection and fine-tuning of tractor-implement combinations. Weaving these capabilities into farming operations will lead to greater operational efficiency and lower associated costs.
Grounded in the Internet of Things (IoT) idea, the Instrumented Tractor Performance Monitoring System (ITPMS) brought together hardware and software elements. On the hardware front, the setup featured a Raspberry Pi 4B microcomputer, an Arduino Mega 2560 microcontroller, a GPS sensor, proximity sensors, a rotary potentiometer, a three-point-hitch dynamometer, and additional supporting hardware. The system is also provisioned with a cloud server to store sensor data and facilitate live data observation through a tailor-made web interface, along with an Android-based mobile application. Figure 1 lays out the complete architecture of the Raspberry Pi–based IoT framework.
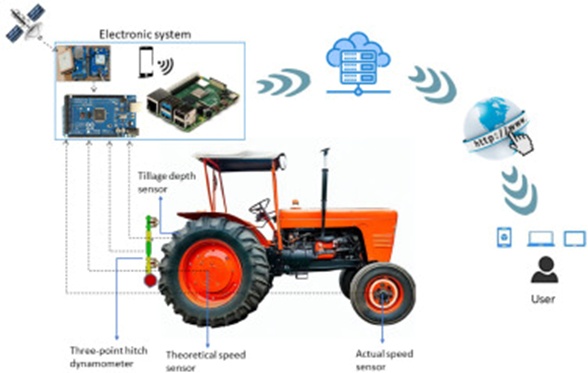
Figure 1. The overall architecture of a Raspberry Pi-based IoT system.
ITPMS brings together three main building blocks:
(a) Data gathering via sensors: Forward speed, drive-wheel slip, tillage depth, draft, and GPS location.
(b) Data transfer to the cloud server.
(c) Web interface and mobile application: For live performance observation.
The embedded software for ITPMS is accessible free of charge upon creating a new profile in Google Firebase [37] following enrolment. It is architected to function in a decentralised, distributed style, allowing numerous clients and high volumes of communication to access a single Cloud server simultaneously. Owing to the Raspberry Pi’s general-purpose input/output (GPIO) digital I/O, plus I2C and SPI protocols used to connect to sensors, a foundational grasp of configuring applications on this unit is readily transferable to setting up the ITPMS.
The Raspberry Pi offers several methods for reading an external quantity via a GPIO pin, with the best choice depending on the specific sensor and the electronic interface in use. One prominent downside of the Raspberry Pi is the lack of a native Analog-to-Digital Converter (ADC). Because of this, whenever an analogue sensor is selected, converting the captured signal from analogue into a digital representation becomes unavoidable. The introduction of an Arduino Mega microcontroller for Analogue-to-Digital Conversion was deemed necessary for the present work, and it is set up to process incoming signals from analogue sensors, including rotary potentiometers and GPS modules. The inclusion of this extra board broadens the system’s capabilities, allowing the sensor to be folded in without difficulty.
Figure 2 presents a comprehensive schematic of the electronic hardware assembly. The tractor carries proximity sensors tasked with capturing forward speed together with drive-wheel slip. These sensors are wired to an Arduino microcontroller via a resistive divider network formed by 4 kΩ and 10 kΩ resistors. This arrangement is essential, since the proximity sensors output a 12 V signal that exceeds the 5 V limit the microcontroller’s input pins can tolerate. A rotary potentiometer is joined to the pivot shaft of the tractor’s rocker arm to log the depth of tillage. The use of a GPS module helps estimate average forward speed and determine the tractor’s geographic coordinates. The load cells designated for draught force sensing are mated with HX711 breakout boards. Each of the sensors described above feeds its readings into the Arduino Mega, which then transmits them across a USB link to the Raspberry Pi.
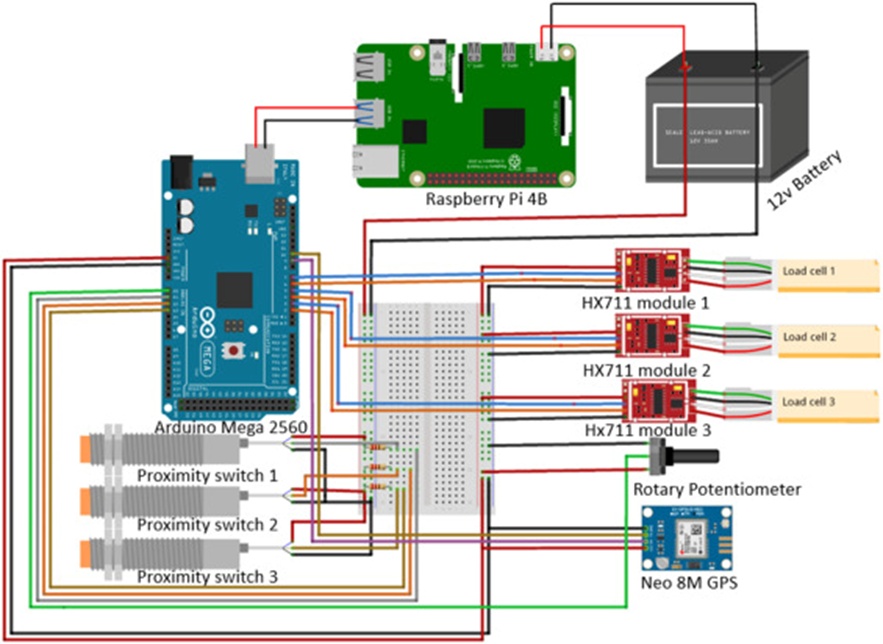
Figure 2. Circuit diagram of electronic components.
The Raspberry Pi single-board computer serves as the primary controller and data-handling hub for the entire setup. It runs on a Linux platform and executes a Python routine that fetches data from the Arduino, performs necessary calculations and interpretation, and subsequently forwards the processed data to a web server via Wi-Fi. JavaScript is used to produce browser-rendered graphical displays from information residing on a Cloud server, which authorised users can view from any location via a web interface and a mobile application.
An instrumentation package was engineered and retrofitted to a New Holland 3630 (31 kW) 2WD tractor to measure the vital performance characteristics of the tractor-implement pairing. The tractor is propelled by a 4-stroke, water-cooled, direct injection (DI) 3-cylinder diesel power unit. This instrumentation package was used for all experimental trials conducted within the scope of the present study. The tractor’s external outline stands at: length 3710 mm, width 1780 mm, and height 2490 mm. Its engine produces a rated torque of 314 Nm while revolving at a rated speed of 1200 rpm. The tractor weighs 20.20 kN and is equipped with bias-ply tyres. The front tyres measure 6–16, and the rear tyres 16.9–28.
The instrumentation package comprises numerous elements, including a Raspberry Pi 4B microcomputer that handles data from the Arduino and sends it to a web server. An Arduino Mega 2560 microcontroller runs the processing algorithm. A GPS sensor is used to gauge the average forward speed and pinpoint the tractor’s location. Proximity sensors are deployed to log forward speed and drive-wheel slip. A rotary potentiometer performs tillage depth recording, and a three-point hitch dynamometer senses draft force.
Table 1 compiles the specifications of the different sensors and modules used to construct the system. The choice of these specific sensors was governed by factors such as accessibility, operational simplicity, user convenience, affordability, and proven measurement trustworthiness. The layout depicting how sensors/transducers are placed across the tractor body is shown in Figure 3. The fitting procedure and the principles of operation underpinning each sensor are unpacked in the subsections that follow.
Table 1. Specifications and function of the sensor module used in the Instrumented Tractor-implement combination.
Sensor module | Model/Manufacturer | Country | Specifications | Quantity | Function |
Raspberry Pi | 4B/Sony | United Kingdom | • Equipped with a quad-core 64-bit ARM Cortex-A72 processor operating at 1.5 GHz • Includes 4 GB LPDDR4 RAM • Supports Bluetooth 5.0 with BLE | 1 | • Used for transmitting data to the web server |
Arduino | Mega 2560/Arduino | Italy | • Provides throughput of up to 16 MIPS at 16 MHz • Contains 4 kB EEPROM memory | 1 | • Executes and processes different algorithms |
GPS sensor | NEO 8M/u-blox | Switzerland | • Receiver type: 50-channel GPS L1 (1575.42 MHz) • Horizontal positioning accuracy: 2.5 m • Capture time: 27 s for cool start and 1 s for hot start | 1 | • Acquires the geo-location of the tractor |
Load cell | MN-TC55/Monad Electronics | India | • Operates on a strain-gauge full-bridge measurement principle • Load capacity: 20 kN • Rated output: 2.0 mV/V | 3 | • Measures draft force |
Proximity switch | PR18–8DP/Autonics | India | • Inductive proximity switch type (PNP-NO) • Sensing distance: 8 mm • Outer diameter: 18 mm • DC supply voltage range: 10–36 V • Maximum load current: 200 mA | 3 | • Measures forward speed • Calculates wheel slip |
Rotary potentiometer | P231-FC20BR10K/TT Electronics | United Kingdom | • Resistance value: 10 kΩ • Tolerance: ±5% | 1 | • Measures tillage depth |
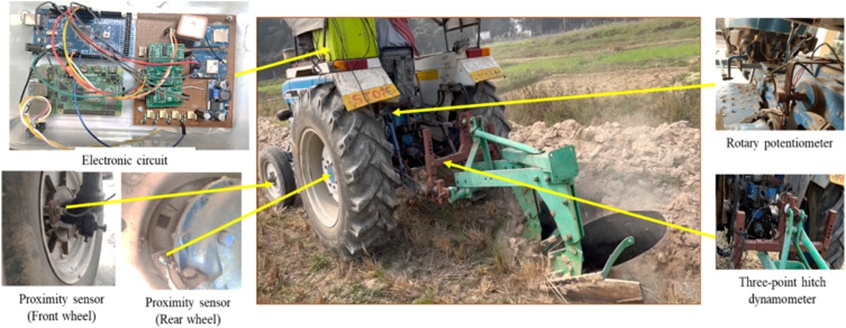
Figure 3. Instrumented tractor.
The rear wheels supply the foundation for resolving the tractor’s theoretical speed after accounting for slip, whilst the front wheel delivers the reading for the actual velocity. A set of three proximity sensors was used to pin down both the actual and theoretical speeds [17]. The detailed technical profiles of the proximity sensors utilised are available in Table 1. For the purpose of sensing theoretical speed, two proximity sensors were positioned. One sensor was mounted on the left-side final drive housing of the rear axle to measure the theoretical speed of the left wheel. In contrast, the second was fixed upon the right-side final drive housing to register the theoretical speed of the right wheel. In addition, one proximity sensor was mounted on the kingpin rod of the front wheel assembly to measure the actual speed.
The tractor’s theoretical speed was worked out with the help of a matching pair of mild steel rings, each measuring 60 mm across. Both rings were furnished with eight spokes, each extending outward by 50 mm. These prepared rings were fastened onto the interior face of the rear wheels, preserving a fine 2 mm gap between the sensor tip and the passing spokes, as represented in Figure 3. The actual speed, on the other hand, was obtained from a larger mild steel ring, 130 mm in diameter and also fitted with eight spokes of 50 mm height. This ring was fastened to the front wheel rim, maintaining a 3 mm separation between the sensor and the spokes, as shown in Figure 3.
Each occasion a spoke intersected the sensing zone of the proximity sensor, an electrical pulse was triggered and logged by the Arduino microcontroller. Within the span of a single complete rotation of the wheel, the proximity sensor emitted a succession of eight pulse signals. These pulses were then converted to corresponding velocity values by applying Eqs. 1–3 for the computation of the theoretical speed of the rear left wheel, the theoretical speed of the rear right wheel, and the actual speed, in that order.
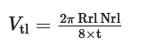 (1)
(1)
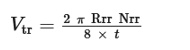 (2)
(2)
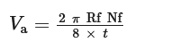 (3)
(3)
Where, Vtl denotes the theoretical speed of the left rear wheel, Rrl stands for the rolling radius of the left rear drive wheel, Nrl represents the counted number of pulses produced within time t by the proximity sensor placed on the rear left wheel, Vtr denotes the theoretical speed of the right rear wheel, Rrr stands for the rolling radius of the right rear drive wheel, Nrr represents the counted number of pulses produced within time t by the proximity sensor placed on the rear right wheel, Va denotes the actual speed of the tractor, Nf represents the counted number of pulses produced within time t by the proximity sensor placed on the front wheel, and Rf stands for the rolling radius of the front wheel. The left- and right-wheel slips of the tractor were derived using Eqs. 4 and 5 accordingly, as appended further below.
 (4)
(4)
 (5)
(5)
The act of measuring tillage depth drew upon a 10KΩ rotary potentiometer that was mechanically linked to the rocker arm embedded within the tractor’s hydraulic circuit [11]. This potentiometer converted the rocker arm’s downward vertical displacement into corresponding rotary motion, indicating tillage depth. A software routine was written to digitise the potentiometer’s output voltage, and the signal line was connected to the Arduino microcontroller’s Analog pin A0.
In the interest of fidelity, the potentiometer’s output voltage underwent calibration against a known range of rocker arm positions. The resulting calibration curve, depicted in Figure 4, maps the relationship between the potentiometer’s output voltage and the imposed tillage depths.
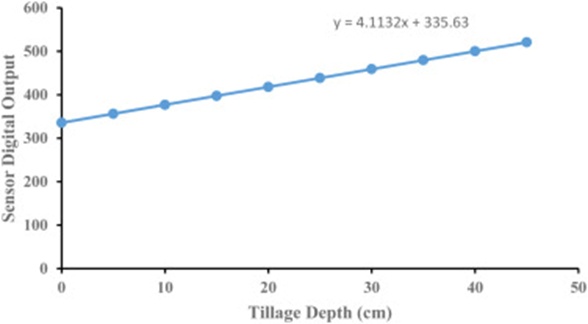
Figure 4. Calibration graph of the rotary potentiometer for tillage depth measurement.
Draft signifies the horizontal towing force that acts along a path parallel to the direction of travel. During this investigation, the draft of the agricultural implement was measured using a three-point linkage dynamometer with an adaptable frame and integrated load cells. The three-point hitch dynamometer utilised here (Figure 3) was conceived by Tewari et al. [38] at the Agricultural and Food Engineering Department, Indian Institute of Technology (IIT) Kharagpur, India.
This dynamometer integrates a pair of tension load cells and a single compression load cell to detect and resolve draft, as shown in Table 1. The two load cells on the lower link arms were calibrated for tensile loading. In contrast, the load cell on the top link was calibrated for compressive loading. Each of the three sensing elements showed a strong linear response across the entire range of imposed loads.
The net draft force (D) required to haul the tillage implement through the ground is determined by means of Eq. 6:
 (6)
(6)
Where:
D = draft, kN
Fμ1 = tensile force picked up by the load cell housed in the left lower link, kN
Fμ2 = tensile force picked up by the load cell housed in the right lower link
Fσ = compressive force picked up by the load cell housed in the top link
The tractor’s spatial position while operating under field conditions is established via the GPS module, the particulars of which appear in Table 1. This GPS module passes through a warm-up phase lasting 2-4 seconds after powering on, after which it begins receiving satellite-derived information on longitude, latitude, time, date, and speed. Thereafter, it feeds this stream of data to the microcontroller at a refresh rate of 1 Hz.
This section describes the web interface assembled using open-source software components. The interface has been engineered expressly to track the operational behaviour of an instrumented tractor. It is built on JavaScript and Hypertext Markup Language (HTML), with a Firebase database serving as the back-end. The frontend technologies are responsible for building the slice of a web application that the user interacts with directly, culminating in a graphical user interface (GUI).
The GUI build-up comprises three cornerstone elements: HTML, Cascading Style Sheets (CSS), and JavaScript. HTML forms the underlying scaffold of the webpage, while CSS handles the visual presentation layered on top. JavaScript, functioning as a scripting language, injects programmatic logic and interactive features into the webpage. These building blocks are brought together to craft the code needed to assemble the intended web interface for the Instrumented Tractor Performance Monitoring System.
In parallel, the Android-based mobile application was developed using Android Studio (version 3.1). Android Studio is a software development environment tailored for developing applications that run on the Android operating system.
The experimental field programme was conducted at the Agricultural Research landholding belonging to the Agricultural and Food Engineering Department, IIT Kharagpur, India, within a purpose-marked test strip. The test site exhibited even topography and a soil profile classified as sandy clay loam. For the trial layout, a test strip measuring 30 m by 10 m was adopted. Before running the trials, soil properties, including mean moisture content and bulk density, were measured at five randomly distributed sampling points. The uppermost soil horizon, extending to 30 cm, had a mean moisture content of 11.50% (db) and a bulk density of 1.23 g/cm³. A mounted-type mouldboard plough, spanning 60 cm and carrying two mouldboard bottoms on a shared toolbar, was deployed in the field to subject the instrumented tractor to real working conditions. The implement was brought into level alignment by jointly manipulating the tractor’s top link and the lower lift arms to suppress parasitic forces. The tractor, the mouldboard plough, and the newly constructed monitoring system all underwent a thorough pre-trial once-over at the base station.
While the experiments were in progress, the plough’s tillage depth was altered across three separate prescribed levels—specifically 10 cm, 15 cm, and 20 cm—inside the marked trial strip. Before rolling into the main experimental section, the lever that positions the three-point linkage was operated to lower the implement to a ploughing depth consistent with the selected tillage level. After setting the depth, the tractor was driven at 3 km/h through the predetermined gear selection, with the engine rotational speed set to the manufacturer’s recommendation. Providing a practice lead-in area ahead of the principal test strip allowed the operator to dial in any necessary adjustments to both the working depth and the forward travel rate until a settled, steady-state condition was reached. The experimental readings were observed in real time and stored via the ITPMS web interface and mobile application. The dataset collected from the experimental programme was then used to assess how effectively the developed system measured the instrumented tractor’s performance parameters.
The purpose behind the statistical evaluation, which made use of the data harvested during the field trials, was twofold: to single out faulty or outlying data points brought about by sensor disturbances under dynamic field operation, and equally to investigate the degree of data spread to assess the measurement consistency of the system that had been built. In an effort to keep potential sources of experimental error to a minimum, every trial condition was replicated three times; the resulting readings were then averaged, and a suite of statistical indicators was computed covering the mean (M), standard deviation (SD), coefficient of variation (CV), and coefficient of non-uniformity (CNU) by employing Eqs. 7–10, taken in sequence.
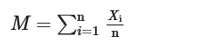 (7)
(7)
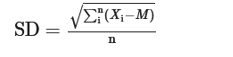 (8)
(8)
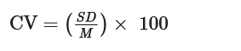 (9)
(9)
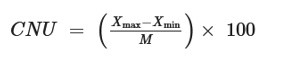 (10)
(10)
The web interface, devised to offer live performance tracking of instrumented tractors, becomes accessible by entering the web location (https://tpms-aba71.web.app) within any standard internet browser. Figure 5 reproduces the landing view of the browser-based interface, which displays data gathered from each sensor while the system is in active use. By selecting the “General Graphics” tab, users can display an actively refreshing graphical chart for the selected sensor (Figure 6a).
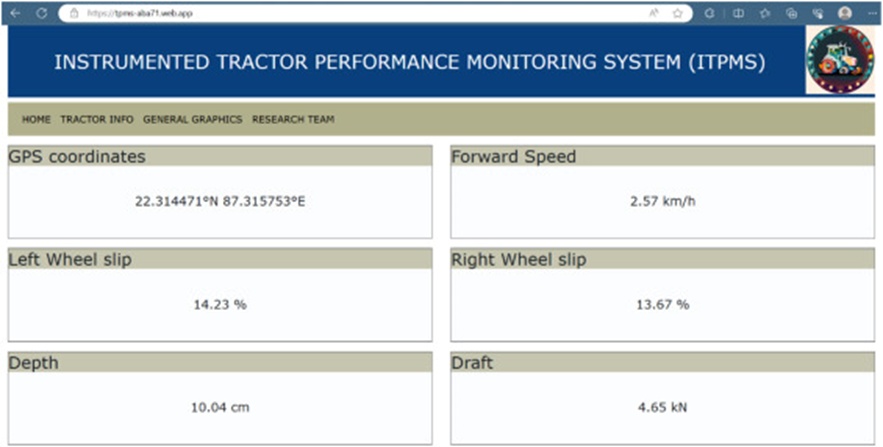
Figure 5. Real-time data monitoring of the instrumented tractor’s performance parameters on the web interface.
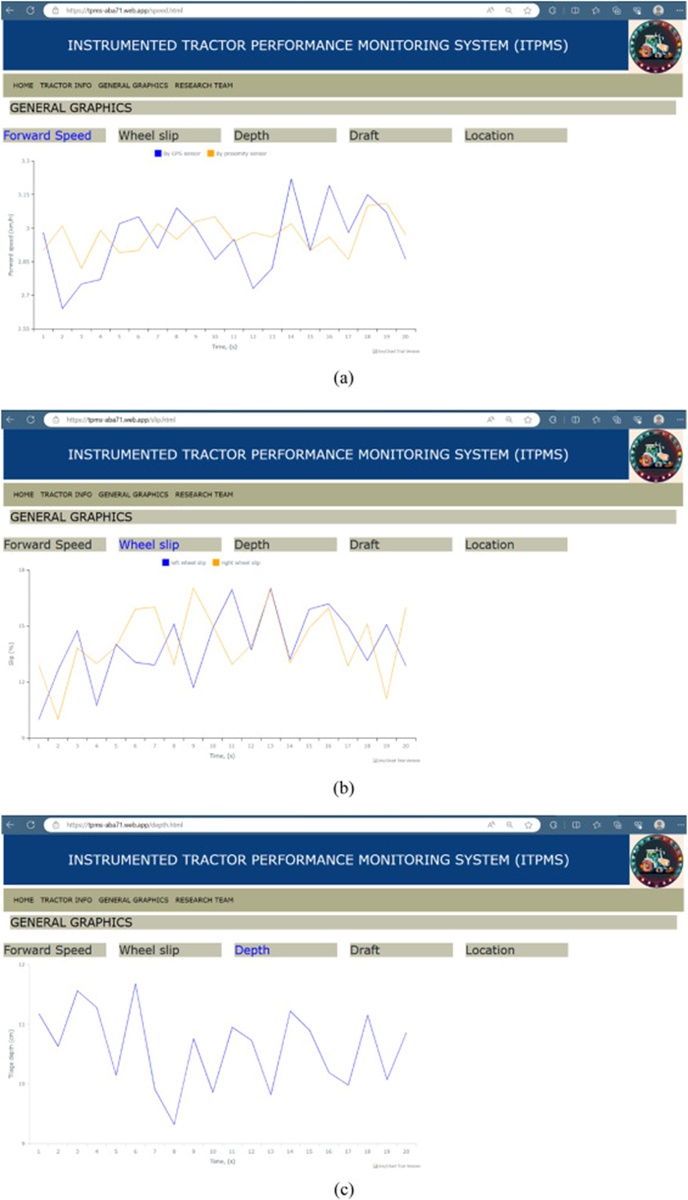
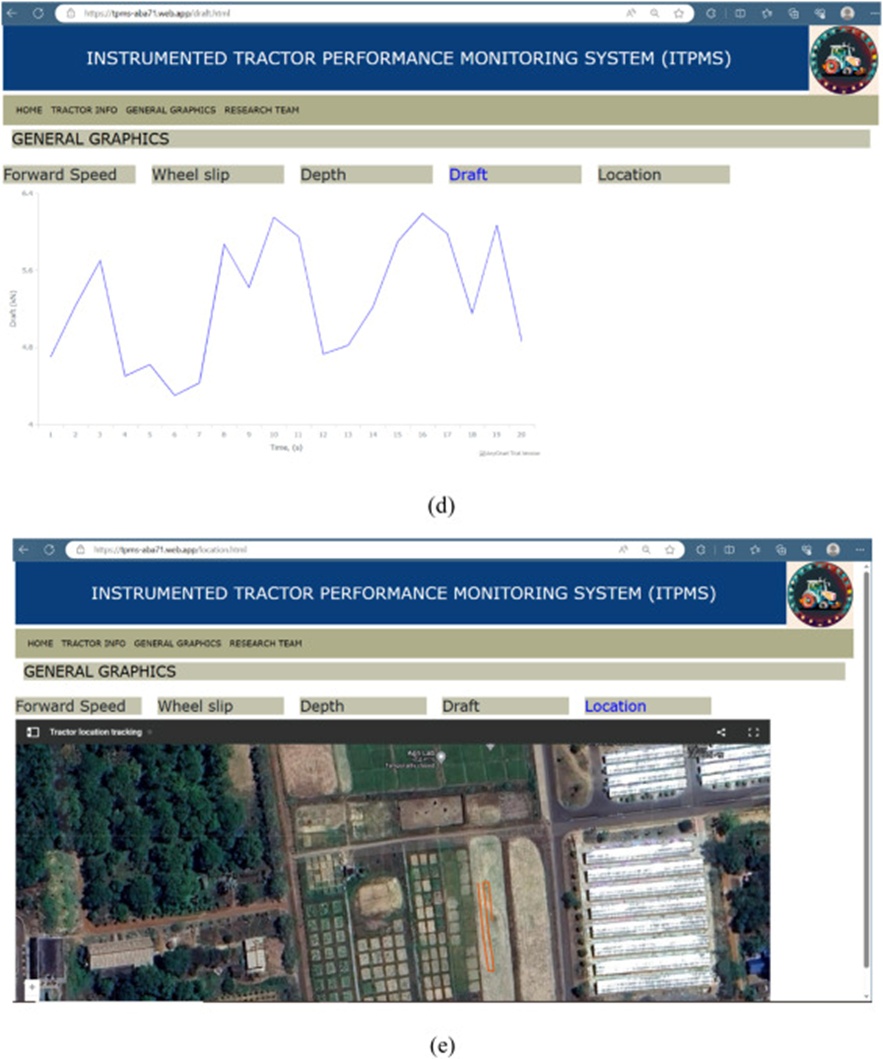
Figure 6. Real-time graphics of the instrumented tractor’s performance parameters on the developed web interface: (a) forward speed, (b) wheel slip, (c) depth, (d) draft, and (e) location.
Beyond the sensor readings already mentioned, information from interrelated sensors is also rendered. For example, selecting the “wheel slip” view displays both left- and right-wheel slip profiles over time (Figure 6b). Figure 6c shows the trace of tillage depth measurements captured in real time, plotted as a function of elapsed time. The draft load sensed by the dynamometer during fieldwork, plotted over time, is shown in Figure 6d. The on-screen presentation refreshes the selected sensor’s readout once per second. The finished system enables users to access data stored in the online database via a web interface or a mobile application.
The home-built webpage uses a dedicated Google Maps API key and the Google Maps class provided by Google. This feature lays out the positional coordinates that locate the tractor. The web application developed during this work fetches live tractor position data from a web server. It displays it on a Google map embedded directly within the application, as illustrated in Figure 6e.
Built on the Android platform, the ITPMS application (Figure 7) was utilised to track the performance parameters of an instrumented tractor. Four core modules make up the application: (a) authentication, (b) home, (c) tractor info, and (d) general graphics. Through the authentication module, users gain entry to the assigned device database. Upon gaining access, the application pulls all necessary data and renders it on the interface. The home module equips users with live performance tracking of the tractor. The graphical interface presents information across multiple visual layouts, including tables and charts. Beyond this, the application lets new users create an account by entering the required information.
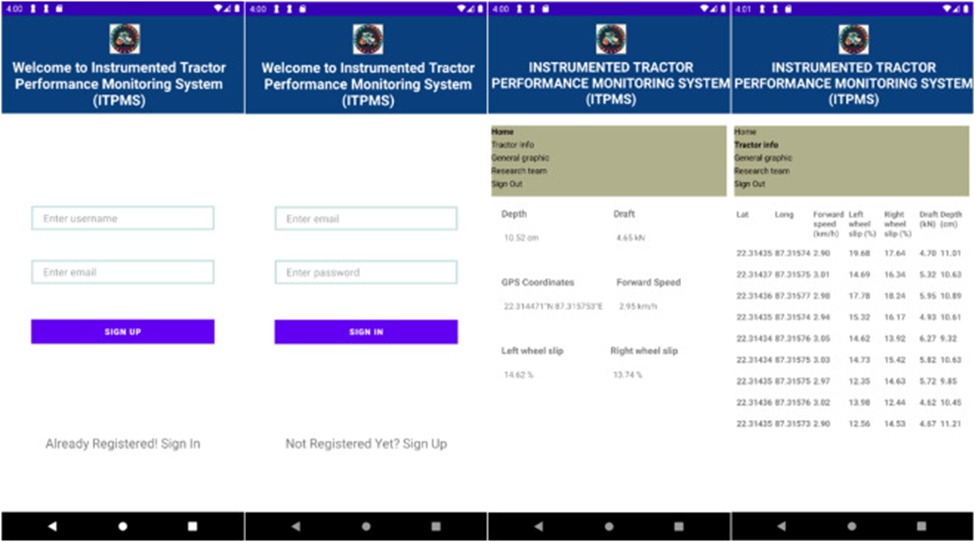
Figure 7. Android application user interface for monitoring of the instrumented tractor performance.
A statistical summary of several tractor performance indicators—mean, standard deviation, minimum, maximum, coefficient of variation, and coefficient of non-uniformity—is given in Table 2. Data were logged at three predefined tillage depths: 10 cm, 15 cm, and 20 cm. The measured indicators cover forward speed, wheel slip, tillage depth, and draft force. Outcomes indicate that every parameter’s coefficient of variation sits inside the standard span of 20 % around the mean. Under actual field operating conditions, such fluctuations are anticipated. The results indicate that the implemented ITMPS system had no meaningful adverse effect on the sensor signals.
Table 2. Statistical description of tractor-mouldboard plough performance parameters measured in field assessment.
Operating parameter | Measurement source | CNU (%) | CV (%) | Maximum | Minimum | Standard deviation | Average |
Preset tillage depth: 10 cm | |||||||
Travel speed (km/h) | Proximity sensor | 13.56 | 3.73 | 3.13 | 2.73 | 0.11 | 2.96 |
GPS sensor | 19.40 | 5.32 | 3.22 | 2.64 | 0.16 | 2.99 | |
Wheel slip (%)* | Left rear wheel | 57.99 | 18.45 | 17.20 | 9.63 | 2.41 | 13.06 |
Right rear wheel | 62.15 | 20.12 | 18.30 | 9.85 | 2.74 | 13.59 | |
Actual tillage depth (cm) | — | 45.48 | 8.58 | 12.16 | 9.17 | 0.91 | 10.62 |
Draft requirement (kN) | — | 28.14 | 16.20 | 6.79 | 4.30 | 0.89 | 5.47 |
Preset tillage depth: 15 cm | |||||||
Travel speed (km/h) | Proximity sensor | 13.36 | 4.53 | 3.10 | 2.72 | 0.13 | 2.89 |
GPS sensor | 21.92 | 7.93 | 3.26 | 2.62 | 0.23 | 2.93 | |
Wheel slip (%)* | Left rear wheel | 57.84 | 17.69 | 18.30 | 9.68 | 2.63 | 14.90 |
Right rear wheel | 55.37 | 16.23 | 18.43 | 10.37 | 2.36 | 14.55 | |
Actual tillage depth (cm) | — | 19.22 | 6.12 | 16.60 | 13.68 | 0.93 | 15.19 |
Draft requirement (kN) | — | 28.13 | 8.83 | 8.75 | 6.62 | 0.67 | 7.56 |
Preset tillage depth: 20 cm | |||||||
Travel speed (km/h) | Proximity sensor | 14.04 | 4.28 | 3.12 | 2.71 | 0.13 | 2.93 |
GPS sensor | 21.44 | 5.53 | 3.26 | 2.62 | 0.17 | 2.99 | |
Wheel slip (%)* | Left rear wheel | 59.84 | 19.86 | 18.04 | 9.66 | 2.78 | 14.00 |
Right rear wheel | 58.66 | 20.13 | 18.68 | 10.20 | 2.91 | 14.46 | |
Actual tillage depth (cm) | — | 10.50 | 2.81 | 20.89 | 18.80 | 0.56 | 19.90 |
Draft requirement (kN) | — | 32.61 | 9.72 | 10.94 | 7.86 | 0.92 | 9.47 |
⁎ Calculated from actual and theoretical speed measurements.
Across the three tillage depths, the mean values closely align with their preselected equivalents. The small mismatch evident can be attributed to the tractor’s oscillatory behaviour throughout the field runs—triggered by surface unevenness. The average tractor speed over all three test zones stays almost constant.
The direction of change in mean draft force matches what theory predicts. Raising the implement depth results in a corresponding increase in draft force. Notably, the captured data agree with previously documented draft measurements [18].
The observed spread across all parameters remains within anticipated bounds and aligns with field realities. As shown, the system can detect minor fluctuations across all tractor parameters.
Notwithstanding the strong potential of the Raspberry Pi-based IoT system for live tractor performance tracking, several constraints warrant attention. Stable internet access is vital for sending data, which may prove difficult in isolated locations. Environmental conditions such as temperature extremes and dust can degrade sensor performance, and an uninterrupted power supply is required for continuous operation. Blending with current farm management software and ensuring operability across diverse tractor models may require additional tailoring. Even with these constraints, the on-ground value of this research for forward-looking farmers is considerable. Delivering live data on essential performance metrics allows users to spot developing problems before they turn into machinery breakdowns; the system thus helps avert idle time and expensive fixes.
Future development of the Raspberry Pi-based IoT platform for live monitoring of an instrumented tractor includes a range of upgrades and broadening efforts. A central avenue of inquiry will be embedding advanced analytics and machine learning models into the platform. This step can support refined data interpretation and predictive maintenance, equipping the system to learn from stored monitoring records and thereby improve the precision of performance forecasts. In turn, this will better guide the choice and fine-tuning of tractor-implement pairings. Alongside this, work may focus on boosting the system’s energy performance and reducing its total cost, making the solution more scalable and accessible for wider deployment. Linking with other agricultural IoT frameworks can likewise be pursued to forge a more unified and holistic farming toolkit.
This investigation showcases the effective implementation of a live Instrumented Tractor Performance Monitoring System (ITPMS) that harnesses Internet of Things (IoT) capabilities. The assembled system brings together an array of sensing units—namely, a GPS sensor, proximity sensors, a rotary potentiometer, and a three-point hitch dynamometer—linked to a Raspberry Pi unit and a cloud-hosted data-handling platform. This integration pathway enables the capture, transfer, and storage of sensor-derived data.
To improve the user experience, independently crafted interfaces for web and mobile platforms enable clear, effective data rendering in their respective environments. The setup underwent stringent field testing to gauge and monitor the operational metrics of tractor-implement combinations in variable field conditions. Outcomes confirmed the successful tracking of the targeted performance metrics, with sensor accuracy staying dependably within permissible limits. The engineered system is notable for its compact, transportable, and lightweight design, enabling straightforward relocation between tractors with minimal hardware reconfiguration. It provides instant, actionable intelligence on a range of tractor working parameters, equipping progressive farmers, custom hire operators, and researchers to make well-founded decisions about machinery use. Furthermore, it stands as an essential diagnostic means for flagging nascent problems before they escalate into outright failures.
As a whole, this Raspberry Pi-centred IoT solution marks a meaningful step forward in tractor performance surveillance. Its prized characteristics of adaptability, dependability, and ease of use aid in streamlining farm operations and improving overall output.
None
None
None
None
Open Access The author(s) retain copyright. This article is licensed under the Creative Commons Attribution-NonCommercial-ShareAlike 4.0 International License. It may be shared and adapted for non-commercial purposes with appropriate attribution, an indication of changes, and distribution of adaptations under the same license. Third-party material may be subject to separate terms identified in its credit line. View the license at https://creativecommons.org/licenses/by-nc-sa/4.0/.
 Agro Intelligence Research Press