The light-trap attraction rate (LTARI) constitutes a critical parameter for delineating diel activity profiles and underpins work in insect behavioral ecology and pest suppression. Nevertheless, mainstream automated light-trap apparatuses commonly employ destructive methods (e.g., electrified meshes or thermal irradiation), resulting in substantial losses of non-target organisms and markedly impairing image quality due to carcass accumulation. These shortcomings disturb indigenous assemblages and thwart attempts to measure LTARI. Our central objective is to engineer and appraise a non-lethal recording framework to serve as a technical substrate for subsequent LTARI inquiry, rather than to conduct direct quantitative benchmarking against orthodox traps. To remedy the shortcomings outlined above, we present a live-specimen recording instrument that merges a wind-aspiration collector with a Water-Flow Dispersion and Transport Structure (WF-DTS). The harmless trap–disperse–release pipeline curbs body layering, enables the return of captured creatures to the wild, and yields a community-scale post-collection survival fraction of 94% under the tested regime. Empirical data demonstrate that the prototype safeguards picture coherence featuring unambiguously separated single organisms and realizes a recognition score of 95.6% ([email protected]) employing the YOLOv8s architecture. During inference, only the built-in resizing and standardization routines of YOLOv8s are invoked, without supplementary noise filtering, background removal, or synthetic sample inflation. These findings indicate that the WF-DTS yields snapshots that are inherently more amenable to partitioning and identification than those from legacy equipment. The elevated recognition fidelity is predominantly ascribed to the mechanical splaying of individuals and the homogeneous, pale-matte arena provided by the hardware blueprint. Taken as a whole, the ensemble embodies a harmless hardware–software apparatus apt to trim downstream analytical burdens and provide methodological groundwork for enhanced LTARI calculation in prospective, purpose-built field exercises.
The light-trap attraction rate (LTARI) of insects captures how the number of organisms attracted to a luminous source changes over time. LTARI can control time-activated actuation/deactivation and spectral refinement of emitters, boosting the potency of targeted pest abatement. It can likewise reduce bycatch and support the tracking of entomological diversity [1]. Self-operating mechatronic units for arthropod picture harvesting stand as a pivotal innovation in this arena. Extensively distributed across farming landscapes, they facilitate outbreak anticipation and demographic surveillance and deliver valuable inputs for holistic pest governance and precision cultivation [2].
Prevailing mechanized insect surveillance contraptions normally hinge on deadly entrapment and stockpile cadavers ahead of photography. These failings distort the basal communal composition and erode graphical sharpness, sapping the reliability of any LTARI-centric deductions based on such records. Beyond classic light-baited configurations, an expansive assortment of mechanized arthropod-tracking methodologies has emerged internationally, covering detector-based snares, camera-laden observation suites, and inexpensive diode-based luminous lures for habitat sampling [3-5]. Still, many of these frameworks continue to rely on fatal harvesting, a practice that can skew plenitude estimates. Furthermore, picture-dependent gadgets habitually struggle to shield and correctly sort when multiple subjects clump or cling to snare exteriors, particularly in open-air conditions.
In this paper, LTARI is treated not as a concluding variable but as a background for the apparatus configuration. The nucleus of this endeavor is the crafting and validation of a non-fatal, high-verisimilitude observational scaffold capable of providing the procedural underpinning for prospective LTARI explorations within authentic field milieus.
Strides and bounds of arthropod surveillance know-how. Insect surveillance forms the bedrock of modern all-embracing pest husbandry. Over the preceding decades, the discipline has seen significant technical advances, prompting the widespread deployment of numerous surveillance systems in agricultural contexts. That said, present-day schemes differ considerably in their operational principles, precision, and environmental footprint. To methodically marshal these contrasts and spotlight lingering lacunae, Table 1 furnishes a side-by-side digest of prevailing insect-tracking modalities, typing them and condensing their merits, demerits, and pertinence to LTARI-tied scholarship. Contemporary overviews and instance analyses have concurrently shed light on both the promise and the curbstone constraints of mechanized camera-bearing snares for vermin vigilance, notably regarding goal discrimination and prolonged durability afield [3, 4].
Off-the-shelf arthropod recording appliances and their curbstone constraints. The swelling appetite for pest detection has hastened the commercial spread of robotic insect-identifying illuminators, particularly in China, where a multitude of enterprises nowadays purvey such wares (characteristic examples are listed in Table 2). A piercing dissection of these commercial contrivances lays bare an all-pervading curbstone constraint: a distinct drift toward operational sameness pivoting on deadly capture. The ruling design precept relies on annihilating insects before imagery acquisition, a mode inherently discordant with the axioms of lasting pest regulation by extinguishing beneficial fauna and barring long-term behavioral probing. This blanket resort to exterminatory measures flags a pragmatic chasm in the extant marketplace, which the current exploration aspires to illuminate by way of an archetypal non-deadly substitute.
Methodological chasm in probing insect phototaxic cadences. Apprehending the phototactic cadences of insects is cardinal for unlocking their behavioral bionomics and fine-tuning pest-detection doctrines. The regnant toolset, however, is hemmed by appreciable curbstone constraints. To give examples, Li et al. [6] delved into the light-baited rhythm of Sogatella furcifera within Yunnan Province wielding bug-zapping lamps supplemented by hand tabulation, whereas Wang et al. [7] scrutinized the rhythm of Chilo suppressalis in Harbin by dint of luminous snares and lab-propagated stocks. Analogously, Chen et al. [8] parsed the rhythm of Cnaphalocrocis medinalis inside Jiangsu Province via hand gathering. These procedures slaughter or otherwise substantially unsettle the observed subjects, thus warping or arresting the very behavioural phenomena under scrutiny and falling short of capturing the bona fide on-site rhythmic activity of unrestrained insect multitudes.
Hence, a weighty procedural pinch point stands in the way of our capacity to stage non-disruptive, across-time glimpses of phototaxic conduct within natural biotic networks. The live-creature recording schema proposed in this research is intended to help traverse this divide. By actualizing non-deadly entrapment, self-acting outdoor photo-harvest, and living return of subjects, it provides a workable tool for scrutinizing the unperturbed phototaxic patterns of insect communities embedded within their ecological theatre.
Table 1. The majority of methods for insect monitoring.
Technical category | Advantages | Disadvantages | Research approaches for LTARI |
Armyworm trap plate recognition [9] | Requires relatively low-cost hardware. | Data collection efficiency is low, and results are highly subjective. | Insects must be killed before counting, which reduces the insect population and lowers efficiency. |
Insect sex attractant [10] | The system is eco-friendly and does not harm insects. | The device is limited to attracting only specific insect species. | Population assessment is affected because insects are killed before counting, and identification depends heavily on manual observation, reducing objectivity. |
Insect detection lamp [11] | Provides high detection and recognition accuracy. | Data acquisition quality depends strongly on the quality of front-end images. | Insects are eliminated before counting, resulting in population reduction and inefficient monitoring. |
Insect radar [12, 13] | Capable of effectively monitoring migratory insects across large geographic areas. | The equipment is costly and does not provide intuitive image-based information. | Although the radar can successfully monitor insect population dynamics, it cannot capture image data. |
Sound signal recognition [14] | Features a simple hardware design and easy operation. | Environmental noise significantly affects data collection. | Noise interference during signal acquisition makes it difficult to obtain accurate, reliable LTARI estimates. |
Live insect monitoring [15, 16] | Contributes to preserving insect population integrity. | Captured images may still contain overlapping insects and occlusion issues. | The method is applicable for LTARI estimation, but image occlusion and body overlap remain unresolved challenges. |
Table 2. Product statistics of insect monitoring light traps. N/A indicates that the parameter is not applicable. This product does not involve insecticides.
Company identification | Product model | Recognition technique | Lethal capture |
Yunfei Technology Development Co. (Zhengzhou, China) [17] | YFCB-IV | Uses high-resolution photographic recognition. | Yes |
Ecoman Biotechnology Co. (Beijing, China) [18] | IID-RS | Employs high-definition imaging technology. | Yes |
BEYOND Technology Co. (Chengdu, China) [19] | IID-RD | Relies on automated photographic recognition. | Yes |
Wanxianghuanjing Technology Co. (Jinan, China) [20] | WX-SDX | Uses electronic sensor–based detection. | N/A |
Deshen Electronic Technology Co. (Zhengzhou, China) [21] | IMS-IML | Applies remote photographic monitoring. | Yes |
Senno IoT Technology Co. (Jinan, China) [22] | SN | Integrates automatic photography for recognition. | N/A |
Zhice Yunlian Technology Co. (Qingdao, China) [23] | CTID-RL | Adopts high-definition image capture technology. | Yes |
Yatong Environmental Technology Co. (Nanjing, China) [24] | D-PWIPMS | Utilizes high-definition photographic identification. | Yes |
Bringing the targeted system behaviors to fruition demands surmounting two pivotal engineering obstacles:
- Conception and amalgamation of an unprecedented mechanical layout. The apparatus calls for orchestrated stages of intake, scattering, transit, and benign expulsion—a pipeline rarely encountered among prevailing configurations. Its physical chassis therefore necessitates extensive pioneering design effort, spanning the ideation of subassemblies, the establishment of critical measurements, and the integration of interfacing components, all with a dearth of off-the-shelf templates.
- Crafting of an application-specific multi-function orchestration unit. The on-boarding of vacuum-induced airflow and liquid-borne delivery blocks requires the creation of a bespoke printed circuit board (PCB) and governance backbone to integrate and manage these ancillary functions. The freshly minted PCB and firmware are bound to integrate streamlined operator modules (e.g., ventilation and impeller actuation, energy distribution oversight) and meet rigorous extended-duration outdoor deployment criteria for dependability and tolerance to meteorological vagaries, appreciably compounding the engineering burden.
The central yield of this body of work can be distilled as follows:
- We engineered and materialized a Wind-Suction Attraction Lamp (WSAL) as a stand-in for classic high-voltage exterminating lamp fixtures. The WSAL is engineered to incapacitate and collect specimens without terminating them. By slashing mortality among incidental beneficial arthropods and preserving transient viability of detained organisms within the trialed parameters, this architecture facilitates vital-subject tracking and ethological documentation.
- We unveil a Water-Flow Dispersion and Transport Structure (WF-DTS) capable of isolating and ferrying consecutive specimens in single file toward the imaging station. The moment an organism enters, it is briskly separated from others and borne along by a thin sheet of streaming water. This mechanism puts the brakes on clumping and piling and promotes the gathering of lone-specimen photographs. This blueprint targets alleviating data-quality erosion that habitually plagues standard trap assemblies.
- Through the execution of (1) and (2) and the corroboration of image soundness and short-duration endurance under real-world growing conditions, we reveal that the platform stands to deliver a pragmatic, non-exterminatory foundation for prospective LTARI-driven studies across bona fide farming terrain, thereby feeding into the broader push to curtail methodological skew in ecosystem surveillance.
Time-honored insect-tracking light-baited apparatuses routinely dispatch both designated pest organisms and incidental beneficial fauna alike. A mode of functioning rooted in extermination poses a grave hazard to species richness and the services ecosystems render, cutting against the grain of durable agrarian paradigms [25]. Figure 1 portrays an illustrative legacy automated insect-recording unit alongside specimen pictorial output gathered under fatal entrapment regimes. Figure 1a exhibits an insect-tracking luminous trap, and Figure 1b supplies representative captures yielded by that unit. Its operational rationale rests on a night-time phototactic pull to summon insects, which are subsequently dispatched and rendered into images.
![Figure 1. The automatic mechatronic device for insect image collection: (a) An insect monitoring light trap; (b) The image captured by the device (Source: The image is sourced from the dataset published by Wang et al. [26]).](https://pubsys.eshragh.co/storage/files/pub-article/dde329ab-d49a-4ec7-b600-f99aa7f5ff96-iICdYDKOechW0BZ4/image.jpg)
Figure 1. The automatic mechatronic device for insect image collection: (a) An insect monitoring light trap; (b) The image captured by the device (Source: The image is sourced from the dataset published by Wang et al. [26]).
Even so, this pervasively adopted technique is beset by three root-level infirmities:
Piling of specimen bodies. Cadaveric material accumulates in the capture chamber well before photography, culminating in severe heaping and mutual obscuration. The upshot is an impoverished snapshot quality riddled with a high incidence of superimposed subjects. For context, within the extensively used Pest24 library (n = 25,378), nearly one-half of all frames (46.5%, or 11,802 snapshots) are marred by such blemishes, underscoring how endemic this defect has become [26].
Undiscriminating elimination of non-pest organisms. Fatal luminous snares are by their nature untargeted. A capture exercise documented in Ref. [27] found that although the lion’s share of detained individuals (~85.01%) were classified as intended pest taxa, a non-negligible slice (~14.99%) fell into unintended insect groupings, including beneficial species.
Inability to probe the activity cadence of live insects. Approaches predicated on terminated individuals foreclose examination of the phototactic behavior and circadian rhythmicity of living fauna in their natural milieu. They are hence ill-suited for securing ecologically informative LTARI determinations.
To address the difficulties outlined above, we propose an investigational prototype based on a non-fatal operational flow. The device mates a wind-driven aspiration housing with a Water-Flow Dispersion and Transport Structure (WF-DTS). Arthropods lured by the lamp are softly pulled inside by airflow and, at once, borne off by a fine, traveling sheet of water, effecting physical singulation. A fiber-optic sensing element at the WF-DTS gateway triggers the camera, ensuring that every specimen receives an individual portrait upon entry. This configuration dials down the prerequisites for sticking and agglomeration, smoothing the path toward more reliable harvesting of solitary-subject imagery.
Figure 2 juxtaposes the functional tenets of a legacy automated insect-recording instrument (left-hand panel) with those of the proposed live-specimen observing solution (right-hand panel). The heritage setup relies on lethal entrapment via an electrified grid: specimen corpses accumulate and overlap, yielding pronounced obscuration and impoverished individuation in photographic outputs, whilst the ruinous collection modality bars nuanced probing of live-organism behavior and reshapes population-level dynamics. In contrast, the proposed solution is predicated on non-fatal intake via a combined suction-and-hydrodynamic transport mechanism. Prompt hydromechanical scattering and conveyance effectively forestall specimen accumulation and guarantee that lone-individual pictorial records are obtained. At the same time, this non-destructive extraction spares the native arthropod community, providing a hands-on substrate for investigating authentic phototactic pulsations under field-relevant conditions.
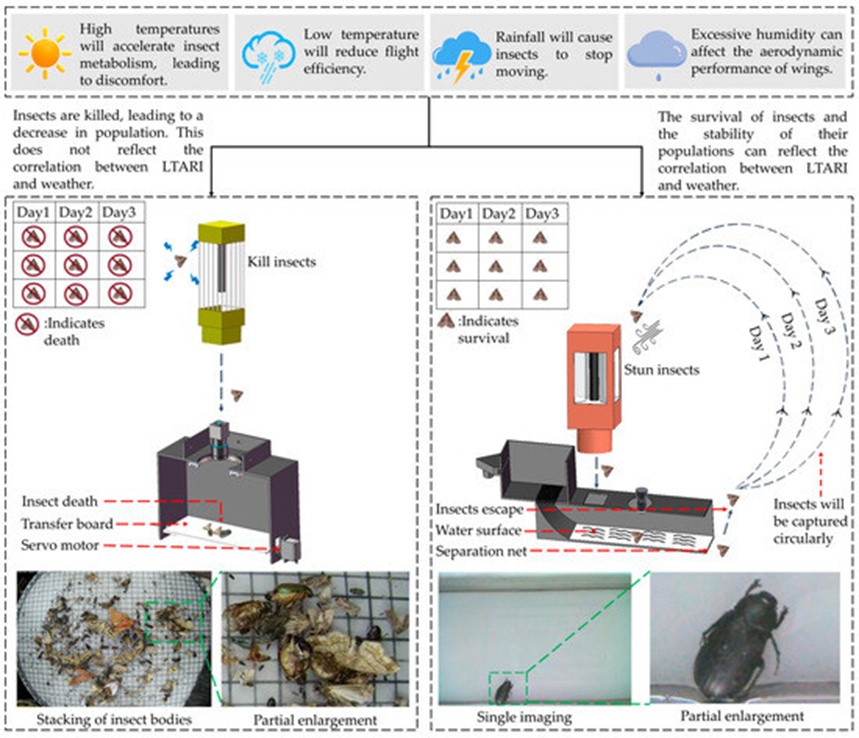
Figure 2. Comparison between a conventional lethal light-trap device (left) and the proposed non-lethal live-insect monitoring system (right).
Given that temporal patterns of activity reconstructed solely from dispatched specimens are irreducibly distorted, the elaboration of non-exterminatory monitoring platforms capable of yielding dependable LTARI models anchored to meteorological and ambient covariates becomes an imperative.
Extending from the system architecture and operating logic elucidated above, a hypothetical application pipeline for LTARI-oriented pest suppression is sketched in Figure 3. Heritage self-operating mechatronic assemblies placed afield for arthropod picture harvesting confront two dogged stumbling blocks: they lack the capacity to parse intentional targets from incidental victims, triggering non-selective annihilation of beneficial forms, and their pictorial outputs habitually suffer from grave deterioration wrought by organism gluing and conglomeration.
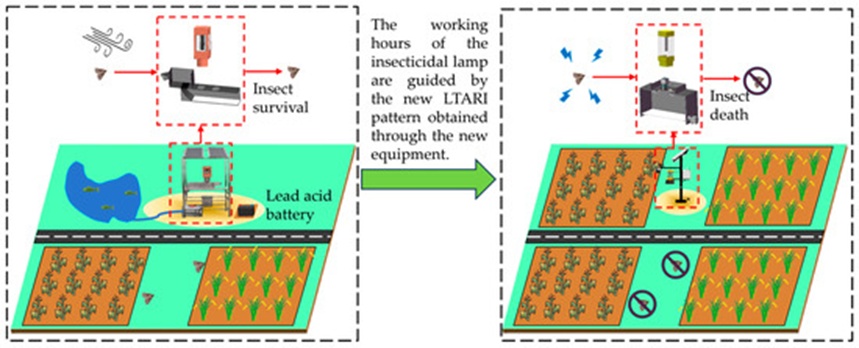
Figure 3. Schematic diagram of the different operating modes of the proposed live-insect monitoring system.
To push past these boundary conditions, we advance a non-fatal arthropod surveillance platform purpose-tuned for deployment inside crop canopies. The setup empowers safe capture, non-tactile segregation, and high-fidelity portrayal of live specimens, thereby nourishing bionomic science while minimizing unintended capture and mortality of non-focal fauna. Within the anticipated operational schema, LTARI-linked signatures harvested by the proposed mechanism are leveraged to fine-tune the operational scheduling of insecticidal emitters, boosting suppression effectiveness while mitigating ecosystem disturbance.
Classical observing hardware can inflict substantial physical injury and demographic depletion on insect assemblages during investigations of diel luminosity-trap attraction patterns. This predicament directly shapes the observation and statistical inference underlying genuine light-trap attraction rate (LTARI) values. In contrast, the proposed non-exterminatory observing framework stands to help curb the toll exacted on local insect collectives and may thereby offer a technical foothold for scrutinizing the phototactic rhythmicity of living insect populations under raw or near-raw environmental conditions.
A full depiction of the hardware skeleton is rendered in Figure 4. Governance is split across two tiers: a primary supervisory processor (MPU) and a secondary executive processor (MCU). The MPU role is fulfilled by a NanoPi M4B, which handles platform-level clock harmonization and task sequencing. Through its network port, it commands overall operation and handles upper-layer functions, including picture capture, on-board archival storage, system health maintenance, and networked data relay.
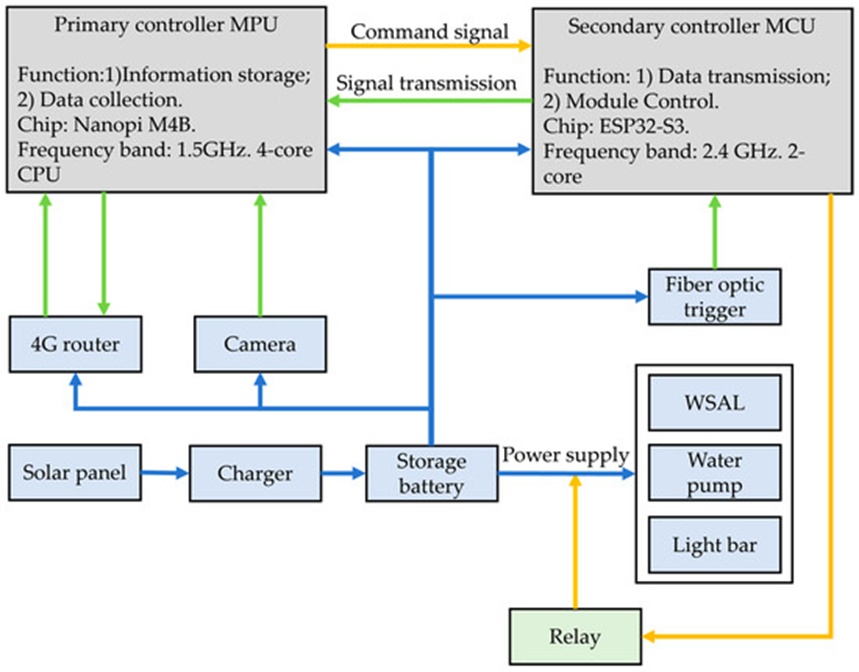
Figure 4. Overall hardware structure diagram of the system (The gray box represents the control unit, the blue box represents the hardware unit, and the green box represents the relay. The yellow line represents the control line, the green line represents the signal line, and the blue line represents the power supply line).
The MCU, built around an ESP32-S3, is tasked exclusively with power distribution and the real-time driving of physical peripherals. It maintains direct electrical contact with every functional block. It executes latency-sensitive routines, such as tracking the water column height and registering specimen entry via the fiber-optic break-beam sensor.
An engineering viability screening was performed to confirm that the WF-DTS concept can withstand real outdoor farming environments, with attention paid to structural robustness, the selection of proven off-the-shelf parts, software reliability, and ease of field maintenance.
The primary enclosure and skeleton are constructed from stainless steel with gasketed closures, providing resistance to rainfall, airborne grit, and prolonged ultraviolet exposure. The internal fluid pathway—spanning the storage reservoir, rotary pump, plumbing channels, and dispersion apertures—forms a recirculating loop, thereby curtailing make-up water demand and blocking the ingress of outside contaminants. The chassis relies on welded joints and standardized connectors rather than precision-machined interfaces, which eases both initial assembly and subsequent repair work in typical farm-equipment workshops.
The electronic building blocks were drawn deliberately from established, high-volume commercial lines. The lure emitter is a standard fixture rated for exterior agricultural deployment; the fluid-drive segment employs a 12 V DC rotary pump; and the visual-recording chain is anchored by an industrial imager held in a straightforward static mount. To define a workable operating envelope, a series of bench-top scoping trials was conducted. These trials served to select the specific model and mounting geometry of the attractant light bar and to bracket a range of flow speeds that reliably propel and singulate specimens without causing tank overflow or excessive droplet ejection. In the interest of cross-regional reproducibility, every electronic module—pumps, transducers, controllers—is described solely by its functional ratings (voltage, current draw, wattage), deliberately omitting manufacturer-specific catalogue codes. This design choice lets practitioners in different locales source locally stocked equivalents that meet the same electrical and hydraulic specifications.
On the software side, the control stack runs on a mainstream embedded platform and is authored entirely in C, a language ubiquitous in both factory automation and agricultural machinery circles. This foundation dodges the fragility sometimes associated with niche or experimental software toolchains and lowers the barrier for troubleshooting and feature expansion by engineers already grounded in conventional embedded development practice. For wide-area connectivity, a 4G modem-router serves as the gateway, leveraging mature cellular network coverage in rural areas to provide consistent bidirectional data throughput.
Initial field shakedowns and concurrent electrical load logging established that the as-built energy buffer and water recirculation topology can sustain multi-night observation campaigns. Under representative conditions, the prototype runs for roughly 2.5 days without solar replenishment, fed by a 90 L closed-circuit water store. Recurring operator intervention involves replacing the sponge filter element every 2–3 days and wiping the optical port as needed due to fouling. Collectively, these outcomes support the practical deployability of the WF-DTS architecture; upcoming refinement cycles will target hardened longevity when subjected to more punishing weather regimes.
The observing platform is composed of a set of cooperating subassemblies, among which the Water-Flow Dispersion and Transport Structure (WF-DTS) serves as the central mechanism for live capture and optical documentation. The WF-DTS fuses directed airstreams, water-driven specimen movement, and electro-optical recording into a unified chain that delivers physical isolation of individuals without recourse to lethal means. First, an in-depth walk-through of the WF-DTS follows, after which the larger mechanical integration is described.
The structural layout of the WF-DTS appears in Figure 5, occupying a volume of approximately 1 m (L) × 0.2 m (W) × 0.2 m (H). The operational logic unfolds as follows: water enters at Location A; insects lured and momentarily disoriented by the WSAL are then swept into the viewing corridor by the subjacent liquid sheet; once a photograph is taken, the specimen exits the unit via the outflow port. The remainder of this passage steps through each labelled location in sequence.
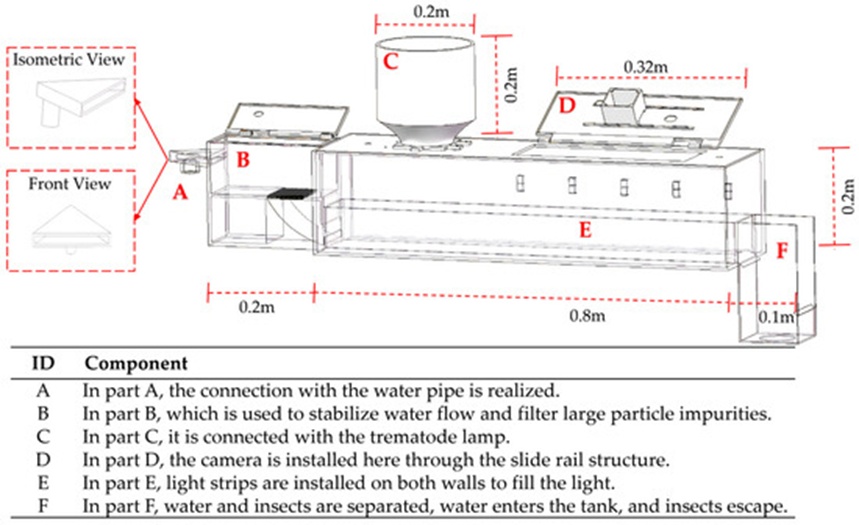
Figure 5. The mechanical structure diagram of WF-DTS.
Location A: Inlet fed by the pump, terminated with a quartet of internal-thread branches and shaped into a duck-foot diffuser. Spreading the incoming vertical column into a laterally distended, shallow horizontal lamina, this geometry broadens the cross-section and gently redirects momentum. The result is a local velocity drop and a sharp reduction in plunging jet penetration and energetic free-surface agitation within the imaging station. A flatter, quieter overlaying water film is thus maintained above the viewing pane, favouring the capture of sharp, evenly lit frames and helping to exclude entrained bubbles and errant splatter that could shroud specimens. Because the flow remains predominantly lateral and mild, insects travel across the camera’s field of regard with minimal jostling, reducing hard strikes against the sidewalls and preserving solo trajectories during image acquisition.
Location B: Conditioning stage containing reticulated filter foam and a bank of densely perforated baffle plates. The foam performs a coarse screening function, keeping suspended solids out of the viewing section, while the baffles act as a flow straightener and energy dissipater, delivering a further degree of hydraulic calm before the stream reaches the imaging pane.
Location C: Interface node with an elongated threaded collar designed to mate rigidly with multiple WSAL body styles, plus a fiber-optic sensing gate fixed below. When a stunned insect traverses the entry throat, it momentarily eclipses the optical pathway. The sensor converts this interruption into a trigger pulse, which is routed to the controller, which then commands the camera to fire.
Location D: Weatherproof camera vault equipped with a purpose-built, demountable slide-rail carriage. This housing seals the imager against the elements, while the slide rail permits tool-free repositioning of the camera’s working distance and inclination. The arrangement simplifies both initial alignment and periodic servicing and shields the lens assembly from humidity and stray water droplets.
Location E: Acquisition zone featuring E-shaped cutouts on the two lateral panels for secure mounting of the illumination ribbon. Affixed to the floor of this zone is a 1 mm-thick matte white substrate that provides a featureless, spectrally neutral backdrop, materially attenuating visual clutter from suspended particles or patterned reflections when imaging target arthropods.
Location F: Terminal separator stage where a wire-mesh ramp set at a 45° incline peels the liquid phase away from the solid specimens just before the discharge port.
Figure 6 lays out the fully integrated mechanical assembly, fabricated from 201-grade stainless steel using sheet-metal forming and joining processes. The envelope dimensions are 2.4 m (H) × 1.3 m (L) × 0.4 m (W). The spatial arrangement brings together:
Location A: A matched pair of photovoltaic panels (each measuring 0.5 × 0.7 m, with a combined peak charging capability of 60 W) that keep the on-board supply continuously topped up.
Location B: The custom-designed WF-DTS module, whose function is to physically isolate specimens and eliminate body-to-body contact during transit and imaging.
Location C: A sealed control enclosure (0.4 × 0.3 × 0.2 m) containing the central logic boards and peripheral drive circuitry, engineered for a compact footprint and a high ingress-protection classification.
Location D: A 90 L reservoir that works in tandem with a 12 V DC pump rated at 1200 L/h to sustain a closed-circuit hydraulic loop.
Location E: A below-grade battery vault constructed from a rugged, waterproof polymer shell and housing a 12 V/80 Ah lead-acid storage cell.
By fusing these subsystems into a single, optimized layout, the device marries non-destructive insect handling with industrial-grade automation, positioning it to deliver stable multi-season service in exposed agricultural settings.
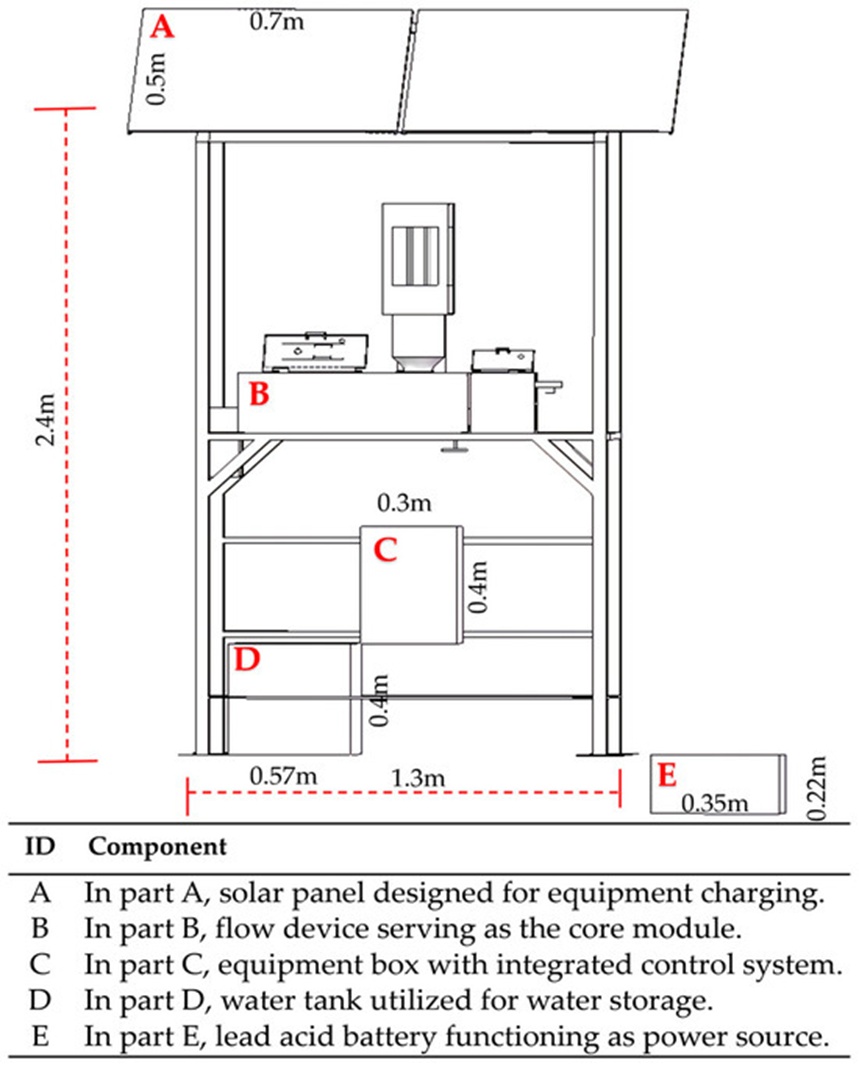
Figure 6. Overall mechanical design of the system.
The functional subsystems—power supply, specimen processing, and machine control—are fused into a unified mechanical whole through deliberate spatial economy and structural refinement. This arrangement targets unwavering performance throughout extended open-air deployment.
Table 3 collects the defining specifications of the apparatus. At the core of the image-capture chain sits the IMX377 photosensitive array. Fluid circulation is handled by a 12 V DC pump with a rated throughput of 1200 L/h at a 3.3 m delivery head.
Table 3. The main parameters of this device.
Type | Parameter |
Camera | Camera model: IMX377 |
Module size: 38 mm × 38 mm | |
Operating temperature range: −20 °C to 70 °C | |
Image resolution: 1920 × 1080 pixels | |
Lens focal length: 4.2 mm | |
Sensor dimensions: 1/2.3″ | |
Water pump | Flow capacity: 1200 L/h |
Maximum head height: 3.3 m | |
Operating voltage: 12 V | |
Power supply components | Solar panel output: 60 W (maximum) × 2 |
Battery type: Lead-acid battery | |
Battery rating: 12 V/80 Ah | |
Approximate operating duration: 48 h |
The interconnection of the hardware elements is illustrated in Figure 7.
Location A: The brain of the unit (NanoPi M4B) assumes responsibility for system-wide time reference distribution, orchestrates still-image acquisition, oversees on-site data buffering and outward data dispatch, and functions as the top-level node that pushes commands to the subordinate processors.
Location B: A 4G modem bay, which establishes the over-the-air pathway shuttling data between the field-deployed unit and the distant server infrastructure.
Location C: The serial bridging block mediates the dialogue pathway connecting master and slave processors while also embedding circuitry that enables unattended firmware flashing and system revision rollouts.
Location D: A purpose-built control stage revolving around the ESP32-S3 microcontroller, assigned to sequenced energizing of peripherals, clock-driven toggling of the Wind-Suction Attraction Lamp (WSAL), and on/off governance of other elevated-power loads.
Location E: The solar regulation hub sits at the nexus of the photovoltaic panels, the storage battery, and the downstream electronics, balancing charging and discharging flows across the entire installation.
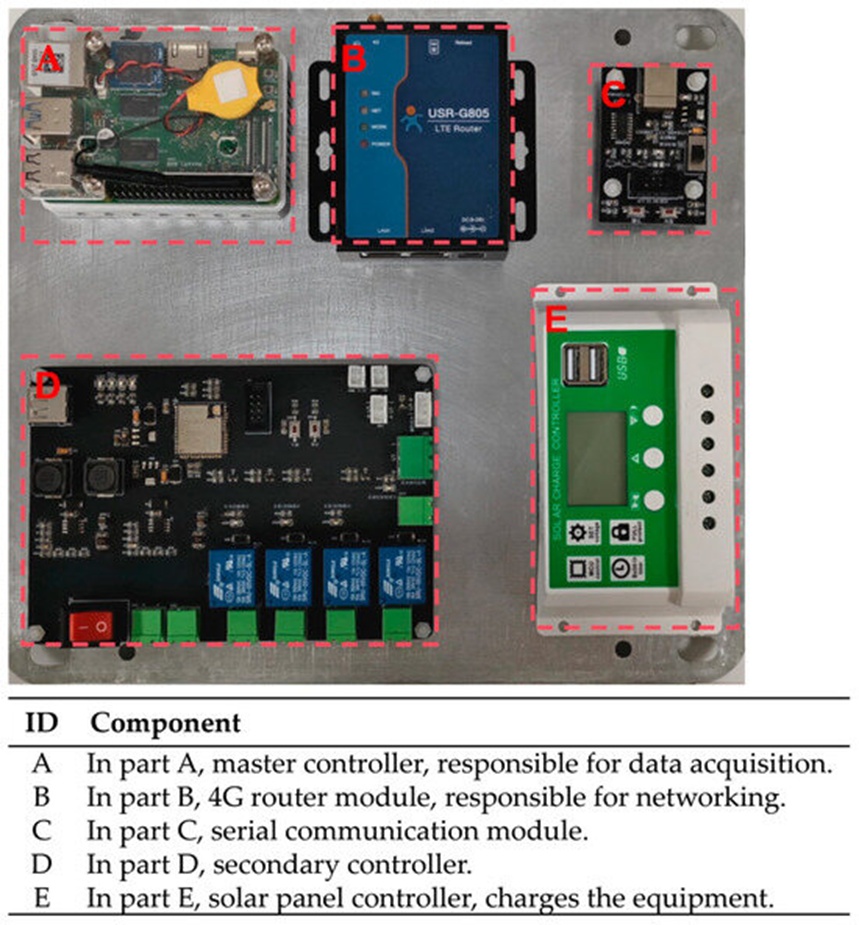
Figure 7. The system hardware architecture layout.
What has been offered above is a bird’s-eye view of the hardware arrangement. A granular exploration of the independently engineered secondary control board occupies the next portion of the text.
A photographic record of the secondary control board is provided in Figure 8:
Location A: This cluster forms the 12 V battery entry point, with current passing through a manual toggle switch before reaching the board’s distribution network.
Location B: Centered on an MP1584-derived conversion cell, this cluster also incorporates a 5 V USB receptacle; together, they keep the main processor, the NanoPi M4B, supplied with conditioned power.
Location C: A further MP1584 buck-derived cell is grouped here, its output feeding the residual subsystems populating the development board.
Location D: Built around an AMS1117 linear regulation cell, this cluster carves out a dedicated, noise-shielded supply path reserved exclusively for the ESP32 module.
Location E: An ancillary 3.3 V step-down cell rounds out the on-board power tree, supplying power to the remaining modules mounted on the development board.
Location F: A diagnostic display circuit resides here, employing LED cues to mirror the live status of the three supply rails: 12 V, 5 V, and 3.3 V.
Location G: The secondary control logic is located within this zone, which also includes auto-flash, reset initiation, and serial exchange capabilities.
Location H: Breakout terminals for field-side transducers (exemplified by the liquid-level gauge and the fiber-optic break-beam detector) are grouped here, complemented by spare 5 V and 3.3 V supply taps.
Location I: The high-wattage load driver stage occupies this area, exercising command over the suction-based insect lure, the fluid circulator, and the illuminator via a dedicated external 12 V input rail and a topology that couples transistors with relays to achieve effective electrical decoupling and enhanced systemic stability.
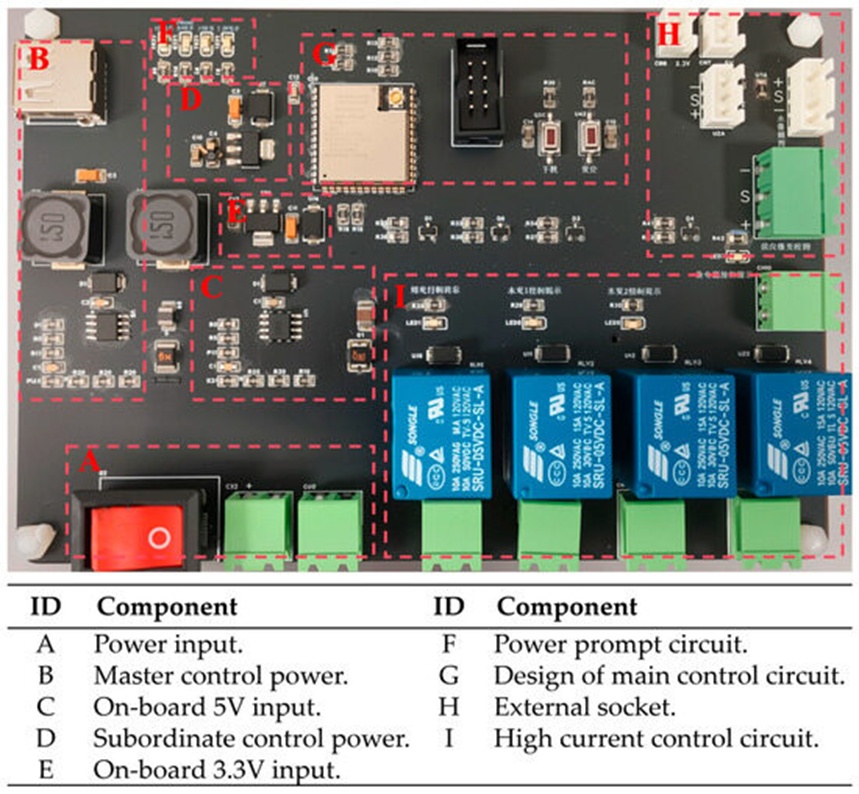
Figure 8. Photograph of the secondary control circuit board.
After describing the physical realization of the auxiliary control board, the narrative moves to the circuit-level details of each subdivision.
Figure 9 captures the circuit blueprint underlying the ESP32-S3 secondary control strategy. The design relies on a dual-core ESP32-S3 microcontroller, a choice that provides adequate computational headroom and robust resistance to electrical disturbances under the conditions anticipated in routine field operation. Dialogue with the primary processor unfolds over a serial link, while peripheral blocks receive direct drive signals. The schematic further supports unattended code upload and operator-triggered reset via a tactile pushbutton.
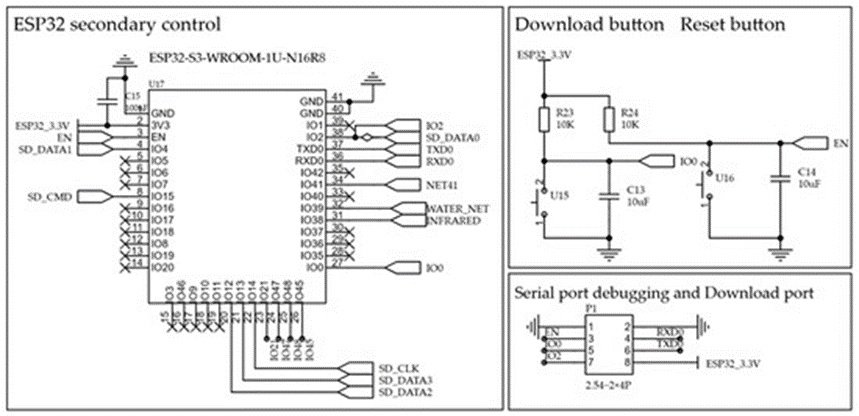
Figure 9. Schematic of the secondary control scheme. “×” indicates an unconnected (open) port.
Figure 10 presents the power distribution schematic at the module level. The raw 12 V input is split into two independent conversion pathways.
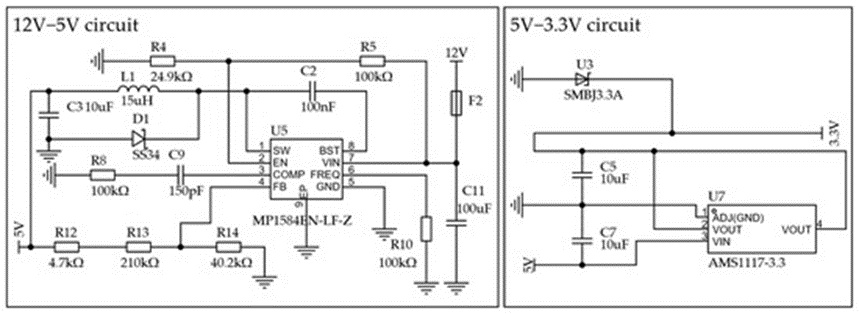
Figure 10. Schematic diagram for the module power supply circuit.
A switching buck stage (anchored by the MP1584) provides a pair of 5 V rails: one is dedicated to the primary processor to quarantine it from disturbances originating elsewhere in the 5 V domain, while its twin supplies the balance of the 5 V peripherals under separate switching authority.
A linear regulation stage (anchored by the AMS1117) subsequently derives 3.3 V from the 5 V potential across two branches: one branch is reserved for the secondary controller alone, isolating it from noise coupled through other 3.3 V loads; the second branch feeds the residual collection of 3.3 V board-level blocks.
Figure 11 depicts the driver stage engineered for high-current loads, including the WSAL, pump, and auxiliary lighting. The schematic employs a transistor-activated relay arrangement that simultaneously boosts the control signal and inserts galvanic separation between the logic-domain circuitry and the 12 V supply backbone. A flyback diode is wired across the relay coil, and a bare-bones status indicator tapped at the transistor collector visually signals whether each channel is conducting or blocked, a feature intended to ease both development troubleshooting and operational oversight.
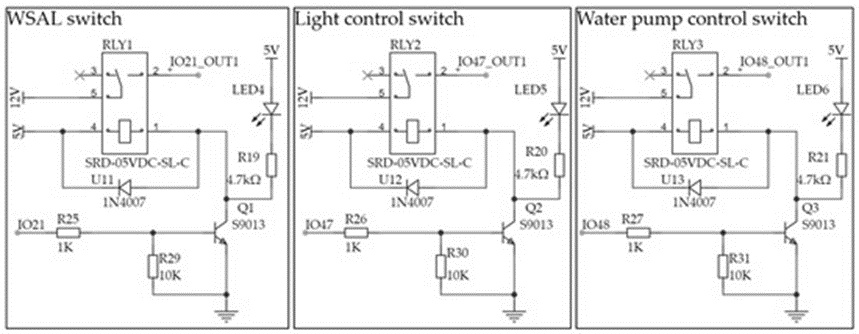
Figure 11. Schematic diagram for high-current loads. Arrows are standard symbols used in circuit diagrams.
Figure 12 lays out the circuitry for unattended firmware injection and the debugging access point. A CH340C integrated circuit serves as a USB-to-UART translator, providing a conventional USB port for pushing compiled code to the controller and exchanging serial diagnostic traffic. This portal guarantees robust data handshaking between the field hardware and a host workstation during development, field commissioning, and subsequent servicing visits.
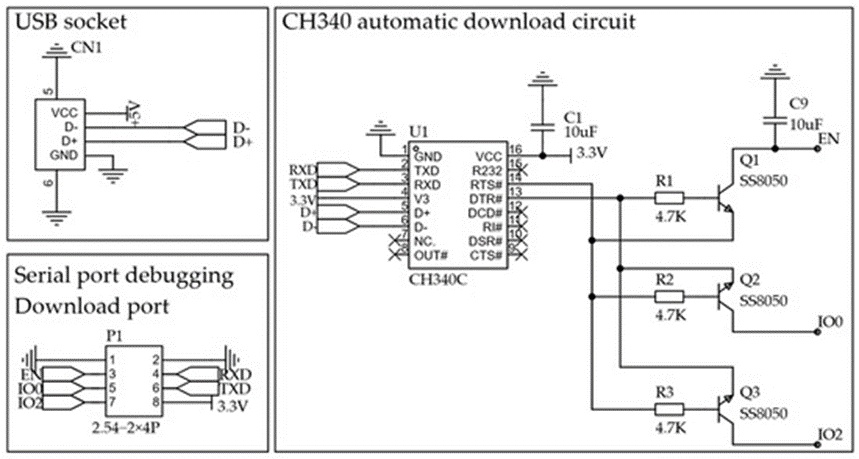
Figure 12. Schematic diagram for automatic program download/debug interface. The symbol “#” denotes specific chip pin designations.
The firmware’s governing philosophy is built around a schedule-driven, event-responsive model that orchestrates the interplay between the WSAL, the water recirculation loop, and the picture-taking pipeline.
Operation is tied to a once-per-day observation cadence. When the local clock ticks into the predefined nocturnal activity band (19:00–05:00 local time), the ESP32-based slave controller powers up the Wind-Suction Attraction Lamp (WSAL) and maintains both the lure emitter and the extraction blower in continuous operation. At the same time, the low-consumption circulator pump is started and kept running continuously, thereby spreading a placid, thin water film across the viewing window.
No dynamic adjustment of either the flow intensity or the illumination configuration occurs in response to individual specimen detections. Both variables are locked to empirically determined values from prior testing to strike a compromise between image clarity and organism integrity. The configuration ultimately retained was chosen to deliver:
A thin-sheet flow field that quickly shuttles specimens into and out of the camera’s visual envelope while preventing extended submersion.
Broad, glare-suppressed lighting illuminates the matte white substrate evenly, thereby amplifying the contrast between the specimen and the background.
Once the observation window concludes (05:00–19:00), the ESP32 powers down the WSAL, the extraction blower, and the circulator pump to pare back energy consumption. Meanwhile, the NanoPi M4B enters a low-activity state, continuing to track time, monitor system health, and conduct scheduled data uploads. Throughout the night-time observation window, the WSAL and pump operate continuously; only the camera and higher-level computation are woken transiently by specimen-trigger events. This harmonized approach maintains stable hydraulic and optical conditions within the WF-DTS during imaging. At the same time, energy-intensive components such as the camera are engaged only briefly, event-gated.
Figure 13 traces the sequence of steps through which data are gathered.
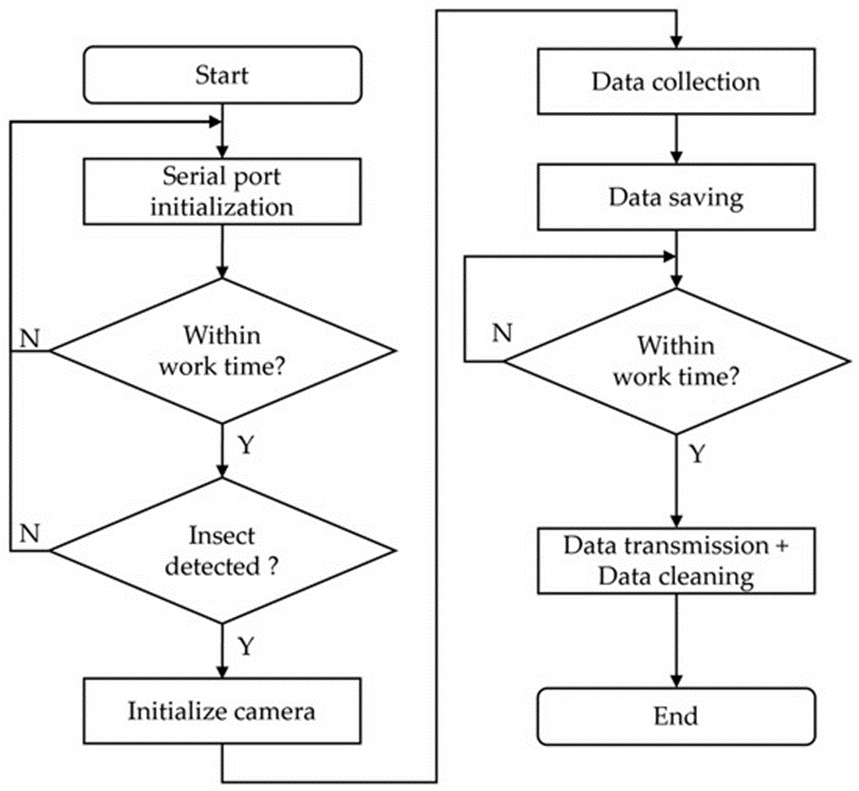
Figure 13. The data collection flowchart.
Initially, the unit initializes its communication peripherals and confirms that the operational time window is open:
Prepare communication peripherals. The platform configures all serial ports assigned to sensors and actuators, setting parameters such as baud rate, parity type, and frame structure.
Confirm operational time window. The platform settles into a repeating polling loop that samples the current clock value at one-minute intervals. Whenever the clock reading falls outside the designated monitoring band (19:00–05:00), the system stays dormant. Execution proceeds to the subsequent steps only after the time falls inside this band.
Sense specimen entry through the fiber-optic transducer. While the monitoring window is open, the platform maintains persistent awareness of the fiber-optic break-beam detector stationed at the intake throat. The transit of an insect triggers a hardware interrupt.
Activate the camera through an interrupt-driven command. Upon receiving the interrupt, the secondary controller immediately sends a trigger command over the serial interface to the imager module, ensuring tight synchronization between the physical capture moment and the start of image recording.
After a capture event has been registered, the platform proceeds through image collection, data movement, and storage management as follows:
Power up the imager and accumulate frames. Upon receiving the trigger command, the camera transitions to its active state and begins sustained frame acquisition, generating high-resolution image sequences of the detained specimen.
Stage and forward image data. Acquired frames are initially written to a local volatile staging area. At predetermined intervals, the staged images are bundled and transmitted via the 4G gateway to a remote repository where they are archived and made available for subsequent analysis.
Reclaim temporary storage automatically. To avert buffer saturation and guarantee uninterrupted operation, the platform periodically purges expired transient files from the local staging area whenever pre-set temporal or capacity limits are triggered.
With the software foundation for data capture, transmission, and identification now fully delineated, the focus pivots to experimental substantiation. Field-based evaluations were undertaken to assess the practical effectiveness of the developed platform, concentrating on two crucial dimensions: the quality and downstream utility of the collected image data, and the proportion of insects that remained alive following the capture sequence.
A view of the platform stationed within the farming terrain of Bagua Island (Baguzhou), which falls within Nanjing’s Qixia District, is presented in Figure 14. This island rises from the Yangtze River’s stream. Rice was the dominant crop across the trial parcel during data collection.
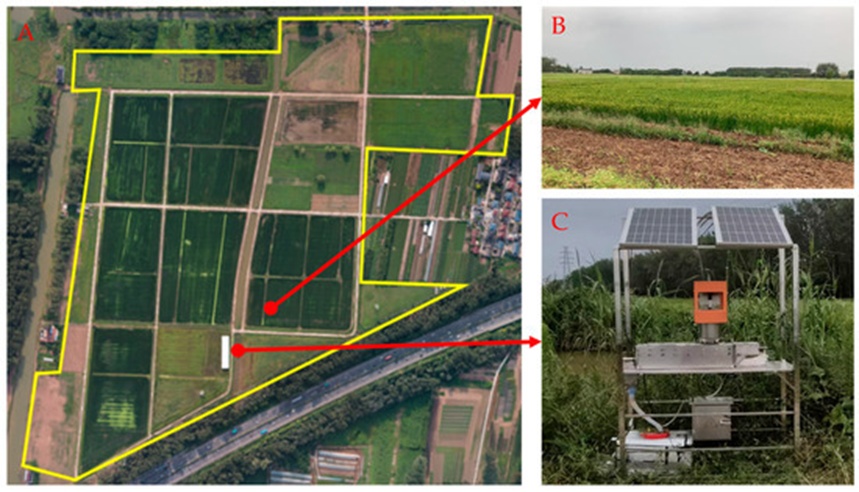
Figure 14. The device was deployed in the field: (A) is a high-altitude aerial view of the Bagua Island area in Nanjing City, with farmland enclosed within the yellow solid line, (B) depicts the rice fields nearby, and (C) presents a physical image of the device.
Turning to the matter of energy budget, current-draw logs taken in March 2025 under ordinary outdoor conditions via a dedicated metering board revealed that the entire WF-DTS assembly can run without interruption for approximately 2.5 days in the absence of any solar top-up. Throughout the trial period described herein, the unit logged multiple successive nights of watch without encountering substantial malfunctions. A 90 L tank serves as the recirculating fluid store, and a foam straining element mounted at the intake port catches floating particulates. Swapping out this foam insert at 2–3-day intervals was all that was necessary to keep channels clear and maintain a steady flow regime throughout the test.
From 23 June 2025 until 30 September 2025, the observing station remained on station in the field and gathered 11,107 frames distributed among 23 arthropod species. Image acquisition proceeded at a fixed tempo of one frame per second. One factor that must be weighed is that the effective lure radius was almost certainly compressed owing to the proximity of other commercially operated electrocuting light traps, which would have drawn from the same pool of night-flying insects. An additional weak point of the prototype in its current state is its poor performance with very small targets. The root cause may lie in the pull of the blower stream, the tripping sensitivity of the optical gate, or an interplay between the two.
Within that same trial zone, adhesive-panel traps run by parallel investigations were deployed alongside. The sticky panels regularly captured minute creatures—midges and thrips whose adult wingspan measures on the order of 1 mm. In contrast, such groups were virtually absent from the WF-DTS’s photographic archive. Such divergence points toward a systematic under-sampling of extremely small insects by the current WF-DTS iteration, plausibly because specimens of that scale are neither effectively entrained and elevated by the WSAL’s air column nor capable of interrupting the optical sensor at its present sensitivity. It follows that the system, as presently configured, is best suited to keeping tabs on insects of medium and large body size; the limited uptake of very small forms is here acknowledged as a shortfall.
In this section, the dataset assembled for the study is laid out visually and verbally along two dimensions: the internal organization of the picture files and the logic governing their filenames. The raw frame format, taken together with the standardized labelling rules, yields a uniform ingest format for later computation and a traceable reference system for model fitting.
Figure 15 reproduces an unbroken run of frames shot in sequence once an insect has entered the WF-DTS. Figure 16 decodes the naming pattern stamped onto the saved images: each group of pictures is labelled by site and date.
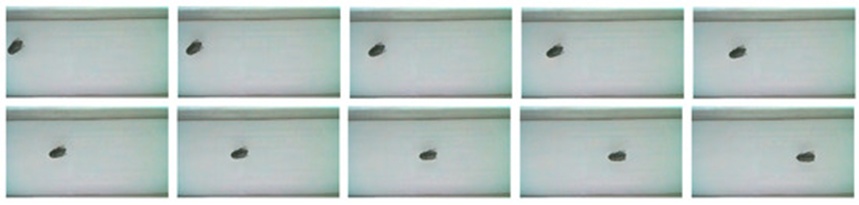
Figure 15. Continuous image acquisition of an insect (In this figure, Holotrichia parallela is selected for demonstration).
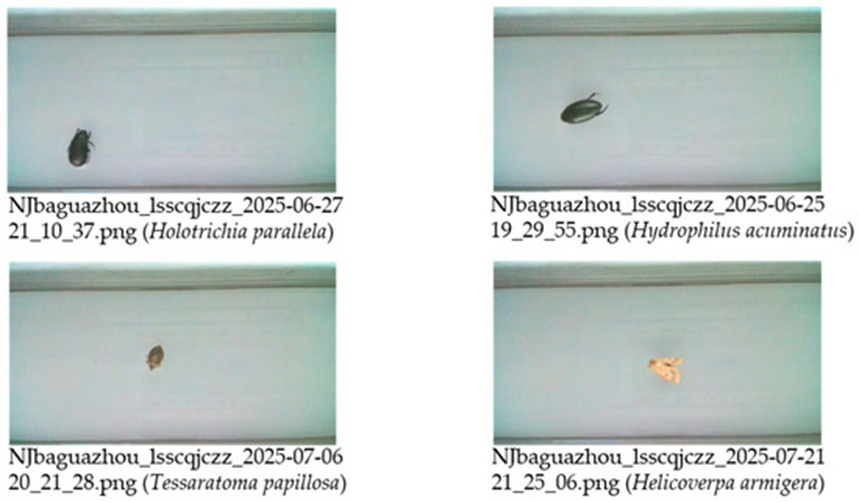
Figure 16. Naming convention for image data (After naming, the Latin scientific name of the insect was added).
A bird’s-eye summary of the dataset appears in Table 4, where a characteristic image, the full Latin binomial, and the count of frames per species are tabulated. To enhance the visibility of anatomical traits, the photographs reproduced in the table are cropped excerpts from the original, uncut frames.
Table 4. Complete data display.
Image display | Latin name | Number of images | Image display | Latin name | Number of images |
| Tessaratoma papillosa (Drury, 1770) | 915 |
| Eurygaster integriceps (Puton, 1881) | 930 |
| Cnaphalocrocis medinalis (Guenée, 1854) | 1097 |
| Harpalus griseus (Panzer, 1796) | 153 |
| Velarifictorus aspersus (Walker, 1869) | 228 |
| Helicoverpa armigera (Hübner, 1808) | 1020 |
| Amsacta lactinea (Cramer, 1777) | 123 |
| Pelopidas agna (Moore, 1865) | 102 |
| Harpalus rufipes (De Geer, 1774) | 640 |
| Plautia fimbriata (Fabricius, 1787) | 920 |
| Chlaenius rufipes (Dejean, 1826) | 601 |
| Coccinella septempunctata (Linnaeus, 1758) | 985 |
| Sycanus croceovittatus (Dohrn, 1859) | 187 |
| Amathes kollari (Lederer, 1853) | 71 |
| Cybister tripunctatus (Olivier, 1795) | 359 |
| Physopelta gutta (Burmeister, 1834) | 122 |
| Holotrichia parallela (Motschulsky, 1854) | 1185 |
| Carabus manifestus (Kraatz, 1881) | 215 |
| Hydrophilus acuminatus (Motschulsky, 1854) | 885 |
| Spodoptera litura (Fabricius, 1775) | 88 |
| Ostrinia furnacalis (Guenée, 1854) | 118 |
| Theretra oldenlandiae (Fabricius, 1775) | 57 |
| Calospilos suspecta (Warren, 1894) | 106 |
When placed alongside the output of traditional traps—output so often degraded by sticking and mutual blocking of specimens—the described platform captures imagery at the resolution of individual specimens, thereby drastically reducing the difficulties that arise from heaped carcasses.
Once the dataset had been compiled and profiled, a full-scale performance assessment of the trained model was executed to corroborate the soundness of the introduced technique. The findings of this assessment are presented below in numerical metrics and visual diagnostics.
The fitness of the collected image stock for downstream use was examined by feeding it into the YOLOv8s object detector. Earlier work on convolutional network-based pest spotters, of which Pest-YOLO serves as an illustrative example, has confirmed that such architectures perform capably on pest targets even when embedded in cluttered farm backgrounds [28]. Here, the emphasis rests not on detector novelty but on establishing that the WF-DTS outputs images that are inherently ready for ingestion by such detectors without laborious preprocessing. According to figures published in Ref. [26], 46.5% of frames harvested from standard lethal light traps contain insects that are piled atop one another or overlapping. No such superposition arose at all among the frames gathered by the proposed system for the YOLOv8s evaluation—an outcome directly traceable to the hydraulic dispersion mechanism that disjoins specimens ahead of the camera. To this end, an evenly weighted subset was assembled by selecting eight emblematic species and assigning 800 images apiece. This subset was then split into training and validation sets at an 8:2 ratio.
Testing was run with the stock YOLOv8s model. The imagery was introduced into the detector pipeline, having undergone only the resizing and normalization steps native to YOLOv8s. The inference stage was deliberately stripped of any auxiliary noise filtering, background removal, bespoke enhancement transforms, or artificial sample expansion. This bare-bones processing chain was adopted specifically to stress-test the raw quality and intrinsic usability of the hardware-generated frames. The full particulars of the computing environment and model settings are given in Table 5.
Table 5. Experimental environment and parameter settings.
Type | Parameter |
Operating system | Windows 11 |
CPU | Intel Core i5-13490F |
GPU | NVIDIA RTX 4070 SUPER |
Python | 3.8.8 |
Pytorch | 2.3.1 |
Cuda | 12.1.1 |
Optimizer | The Adam optimizer (PyTorch) |
Epochs | 100 |
Initial learning rate | 1 × 10⁻² |
Batch size | 36 |
The water-driven singulation and conveyor pathway, coupled with the 1 mm-thick white matte imaging base, ensure that the frames fed into this experiment contain lone, unoccluded insects free of any discernible mutual overlap, positioned against an uncluttered, weakly textured white ground plane that strongly suppresses distractors. The eight taxa are identified by shorthand as follows: Tessaratoma papillosa (Tep), Plautia fimbriata (Plf), Helicoverpa armigera (Hea), Holotrichia parallela (Hop), Hydrophilus acuminatus (Hya), Eurygaster integriceps (Eui), Cnaphalocrocis medinalis (Cnm), and Coccinella septempunctata (Cos).
Inspection of Figure 17 reveals that the diagonal entries of the error matrix dominate the off-diagonal entries by a wide margin, evidence of high classification hit rates and strong between-class discrimination across the entire label spectrum. Within this matrix, “Background” refers to frames or spatial zones that are insect-free, corresponding to the empty white observation panel.
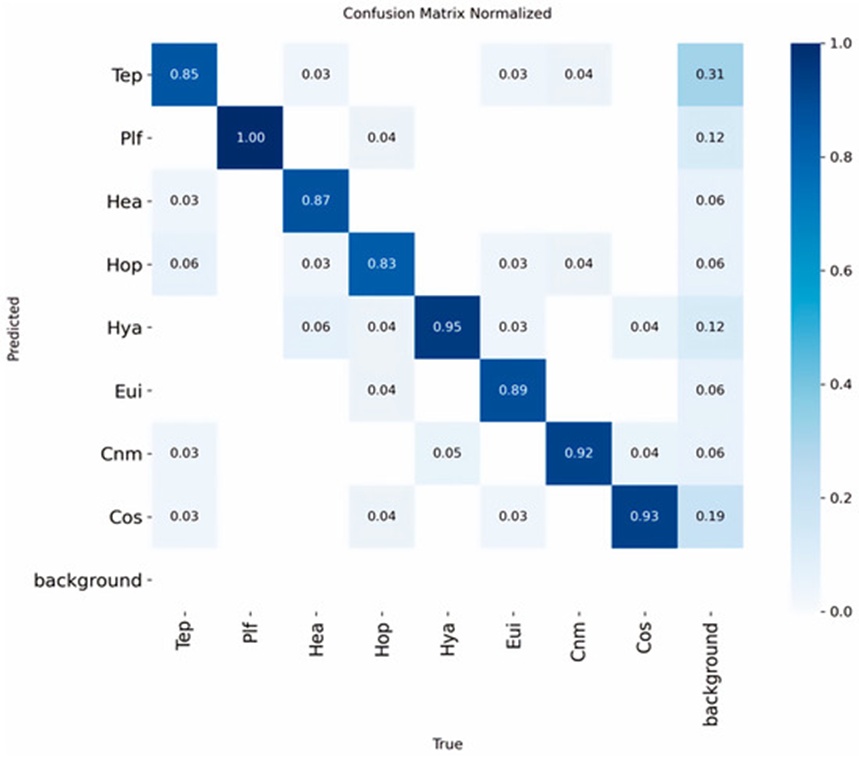
Figure 17. Confusion matrix normalized. The “Background” class denotes frames with no insect present (empty white imaging panel).
Figure 18 traces the paths of the training and validation error and accuracy curves as they converge, confirming that model fitting has reached completion and steady state.
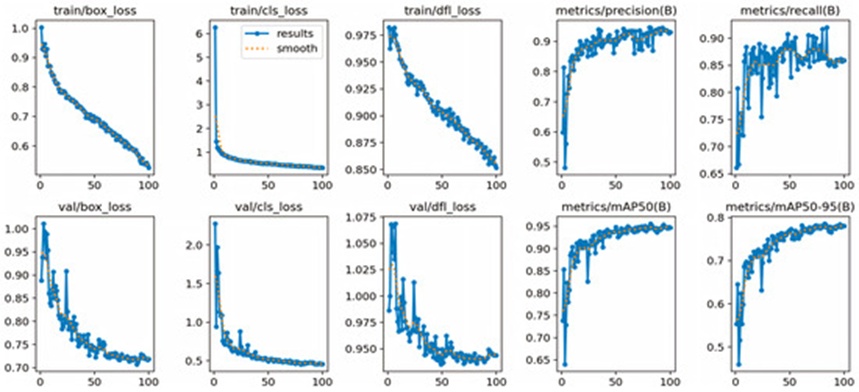
Figure 18. Training and validation loss and accuracy curves generated by the object detection model.
A plot of the F1 metric as a function of the confidence threshold is shown in Figure 19; when the confidence threshold is set to 0.755, an aggregate F1 of 0.9 is achieved across the pooled categories. The relationship between precision and confidence is shown in Figure 20, where it becomes evident that comparable overall performance (F1 ≈ 0.9) is already achieved at the less stringent confidence level of 0.5. Figure 21 maps precision against recall, and the computed mean Average Precision ([email protected]) taken over all classes stands at 0.956. The recall–confidence dependency is drawn in Figure 22; notably, recall edges toward 0.98 even under comparatively modest confidence settings.
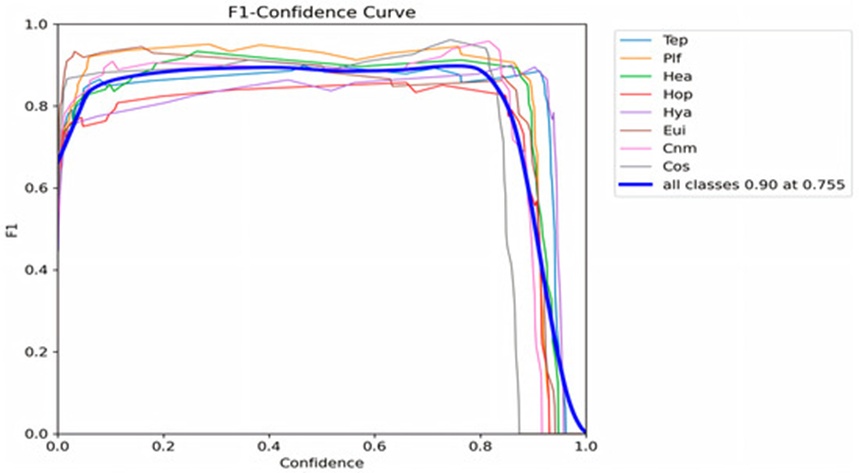
Figure 19. F1-score confidence curve graph.
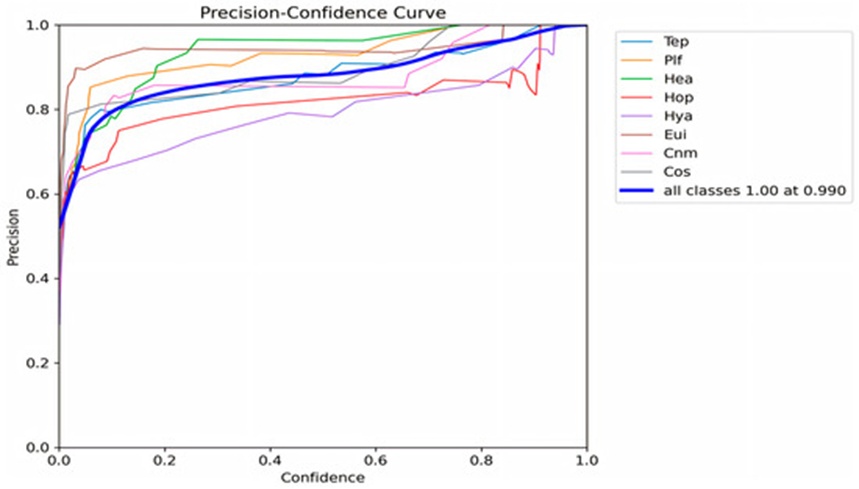
Figure 20. Precision–confidence curve.
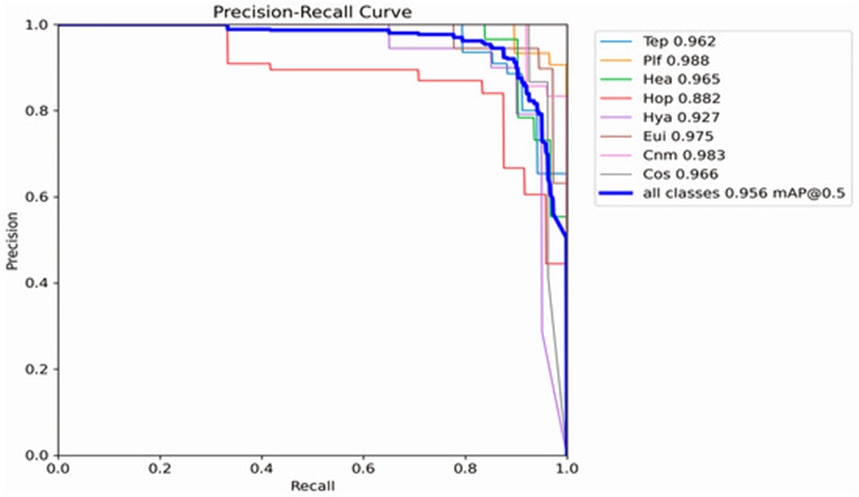
Figure 21. Precision–recall (P–R) curves.
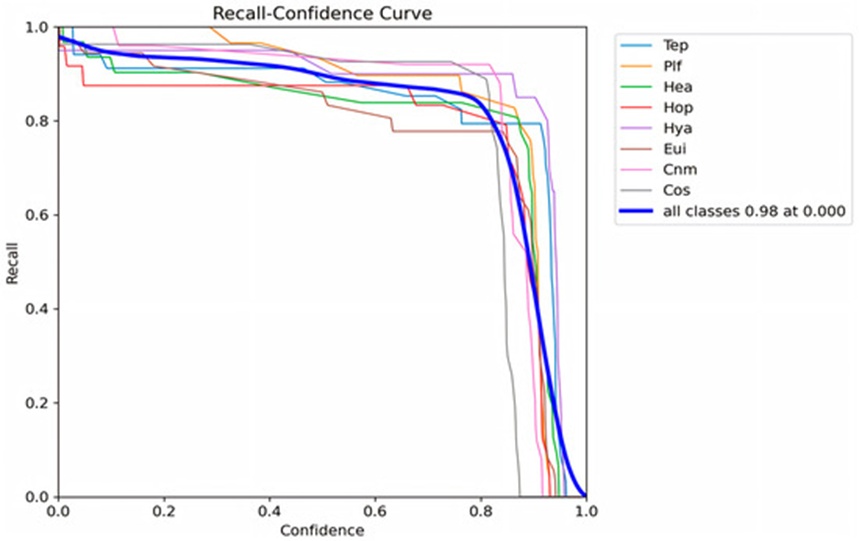
Figure 22. Recall–confidence curve.
Stepping back to survey the full set of indicators, what emerges is that training reached a stable end state, and the fitted YOLOv8s model operates at a high level across all eight insect groupings under the regimented imaging regime provided by the proposed hardware. A further inference is that frames originating from the WF-DTS require no custom preprocessing to be digested by generic object detection workflows, which positions them as a suitable empirical base for subsequent LTARI-oriented inquiries reliant on temporally resolved insect imagery. The source of this detection performance merits emphasis: it is rooted first and foremost in the physical design—namely, hydraulic singulation that aggressively suppresses specimen-on-specimen occlusion and delivers predominantly lone subjects within the camera’s visual envelope, alongside the unvarying matte-white observation plane. These factors jointly strip the visual scene of complexity. Accordingly, the scholarly weight of this contribution lies in hardware-side refinement that eases the downstream computational burden, rather than in the unveiling of a new recognition algorithm.
Dedicated trials were run to test whether the platform met its foundational performance target—keeping captured organisms alive. These validation exercises took place inside the broader data-collection window (23 June–30 September 2025), with sampling concentrated in July 2025. Several trial blocks were disrupted partway through by unseasonable typhoons and intense rainfall events. A receiving cage made from 30-mesh screening was affixed to the specimen outflow to intercept and hold exiting insects. A standard 24-hour soak period was observed for each trial, after which the condition of every retained insect was scored on the following calendar day. An insect was judged “alive” provided it showed overt, vigorous motion—instances being crawling over the mesh surface or flying/initiating flight attempts within the enclosure. In contrast, a complete absence of perceptible movement throughout the entire inspection interval earned a classification of “dead.” The short-form labels used henceforth are: Spodoptera litura (Spl), Ostrinia furnacalis (Osf), Spodoptera frugiperda (Spf), and cricket (Cri).
The cohort tested numbered 150 individual insects, with representatives spanning multiple orders such as Coleoptera and Lepidoptera. Using the above criterion, 94% were alive at assessment time (141 of 150; the 94% confidence interval extends from roughly 88% up to 100%). Casual observation after release indicated that a sizeable portion of the lepidopteran subjects recovered spontaneous ambulation and flight following a rest period. These outcomes suggest that, under the conditions prevailing during testing, the apparatus serves as an image-collection tool while simultaneously preserving a meaningful level of insect viability. This is consonant with the stated design aim of “minimizing ecological impact” and may offer a practical starting point for probing the phototactic rhythmicity of living insect populations inside their native habitats.
Video was shot on location throughout the survival-verification exercise to capture behavior both within the WF-DTS channel and during the post-release recuperation interval. Representative clips illustrating live insects—including lepidopterans—traversing the WF-DTS and subsequently regaining typical movement and flight after a brief recovery span have been placed in the following GitHub repository to serve as qualitative backing for the survival figures: <https://github.com/157550/my-project.git> (accessed on 1 February 2026). The full, unedited footage corresponding to the survival-validation runs is housed in that repository.
A cautionary note is warranted: the 94% survival figure should be interpreted strictly as a snapshot taken over a short post-capture interval at the community scale. It does not rule out sublethal harm traceable to water immersion—for example, patchy loss of wing scales and degraded flight competence among susceptible taxa like Lepidoptera. Isolating and measuring such conceivable sublethal aftereffects would require purpose-built ethological and physiological experimentation in subsequent investigations.
The live-insect observation platform described here is offered as a methodological departure from standard light-baited monitoring installations. By combining non-destructive wind-driven intake, water-mediated specimen spacing during photography, and gentle fluid-borne extraction for return to the environment, the architecture constructs an end-to-end automated, non-fatal trap–image–release sequence suitable for outdoor deployment.
A particularly useful dividend of the design is its suppression of physical contact and carcass accretion among detained organisms. The hydraulic singulation stage promotes the separation of individuals in the imaging zone, producing faithful lone-specimen photographs against a plain backdrop. This stems from a stubborn deficiency in prior-generation automated monitoring gear, where piling and sticking of bodies gravely erode picture quality and cramp the reach of visual recognition pipelines. With the imaging scene so simplified, elevated detection fidelity is attainable with relatively modest, unmodified detectors; the central step forward in this paper is a hardware-driven reduction of visual clutter rather than any purely software-based innovation.
The non-lethal posture of the system carries the further implication that unintended losses among non-target and beneficial insect assemblages may be lessened relative to the toll exacted by fatal light traps. Exterminatory devices risk perturbing local community composition and making repeated observation of the same subjects impossible. In the proposed alternative, insects pass through capture, photography, and subsequent release, registering high short-interval post-capture survival within the limits of the tested regimen. This enhances the ecological compatibility of the monitoring routine and accommodates recurrent, time-indexed observations under genuine field conditions.
By dampening both specimen stacking and the imprint of trap-induced fatality on the collected records, the presented platform may supply a workable methodological scaffold for future LTARI-grounded research. The aim here is not to lock down canonical LTARI values within the present study but rather to equip investigators with a tool that can accommodate diverse experimental designs and sustained field campaigns, thereby smoothing the way for deeper dissection of light-attraction dynamics as they unfold in living insect populations.
Several constraints inherent in the current build deserve enumeration. One arises from the very premise of non-lethal operation: because the WF-DTS returns captured insects to the surroundings, the same individual may pass through the device on multiple nights. The present work prioritized image integrity and immediate post-capture viability; deriving absolute population metrics was not on the agenda, and repeated encounters went unlogged and unadjusted. Research that shifts the focus toward LTARI estimation at the population scale will thus need to overlay WF-DTS data streams with individual tagging or re-identification protocols in purpose-crafted experimental designs.
A second point concerns the absence of head-to-head trials pairing the WF-DTS with conventional lethal light traps run under a shared set of field conditions. No direct quantitative comparison of LTARI values between the two approaches can legitimately be drawn from the data at hand. The contribution made here is more accurately framed as the realization of a non-lethal observational infrastructure intended to suppress biases that flow from carcass accretion and trap-induced fatality. Forthcoming efforts must place the WF-DTS alongside representative commercial traps in the same environment to generate comparative LTARI readings and gauge the extent to which non-lethal measurements alter the picture of phototactic responsiveness.
A third limitation is the prototype’s uneven performance across insect body sizes. Sticky traps deployed on the same ground readily intercepted very small forms (roughly 1 mm; midges and thrips are among the examples), categories that were all but missing from the WF-DTS image corpus.
A fourth concern relates to the survival data, which constitute an initial spot check of feasibility rather than a thorough physiological workup. The tested cohort is of moderate size; there were no formal control conditions (e.g., airflow-only exposure, water-only exposure, or standard lethal trap treatment); and the survival figure is a bulk community-level summary, not a per-taxon statistic. Even though lepidopterans and representatives of several other major orders featured in the sample pool, and informal observation suggested that many regained normal ambulation and flight after WF-DTS transit, future investigations should disaggregate survival by taxonomic group and systematically assess potential sublethal impairments—scale loss, flight deficits—particularly for species that carry economic or conservation weight.
Finally, the picture regarding long-duration reliability and weather hardiness remains provisional. The deployment window covered by this report coincided with relatively mild conditions; extended torrential rain, gale-force winds, and temperature spikes were not encountered. While the stainless outer shell and gasketed compartments successfully shielded internal modules during sporadic light-to-moderate precipitation, the response of the structural frame, the recirculating hydraulics, and the electronic subsystems to sustained harsh weather has yet to be rigorously tested. Power-budget logging and runtime tracking indicate an unassisted operational endurance of roughly 2.5 days without solar input, and the upkeep burden under tested conditions remained light—chiefly sponge-filter changes every 2–3 days. Still, longer field residencies coupled with continuous environmental monitoring will be indispensable for mapping how performance shifts across climatic regimes.
Given these caveats, the WF-DTS in its current incarnation is best viewed as a research-grade observational instrument and a methodological stepping stone for non-lethal, image-based insect surveillance and scoping LTARI studies, rather than a turnkey substitute for the installed base of operational light-trap networks. Priorities for onward development include expanding the size spectrum of captured taxa, deepening the biological validation framework, formulating corrections for recapture when abundance indices become the target output, and fortifying long-term endurance across a broader range of agroecological and meteorological contexts.
This paper presents a live-insect observational platform based on a water-stream-mediated singulation and transport principle. Through the joint action of wind-suction intake, hydrodynamic dispersion before the camera station, and fluid-based specimen extraction for return to the environment, the prototype implements a fully mechanized, non-fatal trap–image–release sequence compatible with outdoor deployment.
Trials conducted under the reported circumstances suggest that the platform can alleviate two entrenched drawbacks of traditional insect-monitoring apparatuses: the piling of corpses that undermines image usability, and the non-selective destruction of both pest and non-pest insects. During field exercises, the equipment delivered solitary-individual photographs. It yielded a community-wide post-capture survival fraction of 94%, thereby underpinning image-based surveillance while minimizing direct impacts on local insect assemblages.
The paper’s aim is not the establishment of canonical LTARI figures; it supplies, instead, a methodological substrate upon which future LTARI investigation may be built.
The following abbreviations are used in this manuscript:
LTARI | The light-trap attraction rate of insects |
WF-DTS | Water-Flow Dispersion and Transport Structure |
WSAL | The Wind-Suction Attraction Lamp |
None
None
None
None
Open Access The author(s) retain copyright. This article is licensed under the Creative Commons Attribution-NonCommercial-ShareAlike 4.0 International License. It may be shared and adapted for non-commercial purposes with appropriate attribution, an indication of changes, and distribution of adaptations under the same license. Third-party material may be subject to separate terms identified in its credit line. View the license at https://creativecommons.org/licenses/by-nc-sa/4.0/.
 Agro Intelligence Research Press