Within the densely structured environment of an orchard, pinpointing the exact harvesting location is fundamental to the autonomous operation of fruit-picking robotic systems. Despite this, current techniques are prone to miscalculations in positioning under intricate conditions such as abbreviated stalks, partial concealment, or instances where the target is entirely misread, any of which can compromise the robot's operational efficiency in the field. To address complex vineyard harvesting scenarios, this paper presents an advanced method for picking-point determination that relies on semantic-level inference. The approach introduces three novel components: the semantic reasoning module (SRM), the ROI threshold adjustment strategy (RTAS), and the picking point location optimization module (PPOM). The SRM is deployed to resolve cases where obstructions mask grape stalks, suffer from partial recognition errors, or undergo total recognition failure. The RTAS is designed to overcome difficulties associated with stalks that are positioned low and are notably short during the picking sequence. In the final stage, the PPOM adjusts the calculated picking point coordinates to their optimum, granting the manipulator greater maneuverability as it executes the harvest action. Empirical validation demonstrates that SegFormer produces an mIoU (mean Intersection over Union) of 84.54%, accompanied by B_IoU and P_IoU scores of 73.90% and 75.63%, respectively. In addition, the refined fruit-picking point localization method achieved a success rate of 94.96%, representing an improvement of 8.12% over the baseline technique. The average computation time stands at 0.5428 ± 0.0063 s per instance, which is adequate for real-time harvesting demands.
Grapes represent a crop with extensive worldwide cultivation. The diversity of grape types, the intricacies of their growing habitats, and the imperative for gentle, damage-free handling mean that manual labor remains the dominant mode of harvest. Against a backdrop of shrinking rural workforces and escalating operational costs, the introduction of automated grape-harvesting machines to replace human workers is a development of considerable importance and market opportunity. The critical factor for successful mechanical grape collection is the accurate identification of the precise detachment point on each grape cluster, which is essential for both preserving fruit quality and maximizing throughput [1]. The challenge of locating this point on grape clusters is twofold. The first aspect concerns the reliable sensing of complex visual environments, which demands the ability to distinguish among various fruit stalks and to recognize the spatial orientation of the fruit. The second aspect is the capacity to parse and draw conclusions from these complicated scenes, arriving at a correct picking point after synthesizing all available contextual cues. What this requires of a robot is the capacity to maintain positioning accuracy even as environmental variables shift, thereby enabling streamlined, bruise-free automated harvesting.
By tapping into the formidable feature extraction capabilities of neural network architectures, deep learning has triggered a paradigm shift in intelligent agricultural robotics, with widespread application in fruit localization and environmental interpretation [2-7]. Object detection and semantic segmentation are foundational techniques for acquiring semantic awareness. Object Detection assigns class labels to items and estimates their spatial extent via bounding boxes, thereby providing a holistic interpretation of image content [8-10]. [11] built a streamlined, end-to-end enumeration framework leveraging YOLOv5s to automatically process video streams, enabling continuous, real-time monitoring and counting of grape bunches in field environments. This design minimized model size and complexity while maintaining detection fidelity. [12] described the NDMFCS (Normal Detection Matched Fruit Counting System). This autonomous yield estimation framework pairs YOLOv4 tiny for object detection with threshold-based anomaly filtering and trunk-tracking enumeration via ID allocation, thereby improving apple count precision by suppressing false positives. Semantic Segmentation, functioning at the granularity of individual pixels, extends beyond mere category recognition to the precise charting of object perimeters, yielding a markedly more nuanced semantic picture [13-16]. [17] unveiled RTMFusion, a lightweight bifurcated instance segmentation network that weaves together RGB and depth information via a Depth Enhanced Feature Fusion module. By enforcing a distance-gated matching rule, the system reliably links tomato fruits, pedicels, and stems, achieving 72.1% mask mAP and exceeding 99% pedicel association accuracy, indicative of strong reliability under challenging greenhouse conditions. [18] presented DualSeg, a parallel-branch network architecture that merges CNN's strength in local feature refinement with Transformer's capacity for holistic long-range dependency modeling. A dedicated Feature Fusion Module (FFM) orchestrates the blending of parameters from distinct processing branches, working to conserve both local detail and global context to the greatest extent possible.
A wide range of research efforts has focused on extracting spatial coordinates for grape cluster picking points [19-21]. [22] merged instance segmentation powered by a Convolutional Neural Network (CNN) with monocular range estimation to develop a robust and precise method for identifying and spatially localizing the peduncle of table grapes, a solution intended for seamless integration into autonomous robotic grape picking. [23] proposed a method for partitioning grape point clouds that fuses image-level segmentation with point cloud mapping to secure faithful 3D fruit measurements for rapid robotic collection. They also designed a LOWESS-based algorithm to locate the optimal incision point for the peduncle in 6D space and to reconstruct its surface geometry, using the tangent at that point to back out the full 6D pose. [24] developed a 3D pose estimation algorithm (TPD) for individual tomatoes within clusters. The TPD framework consists of a YOLO-Imk unit for proposing tomato bounding boxes and locating calyx midpoints, plus a point cloud processing unit that partitions the spatial data within these boxes to obtain the 3D positions of both the tomato's geometric center and its calyx midpoint. The tomato's spatial orientation in 3D is then constructed by forming a vector between these two extracted points. [25] developed an enhanced YOLOv8-GP architecture to identify grape clusters and their picking points jointly. This end-to-end model merges object and keypoint detection tasks, achieving 89.7% AP for grape bunch identification while maintaining Euclidean positional error below 30 pixels for picking points [26] put forward a deep learning-anchored pipeline for the robotic harvest of multiple table grape cultivars. The workflow begins with SPNet (MobileNetv2) applied to semantically segment grape imagery. Then, Canny edge detection, guided by an adaptive threshold, isolates the contours of fruit peduncles. The intended picking point is designated at the crossing of a line fitted to edge data and the horizontal midline of the region of interest.
[27] launched a Grape Picking Point Location Algorithm (GPPLA) grounded in visual knowledge distillation for unstructured environments. Through three constituent algorithms—GPRE, IPCS, and OPPL—the system effectively handles recurring problems such as the presence of multiple fruit stalks and stalks of non-standard shapes during harvest. Yet, as the GPPLA algorithm was transitioned to practical deployment on picking robots and has been in ongoing use in authentic field harvesting, several constraints have emerged, most notably under complex environmental conditions. The limited perceptual reach of the semantic segmentation model means that fruit peduncles, which account for a tiny fraction—roughly 1.89%—of the overall image area, are, by their nature, exceedingly difficult to segment with consistent accuracy. Consequently, classification errors are common. The situation is further aggravated by the peduncle's chromatic shift from green to brown tones, which can confuse segmentation and often leads to brown segments being mislabeled as woody branches. The GPPLA algorithm is fundamentally dependent on the reliability of the semantic inputs it receives, rendering it acutely susceptible to collapse when peduncle misclassification occurs. As a result, the question of how to perform deeper semantic deduction starting from the available—yet often flawed—semantic features has become the central research question driving this study.
Semantic reasoning is a pivotal capability in artificial intelligence and machine learning, describing the process of deriving new conclusions from an existing knowledge base [28-31]. [32] introduced the Compositional Visual Relations (CVR) benchmark to stimulate progress in data-efficient learning paradigms. Inspired by tests of fluid intelligence and non-verbal logical deduction, they detail a scalable framework for constructing abstract relational rules and associated image corpora. The benchmark probes properties such as sample efficiency, generalization capacity, task transferability, and compositional structure, providing a structured evaluation of modern neural network architectures. [33] outlined a visual reasoning-driven approach that provides vehicle operators with perceptual, predictive, and inferential information projected onto augmented reality head-up displays (AR-HUDs), aiming to augment cognitive faculties and improve overall driving safety and judgment quality. Taken together, these investigations highlight the promise of semantic reasoning to raise the bar for high-level situational understanding and decision-making in multifaceted environments. When applied to the specific problem of determining grape-picking points, semantic reasoning opens a new avenue for overcoming the inherent limitations of rudimentary semantic perception. By reconstructing higher-tier spatial and relational patterns from incomplete or corrupted semantic signals, this strategy significantly boosts the resilience and accuracy of localization systems operating in the unstructured conditions of orchards.
The body of existing scholarship draws heavily on deep learning toolkits within the YOLO and Mask R-CNN ecosystems for semantic interpretation, deploying end-to-end-trained models to forecast picking coordinates in a single forward pass. A critical gap across these efforts, however, is the absence of a nuanced examination of demanding harvesting contexts. When benchmarked against monolithic end-to-end deep learning formulations, the system proposed in this paper delivers two decisive edges. First, this inquiry deliberately targets intricate picking settings and embraces a sequential perceive-then-reason architecture, applying semantic segmentation at the sensing stage. This arrangement supplies per-pixel classification outputs of exceptional granularity, greatly expanding the contextual foundation that downstream modules can exploit. Second, the approach deliberately avoids collapsing the problem into a direct coordinate regression task; rather, it harnesses the distinctive geometric signatures of grape bunches and integrates a series of transparent, rule-based post-processing refinement blocks that progressively steer the estimate toward the optimal harvesting locus. The pipeline explicitly models cluster morphology and encodes the relational geometry linking the cluster to its stalk, thereby fortifying both resilience and spatial fidelity when operating under adverse field conditions. While monolithic end-to-end models compress the processing chain into a compact form, the interpretability barrier they create severely restricts the injection of horticultural domain expertise. By decomposing the challenge into a chain of individually tractable sub-problems, the presented strategy seamlessly integrates prior knowledge, increasing both the dependability and the deployability of the overall solution.
This paper places its emphasis squarely on overcoming the picking-point localization bottleneck as it manifests across a spectrum of complex grape-harvesting environments. As an initial step, the study performs a head-to-head assessment of a suite of candidate semantic perception backbones, identifying the configuration whose performance profile most closely aligns with the rigors of orchard field conditions. Building on this, and shifting the vantage point to that of semantic cognition, the work taxonomizes grape picking situations into four discrete categories: Common Scenarios (CS), Short and Low Grape Peduncle Scenarios (SLGPS), Grape Peduncle Occlusion and Misidentification Scenarios (GPOMS), and Severe Misidentification of Grape Peduncles (SMGP). Anchored by this categorisation, a complex picking scene dataset was curated, comprising 2460 meticulously annotated exemplars evenly spanning the four defined scenario buckets, to provide a rigorous substrate for iterative algorithm development and quantitative benchmarking. The substantive contributions this investigation delivers are catalogued below:
1. A semantic reasoning module is architected to extract additional inferential value from impoverished or ambiguous semantic signals, thereby circumventing failures caused by partial obstruction and erroneous labeling of fruit stalks.
2. The ROI threshold adjustment strategy is designed to perform dynamic, context-sensitive resizing of the spatial region of interest, specifically targeting the problematic case in which stalks are both stunted and positioned anomalously low.
3. The picking point optimization module is designed to deliver a measurable improvement in algorithmic stability when the system is subjected to the vagaries of complex harvesting environments.
This manuscript details a re-engineered grape cluster picking point localization algorithm (GPPLA) anchored on the SegFormer [34] semantic segmentation foundation. A high-level schematic of the entire pipeline is shown in Figure 1, with Figure 1a unpacking the SegFormer encoder-decoder architecture, Figure 1b outlining the augmented algorithmic flow, and Figure 1c documenting the unmodified, original GPPLA procedure. The restructured framework has been purpose-built to address the failure modes exhibited by GPPLA in harsh vineyard settings, where occluding elements, volatile illumination patterns, and the intrinsic morphological variability of peduncles routinely conspire against accurate localization.
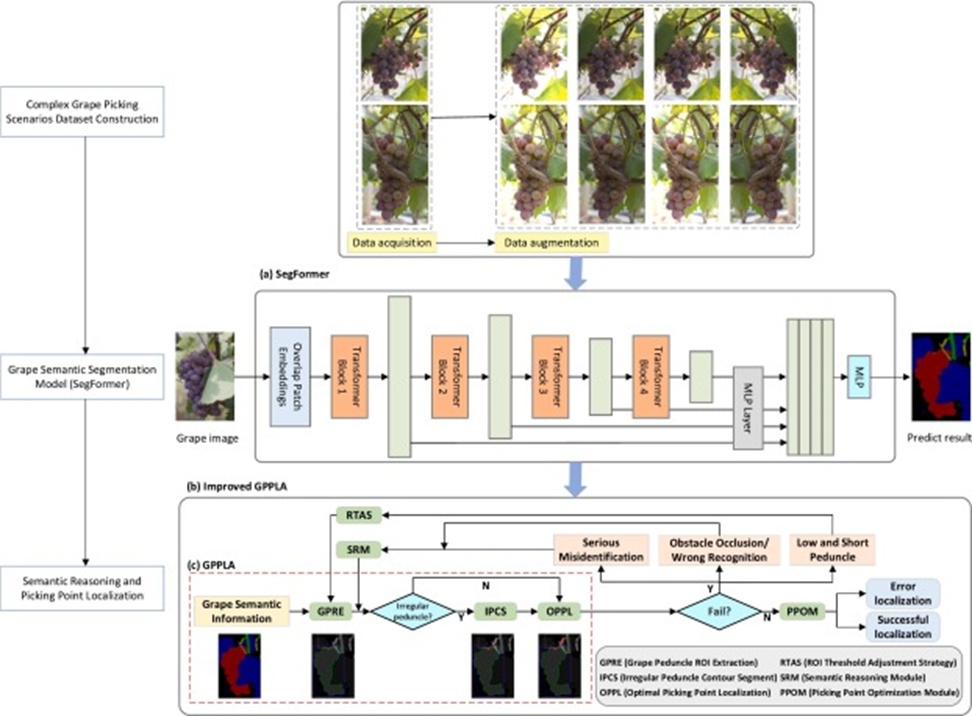
Figure 1. An overview of the proposed algorithm.
A perception-cognition logic flow governs the proposed pipeline. In the initial perception phase, SegFormer is tasked with performing a semantic deconstruction of the complex visual scene, emitting richly detailed categorical maps that serve as feedstock for the cognition tier. This tier houses a substantively enhanced variant of the GPPLA algorithm, now augmented with a dedicated semantic reasoning apparatus that empowers the system to conduct supplementary rounds of inference drawing upon the semantic landscape already extracted. Via this systematic overhaul of GPPLA, our methodology simultaneously safeguards the baseline proficiency of the original approach. It decisively overcomes the localization hurdles endemic to more convoluted grape cluster harvesting situations, delivering concurrent gains in positional accuracy and operational robustness.
The grape semantic segmentation dataset (GSSD) employed throughout this research program samples three commercially relevant grape cluster cultivars: Rose Red (MUH), Chardonnay (CDY), and Summer Black (SUB). A hallmark of these varietals is the substantial visual commonality among their fruit peduncles, lignified canes, and leaf canopies. The canes manifest as comparatively thick, brown-hued perennial wood, whereas the fruit peduncles appear as tender, green annual growth. Image acquisition duties were handled by a Nikon D610 DSLR body deployed within the Luonan Ecological Park situated in Foshan. All captures were timed to coincide with the peak ripeness interval, conducted under unobstructed solar illumination, with standoff distances spanning 0.5 to 1.5 m, and the camera recording at a native resolution of 6016 × 4016 pixels. To compress algorithmic runtime and increase the model's effective segmentation rate, discrete grape clusters were windowed from the original ultra-high-resolution frames, yielding standardized 640 × 480-pixel image tiles. The finalized dataset encompasses 1070 RGB samples.
To satisfy the ingestion format demanded by contemporary semantic segmentation architectures, the Labelme graphical annotation suite was pressed into service for ground-truth generation. The platform facilitates the delineation of pixel-accurate class boundaries by placing closed polygons assigned to a distinct color palette. As shown in Figure 2, the MUH, CDY, and SUB clusters are traced in red, cyan, and purple, respectively. An analogous color convention is followed for the remaining classes, with yellow, green, and blue assigned to grape peduncles, cane branches, and leaf surfaces. The assembled corpus is subsequently stratified into three non-overlapping partitions: the training fraction (886 images), the validation fraction (94 images), and the held-out test fraction (210 images).
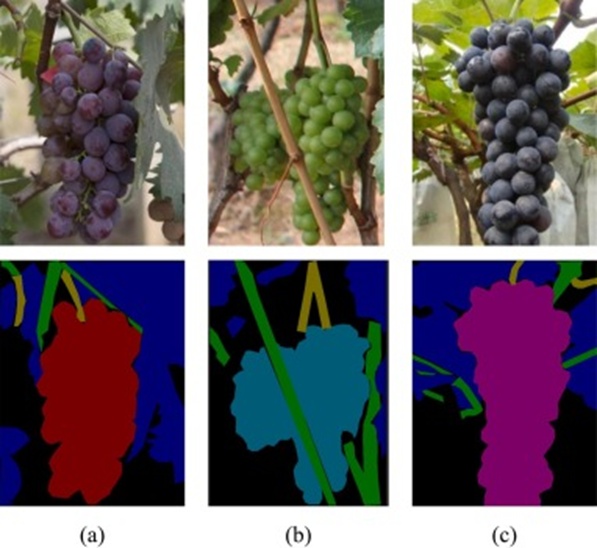
Figure 2. RGB images and annotations of the GSSD Dataset: (a) Image of MUH grapes and its corresponding annotated image, (b) Image of CDY grapes and its corresponding annotated image, and (c) Image of SUB grapes and its corresponding annotated image. In the annotations, MUH, CDY, and SUB grapes are marked in red, cyan, and purple, respectively. In contrast, leaves, grape peduncles, and branches are marked in blue, yellow, and green (For interpretation of the references to color in this figure legend, the reader is referred to the web version of this article).
Motivated by the imperative to address the bewildering diversity of harvesting situations that grape-picking robots inevitably face during protracted on-farm operations, the Complex Scene Grape Picking Dataset (CGPSD) was purpose-built to address these operational pressures systematically. The repository comprises 492 rigorously curated, high-resolution photographs spanning a broad range of harvesting conditions under heterogeneous environmental conditions, with the explicit goal of providing a robust evidentiary base for algorithmic iteration and performance optimization. Following exhaustive observational fieldwork and analytical decomposition of complex field conditions, four canonical categories of intricate harvesting scenarios have been formalized.
1) Common scenarios (CS): This broad category aggregates the following archetypal harvesting configurations:
a. General scenario: Grape clusters descend naturally under gravity, the peduncle remains visually unambiguous and cleanly separable from the berry mass, and the semantic map is devoid of extraneous signals that might confound picking point estimation.
b. Irregular peduncle scenario: Driven by the pronounced resemblances in pigmentation and overall shape between true fruit stalks and leaf petioles, the semantic segmentation output introduces anomalous, distorted peduncle boundary traces within the extracted ROI zone.
c. Multi-peduncle scenario: The ROI zone is populated by a surplus of potential stalk candidates, imposing a non-trivial selection problem to isolate the single most anatomically appropriate peduncle on which to anchor picking point computation.
d. Branch occlusion: In cases where structural woody canes partially mask the grape target, the segmentation engine erroneously fractures a single, contiguous grape bunch into an assemblage of disjoint sub-cluster silhouettes, forcing a binary decision on silhouette merging.
2) Short and low grape peduncle scenarios (SLGPS): This condition is diagnosed when the grape stalk is both markedly abbreviated in length and set at a depressed vertical position, such that the algorithmically derived picking coordinate falls below the apex of the grape bunch's bounding envelope. The SLGPS label is formally triggered whenever the geometric center of the candidate peduncle's bounding rectangle registers at a vertical coordinate beneath the maximum vertical extent of the grape silhouette. Refer to Figure 3b for a representative instance.
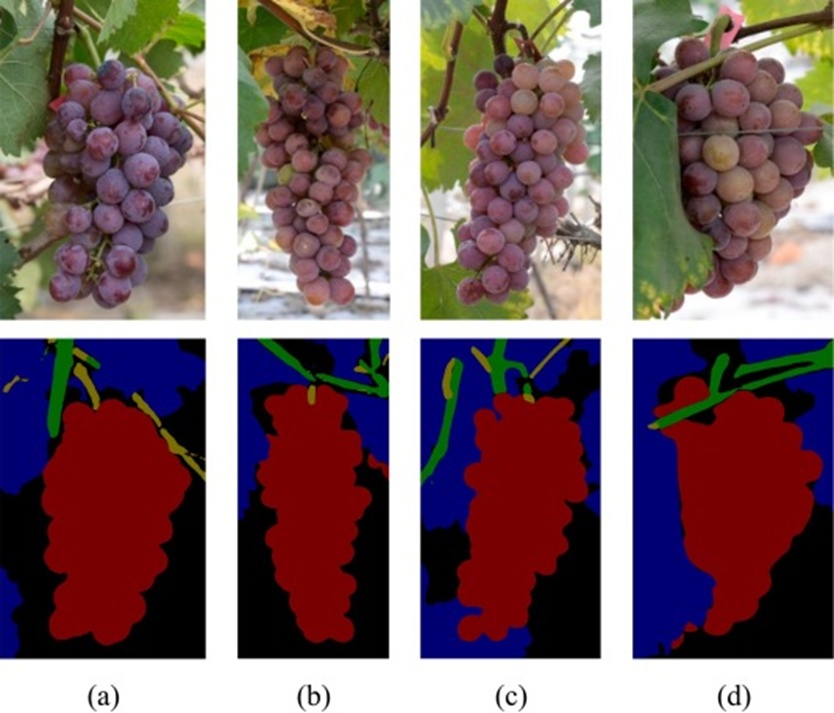
Figure 3. RGB images and corresponding prediction results of the CGPSD Dataset: (a) Common scenario (CS), (b) Short and low grape peduncle scenarios (SLGPS), (c) Grape peduncle occlusion and misidentification scenario (GPOMS), and (d) Severe misidentification of grape peduncles (SMGP).
3) Grape peduncle occlusion and misidentification scenarios (GPOMS): This category captures cases in which an intervening object physically eclipses a segment of the stalk, or in which a gradual chromatic transition from green tissue to lignified brown tissue fools the classifier into assigning an incorrect label. Should the fragmented, partly occluded peduncle edge segments prove amenable to geometric reunification, or if the semantic reasoning process successfully traces a credible trajectory following the peduncle's expected biological growth axis, the instance receives the GPOMS designation. Figure 3c provides an illustrative example, showing truncated peduncle segments and branch-level misclassifications caused by color gradient artifacts.
4) Severe misidentification of grape peduncles (SMGP): This extreme failure mode manifests when the peduncle surface is predominantly brown in appearance, or when critically low ambient illumination erodes the model's discriminative capacity to the point where the structure is consistently mistaken for a woody branch. If the peduncle's semantic footprint is either wholly absent from the prediction map or localizes to a position judged too low to support meaningful picking point anchoring, the scenario is classified as SMGP. Figure 3d illustrates this misidentification, underscoring the near-impossibility of reliable autonomous picking under such conditions.
To enrich dataset diversity and more faithfully approximate the heterogeneous visual statistics of genuine vineyard environments, this study augments the grape-picking-point image collection. Transformations drawn from a repertoire that includes Gaussian smoothing, global luminance perturbation (both brightening and darkening), and vertical-axis mirror reflection are stochastically applied to simulate the effects of shifting natural illumination and varied camera poses. The fully augmented dataset swells to 2460 images, with the breakdown of category frequencies tabulated in Table 1.
Table 1. Distribution of RGB images in the CGPSD.
Scenario | SMGP | GPOMS | SLGPS | CS |
Quantity | 159 | 362 | 492 | 1448 |
Proportion (%) | 6.46 | 14.71 | 20.00 | 58.86 |
SegFormer stands as a seminal contribution to the semantic segmentation literature, fusing the representational power of Transformer-style computation with the inductive biases of Convolutional Neural Networks (CNNs). Its core conceptual advance is the Mix Transformer (MiT) design. This backbone orchestrates the extraction of features across a spectrum of spatial resolutions, thereby enabling simultaneous capture of expansive object context and minute textural particulars at disparate scales. In a deliberate departure from orthodox Transformer formulations that append explicit positional encodings, SegFormer instead relies on implicit spatial awareness encoded by convolutional operations. This design decision reduces model complexity while boosting runtime efficiency. On the decoding side, SegFormer further integrates a streamlined, pixel-centric reconstruction scheme that aggregates the hierarchical multi-scale feature bank into a cohesive, high-resolution segmentation output, balancing categorical consistency and fine contour delineation in the resulting maps.
The Grape Picking Point Localization Algorithm (GPPLA) is a specialized picking-point estimation strategy designed for operation in unconstrained, naturalistic orchard settings. Its primary focus is the suite of ordinary harvesting configurations that robotic platforms routinely encounter in the field. The algorithmic logic decomposes these ordinary picking cases into a four-way taxonomy: standard configurations, multi-stalk configurations, irregular stalk configurations, and configurations complicated by branch interference. A block-level depiction of the algorithm's architecture is provided in Figure 1c. The system comprises three interlocking modules: GPRE, IPCS, and OPPL.
The GPRE sub-algorithm consumes the semantic label output and, by exploiting characteristic grape-shape priors, dynamically relocates and resizes the ROI bounding window in terms of vertical position, height, and breadth. In concrete terms, GPRE begins by extracting the centroid location (xc,yc), the horizontal span (Lmax), the vertical extent, and the upper extreme coordinates (xt, yt) of the grape contour. It then invokes Eqs. 1-3 to derive the ROI center coordinates (Roix, Roiy) together with the ROI height (RoiH) and width (RoiW), consequently fixing the ROI spatial envelope.
 (1)
(1)
 (2)
(2)
 (3)
(3)
Where Lmax signifies the grape contour's horizontal width, yc corresponds to the centroid's vertical coordinate of the grape contour, and yt represents the vertical coordinate marking the grape contour's highest boundary.
The IPCS sub-algorithm receives contorted stalk outlines as input and returns a collection of incision templates that partition the perimeter of an aberrant stalk into multiple well-conditioned segments. It monitors the curvature orientation along the stalk, detects feasible incision loci, and suppresses extraneous template candidates. The retained templates are then applied to section the stalk into morphologically coherent portions.
The OPPL sub-algorithm is charged with identifying, from a pool of prospective stalks, the single most appropriate peduncle upon which to base the picking point. In particular, the segmented regular stalks emitted by IPCS must be assessed equally to isolate the best option. In practice, OPPL introduces a pair of evaluative criteria: the stalk's horizontal breadth and its peak offset from the reference abscissa (cx). These two measures are jointly processed to determine the optimal picking point for the stalk.
For an exhaustive walkthrough of the GPPLA pipeline, the reader is directed to [27]. Although GPPLA performs adequately under benign, conventional harvesting conditions, its robustness erodes as scene complexity increases. The root cause lies in the algorithm's heavy reliance on upstream semantic segmentation output; it can only perform picking-point inference based on whatever semantic information is accurately predicted. This tight dependency becomes particularly crippling under adverse conditions—such as stalk occlusion or instances where the segmentation model commits severe labeling errors—since the unavailability of trustworthy semantic evidence directly undermines the accuracy of picking point determination.
As grape harvesting robots transition to operation in complex, real-world settings, the fundamental constraints of the semantic segmentation model are thrown into sharp relief, especially when faced with non-uniform illumination, obstructed stalks, or scenarios where stalk color closely mimics that of surrounding woody canes. The semantic signal that the perception frontend extracts often proves too impoverished to support reliable picking-point computation. Such informational scarcity robs the downstream algorithm of the capacity to mount effective inferential maneuvers at pivotal decision junctures, ultimately manifesting as mislocalized picking coordinates.
An effective harvesting apparatus demands perceptual and cognitive faculties of sufficient sophistication to elevate both the proportion of successful harvests and spatial precision, while simultaneously minimizing collateral fruit damage. In response to the multifaceted, challenging picking scenarios encountered across vineyard environments, this study introduces a SegFormer-driven semantic reasoning and picking-point localization framework, schematically depicted in Figure 1b.
At a granular level, the present work proposes three central modules: the Semantic Reasoning Module (SRM), the ROI Threshold Adjustment Strategy (RTAS), and the Picking Point Optimization Module (PPOM). First, to counteract extreme stalk misdetection, obscuration by intervening obstacles, and partial stalk mislabeling, the SRM was architected to conduct an additional tier of inferential analysis over the perceived semantic landscape. For cases characterized by stalks that are simultaneously truncated and positioned low, the RTAS was introduced to iteratively explore and adaptively reshape the ROI boundaries. In the final step, the PPOM was integrated to administer a supplementary refinement pass over the picking coordinate. Owing to the coordinated cooperation of these three modules, the algorithm achieves substantially higher processing capability and operational robustness across complex picking settings, thereby securing both harvesting productivity and positional reliability.
Relative to the GPPLA algorithm, whose scope is bounded by ordinary picking conditions, the research reported here not only improves performance on standard scenarios but also achieves tangible accuracy gains across a broad range of demanding harvesting situations (SLGPS, GPOMS, and SMGP), demonstrating demonstrably superior resilience. Additionally, as illustrated in Figure 1, the reported method builds directly on GPPLA by incorporating three novel constructs—SRM, RTAS, and PPOM—and their associated logical decision flows. By introducing a semantic reasoning paradigm, the algorithm can perform supplementary picking-point deduction even when the available semantic evidence is sparse or corrupted. Experimental assessment substantiates that the proposed solution yields cumulative performance gains, with the serial integration of successive optimization modules delivering stepwise improvements in picking point localization accuracy and repeatability.
The Semantic Reasoning Module (SRM) is specifically conceived to address two prototypical problematic situations: scenarios wherein stalk semantic content does appear within the ROI, yet the computed picking point coordinates fall beneath the grape contour's apex gh (a condition traceable to stalk obstruction or partial misclassification), and scenarios wherein stalk semantic content is absent from the ROI (indicating severe misrecognition). The decision flow governing SRM is shown in Figure 4.
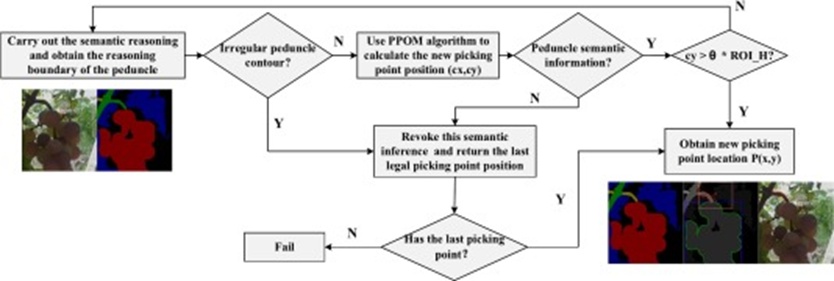
Figure 4. Processing flowchart of the SRM.
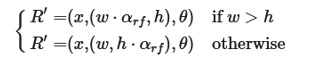
The SRM routine begins by enclosing the stalk contour C within the minimal-area oriented bounding rectangle R, following Eq. 4: , where MinBoundingRect refers to the OpenCV library function cv2.minAreaRect. This operation yields the oriented rectangle of smallest area that fully contains the provided contour. The stalk's elongation trajectory is deduced from the angular tilt of R. To enlarge the search corridor for subsequent reasoning steps, the bounding box is extruded along this deduced growth direction under the control of a reasoning factor αrf, generating an updated rectangle R′ according to:
 (5)
(5)
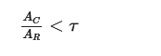
Where θ designates the inclination of R, and w together with h denote its width and height. To preserve the integrity of the reasoning attempt, a dual-criterion safeguard is enforced. Should the merged stalk contour become disconnected or adopt an excessively irregular form, the reasoning attempt is abandoned. Contour irregularity is quantitatively assessed via Eq. 6, which evaluates the ratio of the stalk contour's enclosed area AC to the area of its enclosing minimal rectangle AR:
 (6)
(6)
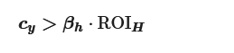
Where τ denotes a pre-established threshold parameter, the formal definition of irregular stalk contour conditions can be consulted in the IPCS component of GPPLA [27]. In the final step, the prospective picking point (cx, cy) undergoes scrutiny in the PPOM module. If the semantic label queried at location (cx,y) does not register as stalk, the reasoning attempt is deemed unsuccessful, and processing is suspended. Furthermore, the reasoning step is prematurely terminated whenever cy exceeds the vertical limit prescribed by Eq. 7:
 (7)
(7)
Where cy represents the picking point's vertical coordinate, βh corresponds to the height scaling factor, and ROIH captures the vertical dimension of the region of interest.
Under stalk occlusion, when reasoning fails, the system automatically reverts to the most recently confirmed localization fix to maintain operational continuity. In severe misrecognition circumstances, a mechanism that retrospectively traverses historical localization records is activated to maintain functionality to the greatest possible degree.
The outcomes attributable to the SRM are exhibited in Figure 5. Initially, the harvesting platform surveys the working scene, as depicted in Figure 5a. Application of SegFormer for semantic segmentation yields the prediction map presented in Figure 5b. Following this, the picking point is estimated, with Figure 5c exposing the coordinates returned by the baseline GPPLA algorithm, which contain blatant errors. Figure 5d illustrates the situation after the SRM has been applied. Subsequently, when the enhanced GPPLA method is deployed, as shown in Figure 5e, the accurate picking point location is successfully identified and visually marked in Figure 5f.
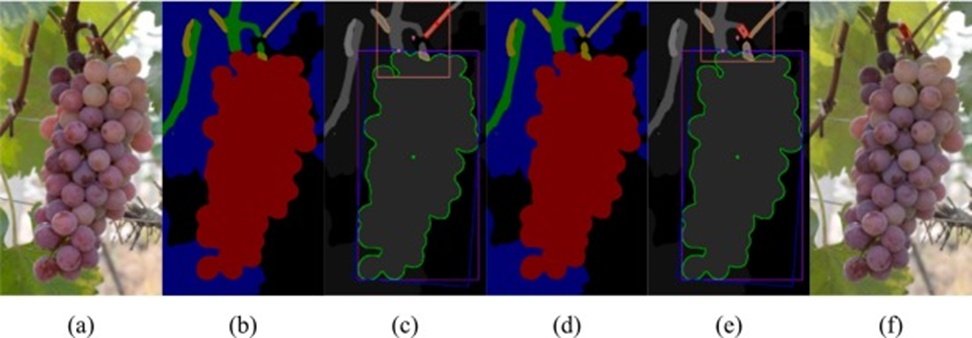
Figure 5. Semantic reasoning results and picking point localization in SLGPS: (a) Original image, (b) Semantic segmentation results, (c) GPPLA localization results, (d) Semantic reasoning results, (e) Improved GPPLA localization results, and (f) Visualization of the picking point on the original image.
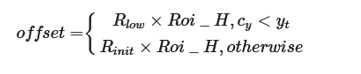
The ROI Threshold Adjustment Strategy (RTAS) is a mechanism specifically designed to address the complications posed by vertically compressed peduncles positioned near the ground plane. The sequence of operations that constitute this strategy is charted in Figure 6. As a starting condition, the framework imposes a factory-calibrated displacement of 0.2 units along the bottom edge of the ROI window, a parameterization that ensures the opening search for a picking coordinate accounts for any stalk-associated semantic fragments that may reside below the uppermost extremity of the grape mass. This design choice mitigates the risk of committing to an erroneously depressed picking location stemming from incomplete perceptual data. Should the initial sweep of the ROI uncover no stalk-related semantic material, the lower-boundary offset is recomputed using Eq. 8, and a reparameterized ROI is subsequently materialized using Eq. 9.
 (8)
(8)
Within these formulations, Rlow serves as the regulatory coefficient that determines the magnitude of vertical ROI enlargement sanctioned by RTAS in a short-stalked configuration. Rinit embodies the preset offset originally assigned to the ROI's basal edge in its nascent state. The variable cy holds the current vertical coordinate of the tentative picking target, while yt records the vertical coordinate associated with the grape silhouette's crown.
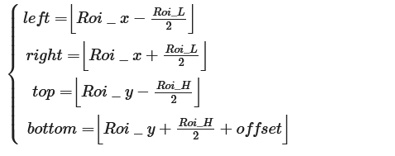 (9)
(9)
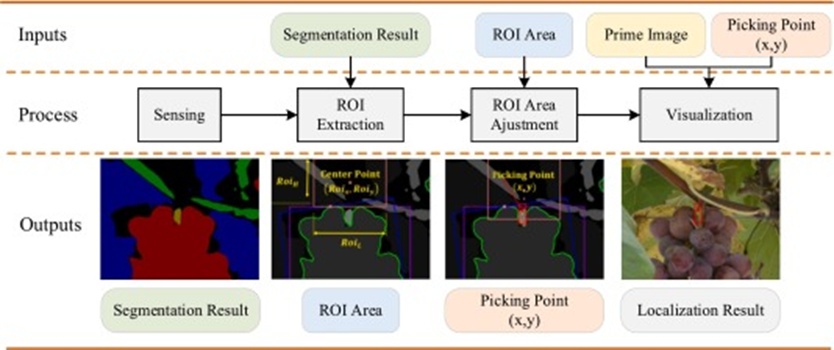
Figure 6. Algorithm flowchart of the RTAS.
Figure 7 supplies a visual chronicle of the effects unleashed by RTAS when deployed against instances featuring squat, abbreviated peduncles. The exhibited evidence unambiguously confirms that this strategic intervention dismantles the recognition obstacles historically associated with such stalk geometries, yielding a pronounced increase in picking-point identification accuracy under these specific field conditions.
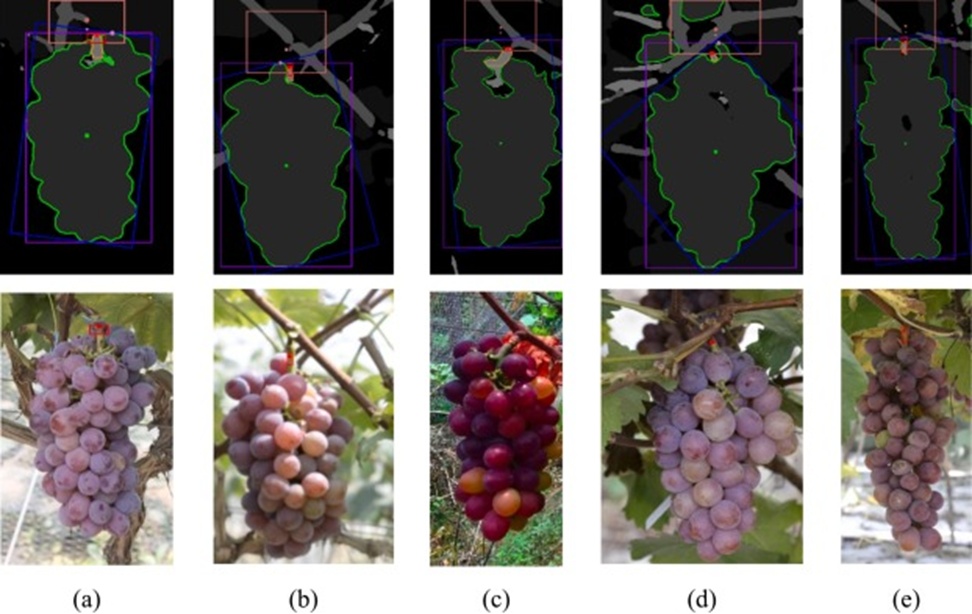
Figure 7. Picking point localization results for low and short peduncles using RTAS.
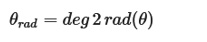
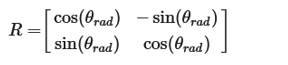
Upon entering the Picking Point Optimization Module (PPOM), the computational workflow initiates by circumscribing the candidate stalk perimeter with a minimum-area, orientation-preserving bounding quadrilateral, a step formalized by Eqs. 10 and 11. The fitted quadrilateral's angular offset θ is then transmuted into radian measure θrad as stipulated by Eq. 12. The attendant 2D rotational transformation matrix R is assembled per Eq. 13. The operation that follows translates the positional shift into the world coordinate system by way of Eq. 14. The procedure culminates in the derivation of the optimized picking-point coordinates via Eq. 15. Through this ordered succession of geometric operations, PPOM furnishes both spatial fidelity and computational tractability for picking-point specification within the workspace accessible to the harvesting manipulator.
 (10)
(10)
 (11)
(11)
 (12)
(12)
 (13)
(13)
 (14)
(14)
 (15)
(15)
Figure 8 juxtaposes the picking-point placements before and after PPOM-mediated correction. Markers colored yellow indicate the initial, unrefined estimates, whereas their red-hued counterparts denote the adjusted positions. Inspection of Figures 8a and 8b reveal that the corrected picking sites align far more favourably with the kinematic demands of the end effector's grasp-and-detach maneuver. The sequences shown in Figures 8c-8e underscore a further hazard: persisting with the uncorrected coordinates would situate the picking locus at a position encroaching upon—or falling beneath—the grape cluster's peak contour line. This arrangement would almost inevitably bruise or lacerate the fruit. The refined coordinates, in stark contrast, are universally positioned above this critical contour threshold, thereby enabling harvest actions that are either wholly atraumatic or produce only superficial marking.
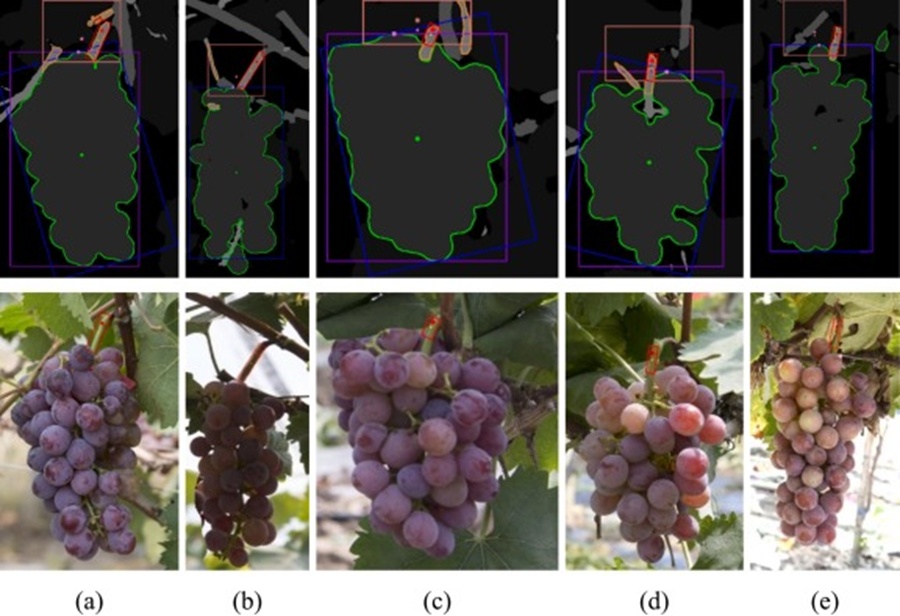
Figure 8. Optimization results of picking points using the PPOM algorithm.
The present subsection catalogues the computing machinery and accompanying software environment within which the semantic segmentation investigations were conducted. The battery of segmentation trials was conducted on a workstation in the laboratory; a comprehensive tabulation of the system's technical characteristics is presented in Table 2.
Table 2. Experimental hardware and software configuration parameters for the workstation.
Hardware and software configuration | Parameters |
CPU | Intel i5–7400 |
GPU | NVIDIA GeForce GTX 4090 |
Operating system | Ubuntu 18.08 LTS |
Memory | 64G |
Programming languages | Python3.8 |
CUDA | 10.2 |
Deep Learning Framework | Pytorch1.12.1 |
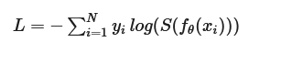
During the model fitting phase, encoder backbones that had undergone preparatory pretraining on the ImageNet-1K benchmark were used to initialize the parameter values for training on the grape semantic segmentation dataset. Pursuing the dual objectives of accelerated convergence and loss suppression, the following hyperparameter constellation was adopted: a mini-batch cardinality of 4, a weight decay coefficient of 0.0001, and a momentum constant of 0.9. The network parameter updates were performed using Stochastic Gradient Descent (SGD), enabling end-to-end training. For architectural families such as Deeplab v3, Deeplab v3 plus, and the PSPNet series, the training protocol comprised 80,000 parameter update iterations; for the SegFormer and SegNeXt families, the protocol was extended to 160,000 iterations. Supplementary to these settings, a per-class weighted variant of the cross-entropy loss function was employed. Its analytical specification is rendered in Eq. 16:
 (16)
(16)
In this expression, N indicates the cardinality of the semantic class set, S represents the softmax normalization operator, y corresponds to the empirical ground-truth probability that training exemplar x genuinely belongs to the category under consideration, and fθ(x) denotes the unnormalized prediction score emitted by the model for that same exemplar–category pairing.
The ensuing segment documents a comparative evaluation of the semantic perceptual acuity provided by a range of segmentation architectures. The guiding purpose is to select the perception backbone whose performance profile best matches the exigencies of complex vineyard harvesting scenarios, thereby endowing the downstream picking-point localization subsystem with semantic measurements of the highest attainable precision.
The assessment framework uses the numerical criteria enumerated below to capture segmentation quality and runtime economy jointly. The Intersection over Union (IoU) metric provides a per-class gauge of the spatial overlap between the reference annotation mask and the model-generated prediction mask. To synthesize an overarching performance figure, the mean IoU (mIoU) is computed by averaging the IoU scores over the complete ensemble of semantic classes, as expressed in Eq. 17.
 (17)
(17)
Where k+1 totals the number of semantic categories inclusive of the background designation, pii tallies those pixels correctly classified as belonging to class i, and pij counts pixels whose authentic class is i but which the model assigns, in error, to class j.
Because the picking-point localization procedure is highly dependent on the ability to separate stalk tissue from structural branch tissue, this study assigns particular diagnostic importance to the IoU metrics for the peduncle and branch categories, respectively abbreviated as P_IoU and B_IoU.
To identify the segmentation model optimally matched to the picking-point localization mandate, comparative trials were conducted across a panel of canonical architectures, namely Deeplab v3 [35], Deeplab v3+, SegFormer, PSPNet, and SegNext. As clarified in the annotation accompanying Table 3, within the Deeplab and PSPNet naming conventions, the suffix "R50b" denotes a ResNet-50 backbone equipped with bottleneck-compressed residual units for parametric parsimony. In contrast, the unadorned "R50" suffix indicates a ResNet-50 built from standard, uncompressed residual blocks, yielding a structurally more straightforward variant. Among the SegFormer offerings, the range B0-B4 denotes a progression of model scales and complexities, from the most compact (B0) to the most expansive (B4). In the SegNext catalogue, the labels "b", "s", "t", and "l" distinguish configurations that trade off model size, computational footprint, and predictive accuracy.
Table 3. P_IoU, B_IoU, and mIoU values for different semantic segmentation models.
Model | P_IoU | B_IoU | mIoU (%) | |
Deeplab v3 | Deeplabv3-R50 | 72.26 | 82.65 | 71.68 |
Deeplabv3-R50b | 74.15 | 83.85 | 71.76 | |
Deeplabv3-R101 | 71.60 | 82.33 | 69.79 | |
Deeplabv3-R101b | 73.72 | 83.71 | 72.21 | |
Deeplab v3 plus | Deeplabv3 plus R101 | 73.79 | 83.60 | 71.91 |
Deeplabv3 plus R101b | 74.59 | 83.92 | 73.04 | |
SegFormer | SegFormer-B0 | 74.52 | 83.78 | 74.01 |
SegFormer-B1 | 73.24 | 83.68 | 73.38 | |
SegFormer-B2 | 75.63 | 84.54 | 73.90 | |
SegFormer-B3 | 74.45 | 84.05 | 73.49 | |
SegFormer-B4 | 74.85 | 84.28 | 73.93 | |
SegFormer-B5 | 74.07 | 84.18 | 73.70 | |
PSPNet | PSPNet-R50 | 73.72 | 80.48 | 69.14 |
PSPNet-R101 | 72.04 | 83.45 | 71.56 | |
SegNext | SegNext-b | 73.50 | 82.54 | 71.92 |
SegNext-s | 73.80 | 82.93 | 72.52 | |
SegNext-t | 72.18 | 81.65 | 71.32 | |
SegNext-l | 69.45 | 79.83 | 68.36 | |
The conclusive findings from the segmentation benchmarking exercise are assembled in Table 3. The SegFormer-B2 variant was ultimately selected for achieving an mIoU of 84.54%, a P_IoU of 75.63%, and a B_IoU of 73.90%. The competence to faithfully resolve the semantic signatures of both peduncles and branches is an absolute prerequisite for the reliable functioning of the subsequent picking-point localization stage. A per-class IoU breakdown for the SegFormer-B2 model is supplied in Table 4.
Table 4. IoU values for each category of the SegFormer-B2 model.
Category | mIoU | Leaf | Branch | Peduncle | SUB | CDY | MUH | Backgroud |
IoU (%) | 84.54 | 83.93 | 73.90 | 75.63 | 94.23 | 94.36 | 94.11 | 75.63 |
Throughout this subsection, the picking-point localization algorithms ingest the semantic interpretation arrays generated by the perception backbone endorsed earlier. A comparative assessment pitting the proposed method against alternative picking-point localization formulations is undertaken. Complementarily, a set of ablation experiments that systematically excise each of the three proposed optimization modules is conducted to validate their respective dependability. The subsection concludes with a visual exposition of localization outcomes and a diagnostic review of instances in which the algorithm fails to converge to the correct picking coordinate.
As shown in Table 5, the proposed picking-point localization framework was evaluated on a test bed comprising 2460 images sampled across four archetypal complex harvesting conditions. Through surgically targeted revisions to both the algorithm's inferential logic and its modular composition, statistically significant performance improvements were observed across all examined scenarios, demonstrating the compounding effect of the progressive enhancements. Most dramatically, the activation of the RTAS protocol precipitated a steep reduction in the failure count under the SLGPS classification, from 94 to 18. Analogously, the assimilation of the SRM technique produced a pronounced improvement within the SMGP category, where the count of failed localizations fell from 103 to 24. Aggregated, these two refinements alone drove an 8.14% absolute increase in the aggregate localization success rate. In its final instantiation, the algorithm correctly determined the picking coordinate in 2335 of the 2460 test images, yielding a success rate of 94.96% and a residual failure rate of 5.09%.
Table 5. Experimental results of the grape cluster picking point localization algorithms.
Localization results | Fail | Successful | ||||
CS | GPOMS | SLGPS | SMGP | |||
GPPLA | Quantity | 82 | 45 | 94 | 103 | 2136 |
Proportion | 3.33 | 1.82 | 3.82 | 4.18 | 86.82 | |
Improved GPPLA | Quantity | 58 | 25 | 18 | 24 | 2336 |
Proportion | 2.27 | 1.01 | 0.73 | 0.97 | 94.96 | |
This segment details an ablation investigation dissecting the SRM, RTAS, and PPOM components to substantiate the trustworthiness of each discrete optimization element. As Table 6 shows, the engagement of the RTAS mechanism yields a substantial uplift in algorithmic performance across all four complex scenario families, with the most transformative impact observed under the SLGPS condition, where the count of missed localizations was reduced from 94 to 18. Moreover, integrating the PPOM component improves the spatial calibration of the picking coordinate, easing the motion-planning burden on the robotic manipulator and contributing a modest incremental improvement to the overall localization success metric. Ultimately, with the further incorporation of the SRM component, the harvesting success statistics for both the GPOMS and SMGP conditions undergo a significant positive shift. To highlight the most striking example, in the SMGP condition, the number of localization failures was reduced from 84 to 31, enabling the system to scale its peak success rate to 94.96% across 2336 images. A minor qualification must be registered: inferential inaccuracies traceable to the SRM module result in a slight decline in localization success rate under the SLGPS condition. Viewed holistically, the SRM, RTAS, and PPOM modules exhibit a characteristic layering pattern of performance accumulation, collectively enhancing both spatial accuracy and operational consistency in picking-point localization.
Table 6. Performance comparison of SRM, RTAS, and PPOM in ablation experiments.
RTAS | PPOM | SRM | Fail | Successful | |||
CS | GPOMS | SLGPS | SMGP | ||||
Empty Cell | 82 | 45 | 94 | 103 | 2136 | ||
√ | 43 | 47 | 18 | 82 | 2270 | ||
√ | √ | 42 | 39 | 15 | 84 | 2280 | |
√ | √ | √ | 41 | 33 | 19 | 31 | 2336 |
This closing subsection presents the visual outputs of picking-point localization across the recognized scenario categories. Under CS conditions, as typified in Figure 9, the algorithm proves capable of deconstructing malformed stalk perimeters and, drawing on its semantic interpretation of the scene, homes in on the most suitable picking coordinate. For SLGPS conditions, where stalks are both foreshortened and low-slung, Figure 10 illustrates how the algorithm adapts and modulates the ROI threshold contextually to recover the correct picking coordinate. In GPOMS conditions characterized by either partial obscuration of the stalk or fragmentary labeling errors, Figure 11 reveals the manner in which semantic reasoning empowers the algorithm to elevate the designated picking point above the grape cluster's uppermost contour, guaranteeing a bruise-free harvest. Finally, under SMGP conditions, as shown in Figure 12, even when the segmentation engine systematically confuses peduncle regions with branch structures, the algorithm performs inferential operations on the degraded semantic information and, despite the corrupted input stream, accurately resolves the optimal picking coordinate.
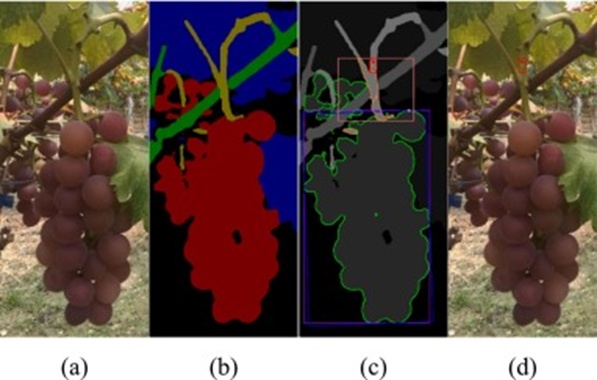
Figure 9. Semantic reasoning and picking point localization results in General Scenarios: (a) Original image, (b) Semantic segmentation result, (c) Picking point localization result, and (d) Visualization of the picking point on the original image.
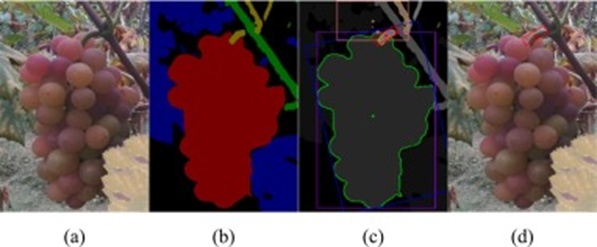
Figure 10. Semantic reasoning and picking point localization results in General Scenarios: (a) Original image, (b) Semantic segmentation result, (c) Picking point localization result, and (d) Visualization of the picking point on the original image.
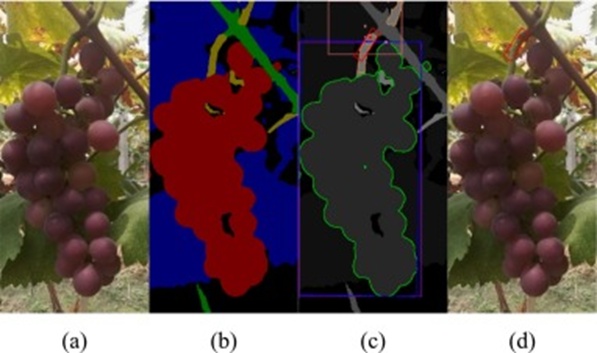
Figure 11. Semantic reasoning and picking point localization results in General Scenarios: (a) Original image, (b) Semantic segmentation result, (c) Picking point localization result, and (d) Visualization of the picking point on the original image.
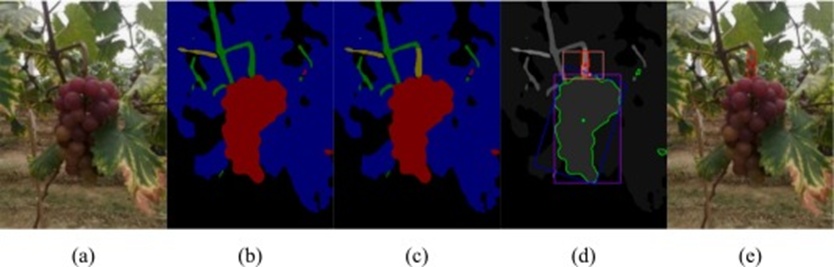
Figure 12. Semantic reasoning and picking point localization results in General Scenarios: (a) Original image, (b) Semantic segmentation result, (c) Semantic Reasoning Result, (d) Picking point localization result, and (e) Visualization of the picking point on the original image.
What follows is a dissection of instances where localization did not succeed, spread across four harvest condition categories, each unpacked through detailed causal tracing. Figure 13 shows a situation in which the bunch is tilted so that it rests on a lignified cane. This leaning posture alters, in a mild but significant manner, how the stalk sits spatially relative to the berries. A direct result is that the peduncle exhibits a wider sideways spread. Moreover, this frame was acquired under a setup purposefully made more challenging: foliage elements were shifted by hand to create a blockage effect. Why localization collapsed in this example boils down to two factors. The root cause lies in the segmentation network having confused certain leaf petioles with fruit stalks, a mix-up born of their comparable shape, which left deformed peduncle traces scattered within the region of interest (ROI). The proximal cause is that, even after the algorithm successfully partitions those deformed traces, the OPPL sub-unit cannot discriminate the genuine stalk from a set of similar-looking alternatives, thereby directly producing the erroneous coordinate.
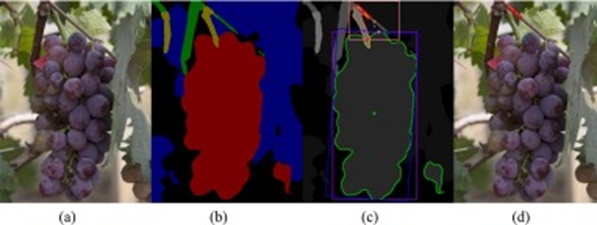
Figure 13. Localization failures in general scenarios: (a) Original image, (b) Semantic segmentation result, (c) Picking point localization result, and (d) Visualization of the picking point on the original image.
Figure 14 documents breakdowns where a fraction of the stalk is concealed behind another structure. Inspection of the panels shows that the unification of two separate grape regions occurs correctly. Despite this, localization goes awry primarily due to a set of interrelated issues. One, a leaf petiole sits directly in front of the fruit stalk, and the picking coordinate ultimately lands on that petiole instead. Two, a considerable expanse of the grape body itself is hidden by foliage, throwing off its overall shape signature—vertical extent information suffers the most distortion. This skew feeds into the ROI height derivation, leading to a large offset that prevents the system from converging on the correct harvesting locus.
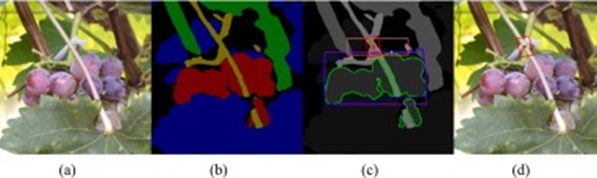
Figure 14. Localization failures in grape peduncle occlusion and misidentification scenarios: (a) Original image, (b) Semantic segmentation result, (c) Picking point localization result, and (d) Visualization of the picking point on the original image.
Figure 15 illustrates a failure that materializes under a configuration where the stalk is squat and positioned toward the ground, placing the derived picking site beneath the top rim of the grape bunch. Once again, the segmentation model commits an attribution error: a patch of branch is taken for a fruit peduncle, a mistake explainable by their shared appearance. The localization routine then anchors its output upon that misattributed zone, a step that inevitably yields an incorrect result. Figure 16 displays episodes of extreme misrecognition of the stalk. Here, branch occlusion is in effect, and the algorithm deserves credit for successfully merging three disjointed grape segments into a unified whole for further processing. Nevertheless, the compound effect of interference from leaf petioles, the predominantly brown colouration of the stalk surface, and the minimal green portion of that stalk leads the segmentation model to label it wrongly. That labelling error ultimately sabotages the localization outcome.
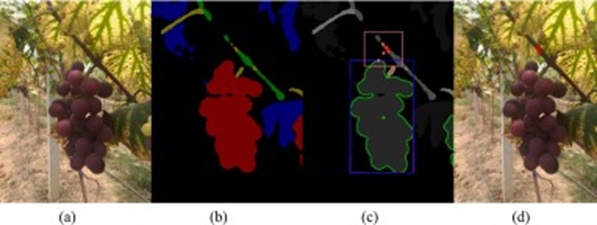
Figure 15. Localization failures in short and low grape peduncle scenarios: (a) Original image; (b) Semantic segmentation result; (c) Picking point localization result; (d) Visualization of the picking point on the original image.
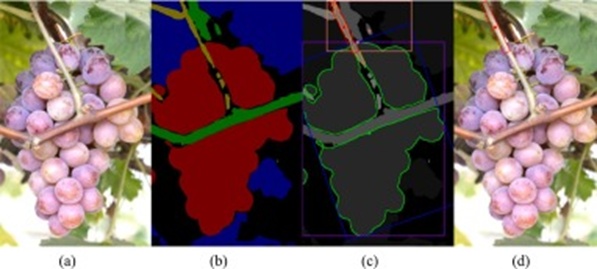
Figure 16. Localization failures in severe misidentification of grape peduncles: (a) Original image, (b) Semantic segmentation result, (c) Picking point localization result, and (d) Visualization of the picking point on the original image.
Over the course of the experiments, four distinct augmentation operations were applied, each aimed at replicating the visual effects of varying natural light and camera poses. This subsection presents those operations side by side to assess their effects on the algorithm's output. Patterns visible in Figure 17 indicate that, though picking coordinates are reliably found when the algorithm processes untouched source imagery, performance diverges depending on which augmentation is applied. Such performance variance confirms that the augmentation techniques genuinely expand the variety of scene conditions encoded in the dataset. At the same time, a reasonably flat success profile was maintained across the four augmentation types. One clear exception emerged: localization success dipped notably when blur was introduced. This drop indicates that image softness poses a serious threat to the accurate identification of picking points. The practical takeaway is straightforward—motion-induced smearing during live harvesting must be minimized to keep the algorithm operating at peak performance.
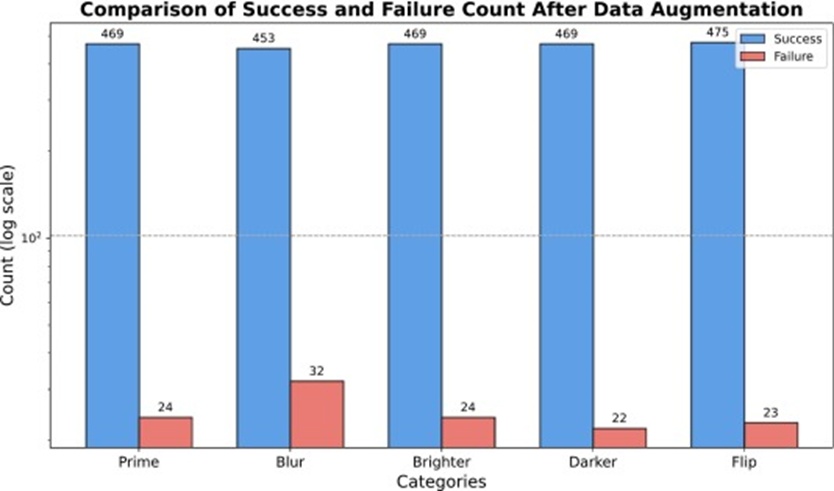
Figure 17. Comparison of successful and failed localization numbers after data augmentation.
This part of the study measures the time consumed by the proposed localization pipeline during actual execution. In particular, the forward-pass duration of the SegFormer semantic segmentation component and the reasoning time of the picking-point localization component are recorded. The measurement protocol involved 20 full repetitions across the 2460-image dataset, with results reported as the mean computed from those 20 repetitions. Figure 18 presents the data logged from one such repetition. Analysis of the accumulated measurements reveals that across all 2460 images, the mean prediction time for the SegFormer model is 0.1278 ± 0.0240 s, indicating stable, narrowly distributed prediction latencies. The picking point localization component posted a mean inference time of 0.5428 ± 0.0063 s. Notably, those images that fall into the complex harvesting scenario classes consume additional inference time. When both stages are combined, the end-to-end processing time equals 0.6707 ± 0.0236 s. These timing figures confirm that the algorithm's speed is fully adequate for the operational cadence demanded by automated table-grape picking, supplying a theoretical basis for the mechanisation of table-grape harvest.
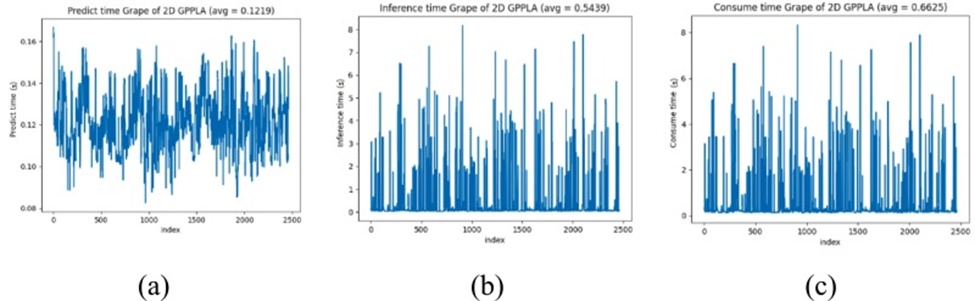
Figure 18. Inference time of Improved GPPLA on 2460 images: (a) Average prediction time of the SegFormer semantic segmentation model, (b) Average inference time of the picking point localization algorithm, and (c) Average total processing time of the Improved GPPLA algorithm.
The body of work described in this manuscript offers a hardened method for determining picking points amidst the messy reality of vineyard environments. The developed technique leverages the SegFormer semantic segmentation framework for environmental perception, achieving mIoU of 84.54%, B_IoU of 75.63%, and P_IoU of 73.90% on the dedicated grape segmentation dataset. Seeking to push semantic interpretation to a higher plane, this investigation weaves in semantic reasoning. It presents three central constructs: the Semantic Reasoning Module (SRM), the ROI Threshold Adjustment Strategy (RTAS), and the Picking Point Optimization Module (PPOM). These advances, acting in synergy, raise the bar for picking-point precision, yielding a success rate of 94.96% across a broad range of harvesting conditions—an 8.14% increase over the baseline alternative.
Certain limitations persist, however. The current pipeline is built on 2D image-fed semantic segmentation, a foundation that reveals substantial weaknesses when grape bunches overlap or stack. Since a 2D photograph captures only a planar projection of semantic content, stacking and occlusion events wipe out semantic information, obstructing any faithful reconstruction of how grape clusters genuinely occupy three-dimensional space. The fallout includes muddled morphological features, increased difficulty separating adjacent boundaries, and a compromised ability to position picking coordinates correctly. To move beyond these barriers, upcoming research will explore integrating 3D point cloud data and leveraging volumetric spatial measurements to circumvent the inherent shortcomings of planar segmentation, thereby further strengthening the accuracy and reliability of point localisation. Taken as a whole, this research delivers a credible answer to several core obstacles to intelligent agricultural harvesting, advancing autonomous picking technologies toward field-ready maturity.
This work was supported by the National Natural Science Foundation of China, China (32171909, 52205254, 32301704); the Guangdong Basic and Applied Basic Research Foundation, China (2023A1515011255, 2020B1515120050, 2024A1515010199); the Key Research Projects of Ordinary Universities in Guangdong Province, China (2024ZDZX1042, 2024ZDZX3057); the Guangdong key R & D projects, China (202080404030001).
The authors declare the following financial interests/personal relationships which may be considered as potential competing interests: Jinshuan Wang is currently employed by Zhuhai Mojie Technology Co., Ltd.
None
None
Open Access The author(s) retain copyright. This article is licensed under the Creative Commons Attribution-NonCommercial-ShareAlike 4.0 International License. It may be shared and adapted for non-commercial purposes with appropriate attribution, an indication of changes, and distribution of adaptations under the same license. Third-party material may be subject to separate terms identified in its credit line. View the license at https://creativecommons.org/licenses/by-nc-sa/4.0/.
 Agro Intelligence Research Press