Leaf blight, caused by bacterial and fungal infections, threatens plant health by inducing leaf discoloration and reducing crop yield. To address this, we propose a MobileNetV3-based classifier for the Jasmine plant, leveraging streamlined Convolutional Neural Networks (CNNs) to precisely identify disease stages. The design combines depthwise convolutional layers with max-pooling layers to extract superior features, focusing on vital low-level features that signal the condition. Via preprocessing methods that include data augmentation with a Conditional GAN and Particle Swarm Optimization for feature selection, the classifier achieves reliable performance. Assessment on carefully assembled datasets shows a remarkable 97% training accuracy, demonstrating its potency. Real-world trials across varying settings, including severe camera tilts and fluctuating illumination, verify the model’s durability, delivering test accuracies within the 94% to 96% range. The dataset’s bespoke structure for CNN-based classification ensures the reliability of the outcomes. Notably, the model’s compact classification, characterized by swift processing speed and minimal size, makes it a practical choice for immediate deployment. This all-encompassing strategy highlights the presented classifier’s value in managing leaf blight spot disease difficulties in cash crops.
Global agriculture continually faces threats from the rising frequency of crop diseases caused by bacteria, fungi, and viruses. Such pathogenic attacks not only imperil various cultivation stages but also trigger significant yield declines, undermining global food security [1-3]. The fallout from these afflictions extends beyond farming, shaping human dependence on vegetation for basic provisions such as sustenance, dwellings, and clothing, most acutely in impoverished locales [4, 5]. A multitude of investigations have catalogued the harmful consequences of bacterial and fungal invasions on varied flora, among them tomatoes, cassava, strawberries, tobacco, and the broadly cultivated jasmine shrubs of Southeast Asia [6-9]. Amid these numerous scourges, jasmine specimens are at risk of Alternaria leaf blight, which initially appears as yellowish blemishes with dark brown rings and yellow halos [10]. With disease progression, these marks expand, enveloping sizable leaf areas and eventually culminating in blight exhibiting concentric circles within the wounds. The affliction continues to compromise the stalk, leaf stalks, and blossoms, requiring swift and precise identification for effective mitigation [11, 12] Prompt recognition of leaf spots in blight spot disease is critical for maximizing yield. CNN-powered frameworks have been deployed for diagnosing botanical diseases using foliage images. For example, a CNN architecture combining the Inception-v1 module with Inception ResNet-v2 was used for grapevine leaf disease identification [13]. A separate inquiry focused on tomato leaf disease detection and sorting using a CNN model paired with the Learning Vector Quantization (LVQ) algorithm, employing 500 tomato leaf photos showing four disease indicators [14]. Situational cues from leaf attributes were harnessed utilizing a blended methodology [15]. CNN-based strategies for detecting botanical leaf diseases across multiple collections, covering cassava, tomato, cotton, and tobacco, have likewise been reported [16-20]
Additionally, recent scholarship [21-24] has highlighted the pressing need for refined models trained in heterogeneous environments, underscoring a widespread concern largely tied to the use of small datasets. This shortcoming not only curtails the generalizability of constructed models but also erodes their capacity to faithfully mirror the manifold presentations of plant sicknesses across dissimilar settings. Leaning on restricted data pools saps models’ robustness and malleability, narrowing their relevance to real-world situations and mixed farming landscapes. To address this deficiency, our proposed scheme seeks to overcome these hurdles by integrating cutting-edge tools, specifically Conditional Generative Adversarial Networks (CGANs), to generate a comprehensive and diverse dataset for jasmine leaf spot disease detection. This tactic aims to bolster the adaptability and capabilities of the categorization model, yielding more stable, usable answers in agrarian contexts. This inquiry introduces a pioneering approach by leveraging a Conditional GAN to generate a jasmine leaf dataset that faithfully mimics blight spot affliction.
Beyond that, a CNN-driven classifier protocol is engineered to effectively pinpoint various leaf disease grades, enhancing the originality of this exploration. The offerings of this undertaking consist of:
1. This manuscript presents an innovative image-powered classification schema, purpose-built to differentiate the distinct progression stages of leaf blight spot syndrome in jasmine plants.
2. This exploration introduces a preliminary data augmentation procedure using a Conditional GAN. Through this procedure, 10,000 fabricated Jasmine plant depictions were created to broaden the heterogeneity and size of the instructional dataset.
3. The attribute curation operation for sorting blight spot disease in Jasmine flora is enhanced by deploying Swarm Particle Optimization. By engaging this refinement procedure, the sorting precision leaps markedly to 97%.
4. The soundness of the proposed approach is demonstrated by comparing it with established CNN categorizers from the literature. Moreover, its mettle is gauged through leaf image compilations, including those tied to leaf spot diseases in alternative crops such as cassava and tomato.
The paper’s configuration proceeds as laid out. Contemporary efforts to detect leaf disease across the scholarship are recounted, followed by the methodology and results and discussion, which lay bare the offered framework and the trialing outcomes. The inquiry concludes with a wrap-up.
Over the past few years, numerous strategies have emerged for sorting diseased leaf imagery. These methodologies can be divided into two broad classes: conventional approaches and those built upon deep learning architectures.
Systems for leaf recognition have been engineered by combining Bag-of-Features (BOF) descriptors with Local Binary Pattern (LBP) texture representations [25]. These combined descriptors function as the foundation for decision-making processes. A multiclass classifier rooted in a support vector machine (SVM) performed the sorting task. The investigation by [26] delved into machine learning techniques, specifically SVM and Random Forest (RF), for foliage-based disease identification, aiming to boost farm yields while keeping costs minimal. Assessment metrics included Root Mean Square Error (RMSE), Peak Signal-to-Noise Ratio (PSNR), and leaf area impacted by disease, determined via Euclidean Distance Methods. [27] introduced a quartet of preprocessing operations designed to suppress noise within the foliage image collection. In parallel, [28] drew on established classification methods, including the K-Nearest Neighbors (KNN) technique, to categorize plant foliage based on morphological attributes such as hue, brightness levels, and physical dimensions. A range of machine learning techniques—Naive Bayes (NB), Decision Tree (DT), KNN, and RF—were examined, with the RF approach achieving the highest accuracy of 79.23% for maize categorization [29]. Still, the bulk of machine learning approaches found it challenging to achieve high classification rates due to difficulties in isolating truly distinctive traits. As a remedy, combined frameworks that pair a CNN-powered feature extraction engine with an SVM classifier have been proposed to refine the sorting pipeline [30], achieving a classification accuracy of 88.77%.
A body of scholarly work has advanced CNN-based methods for detecting foliage diseases, as reported in publications such as [31, 32], and [33]. That said, those solutions were tailored exclusively toward particular varieties of leaf image collections. To counteract the tendency of classifier models to overfit, practitioners have turned to data augmentation strategies [34, 35]. One study [36] operationalized the Skew Divergence approach to identify relevant features in Cotton Leaf Spot Diseases, while another [37] adopted correlation-based feature selection driven by a Genetic algorithm to pinpoint ailments in apple leaves. Prior investigations have shown that data augmentation, coupled with judicious feature selection in leaf picture analysis, can improve classification performance while mitigating overfitting.
A multitude of inquiries have confronted plant disease recognition through varied datasets and procedural frameworks. [38] leveraged color-difference-driven image partitioning and machine learning classifiers on a Guava foliage dataset, achieving measurable detection precision. By contrast, [39] focused on Apple disease spotting, deploying Mask R-CNN to isolate infected regions and SVM classifiers, ultimately achieving an ensemble accuracy of 98.12%. The exploration conducted by [40] focused on detecting disease in Cassava plants, using sophisticated block-wise processing and a Deep Residual Convolutional Neural Network (DRNN). In particular, DRNN outperformed the plain convolutional neural network (PCNN) by 9.25% on the Cassava Disease Dataset. Such results underscore the critical role of a resilient classifier in meaningful disease identification. Turning to cucumber disease diagnostics, [41] combined feature fusion, feature selection, and machine learning classifiers. Their system achieved roughly 93.5% accuracy, underscoring how sparsely deep learning-centric tactics are in this niche. [42] used Histogram Equalization and Automatic Feature Extraction to identify Apple disease using KNN. Their avoidance of deep learning techniques points to untapped opportunities in data augmentation and signals a need for compact yet powerful classifiers to address sector-specific hurdles. [43] introduced a fruit imagery dataset for assessing freshness, using a ResNet18 classifier. focused on mango disease recognition, leveraging binary segmentation enriched with textural and statistical features and fed into an artificial neural network (ANN). [44] examined predictive modeling for the Cassava Mosaic dataset, integrating Contrast Limited Adaptive Histogram (CLAHE) Equalization with a CNN and using a compact dataset, achieving limited accuracy of 93%, highlighting the importance of both expanding the dataset and fortifying the classifier’s resilience. [45] tackled Cassava disease spotting with a custom 15-layer CNN, achieving an impressive F1 score of 0.96 even with a small data pool. [21] approached the identification of Cassava disease using Gaussian blur preprocessing and a MobileNetV2 classifier. While the model achieved 97.7% accuracy on crisp images, its performance degraded sharply on degraded imagery [22] drew on the Plant Village dataset and paired it with EfficientNet B5 and B4 to validate their chosen technique in heterogeneous settings. [24] focused on potato leaves, employing DenseNet-201, and grappled with a dataset of limited scale. [23] applied Faster R-CNN to Apple disease identification, achieving a mean Average Precision (mAP) of 42%. These wide-ranging efforts feed into the continual advancement of the domain, foregrounding the need for robust classifiers and avenues for data augmentation. A side-by-side summary of prior techniques appears in Table 1.
Table 1. Summary of the existing methods used in plant disease detection.
Literature | Dataset | Preprocessing | Classification | Result and remarks |
Guava leaf and fruit dataset | Applied color difference image segmentation by integrating RGB and HSV histograms | Machine learning classifiers | Various machine learning classifiers were evaluated for guava leaf disease detection. | |
Apple dataset | Used MASK R-CNN to detect infected regions | SVM classifier | Ensemble classification achieved an accuracy of 98.12%. | |
Cassava dataset | Implemented detailed block processing techniques | Deep Residual Convolutional Neural Network (DRNN) | DRNN outperformed the Plain Convolutional Neural Network (PCNN) by 9.25% on the Cassava Disease Dataset. | |
Cucumber plant dataset | Performed feature fusion and selection for cucumber disease identification | Machine learning classifiers | The proposed approach achieved approximately 93.5% accuracy, though deep learning was not emphasized. | |
Apple dataset | Applied Histogram Equalization and Automatic Feature Extraction | KNN | Deep learning approaches were not incorporated in the study. | |
Fruit dataset | — | ResNet-18 classifier | A fruit image dataset was introduced for evaluating freshness detection. | |
Mango dataset | Used Binary Segmentation combined with textural and statistical feature extraction | ANN | The study employed a Binary Segmentation approach for classification. | |
Cassava Mosaic dataset | Applied Contrast Limited Adaptive Histogram Equalization (CLAHE) | CNN | The limited dataset size resulted in an accuracy of 93%. | |
Cassava dataset | — | Custom 15-layer CNN | The small dataset achieved an F1-score accuracy of 0.96. | |
Cassava dataset | Utilized Gaussian blurring techniques | MobileNetV2 classifier | The method achieved 97.7% accuracy on high-quality images, but performance decreased significantly on low-quality images. | |
PlantVillage dataset | — | EfficientNet-B5 and EfficientNet-B4 | The proposed method was evaluated under varying environmental conditions. | |
Potato leaf dataset | — | DenseNet-201 | The study was conducted using a relatively small dataset. | |
Apple dataset | — | Faster R-CNN | The detection model achieved a mean Average Precision (mAP) score of 42. |
The study at hand presents a MobileNetV3-driven classification framework designed to distinguish the distinct phases of Jasmine foliage disease. MobileNetV3 was deliberately architected to excel on mobile CPU hardware by leveraging hardware-conscious Network Architecture Search (NAS). As a streamlined neural architecture, it delivers standout classification performance when stacked against heftier counterparts like AlexNet, InceptionV3, and ShuffleNetV2 across image categorization benchmarks [47]. Figure 1 maps out the suggested pipeline, which incorporates several essential modules: a Data augmentation unit, a depthwise separable convolution unit, an inverted Residual unit, a feature extraction unit, a feature selection unit, and a classification unit.
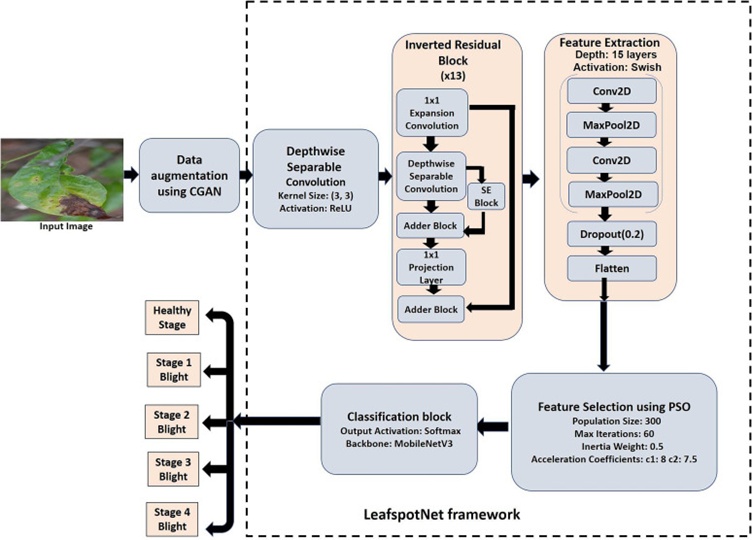
Figure 1. Overall proposed CNN classification algorithm for Jasmine plant leaf disease detection.
Figure 2 presents photographic samples of infected leaf stages employed throughout this research. To compile diseased leaf images, a cooperative arrangement was established with domain experts stationed at the Krishi Vigyan Kendra in Karnataka, India. Digital imaging devices were operated to gather a total of 2000 photographs. Said photographs span four progressive phases of Alternaria leaf blight, comprising 450 images for stage 1, 550 for stage 2, 500 for stage 3, and 500 for stage 4. To enrich the dataset, augmentation based on Conditional GANs was applied, as detailed in the upcoming subsection. To gauge the robustness of the proposed framework, two auxiliary datasets with analogous leaf-spot conditions were used. The first, labeled the “cassava dataset,” contained depictions of cassava leaf disorders [48]. The second, termed the “tomato dataset,” encompassed portrayals of tomato leaf disorders [49]. The following protocols were instituted to guarantee data soundness.
1. Collaboration with experts: Partnering closely with plant pathology authorities at the Krishi Vigyan Kendra ensures proper identification and staging of every captured image based on disease progression.
2. Structured dataset: The dataset maintains a rigorous organizational scheme wherein pre-specified image counts correspond to each disease phase, yielding a methodical portrait of symptom development.
3. Image capture with digital cameras: Using digital photography equipment for image acquisition enhances the dataset’s fidelity by capturing high-quality images that accurately reflect the outward signs of the illness.
4. Augmentation techniques: The deployment of Conditional GAN-driven augmentation enriches the dataset by introducing greater diversity, including additional permutations of symptom expression. This operation proves indispensable for cultivating a resilient model prepared for a spectrum of real-world conditions.
5. Incorporation of additional datasets: Incorporating two external datasets showcasing closely related leaf spot disorders (cassava and tomato collections) enables appraisal of the proposed technique’s transferability across botanical species. This further cements the dataset’s credibility by probing the model’s generalization capacity.
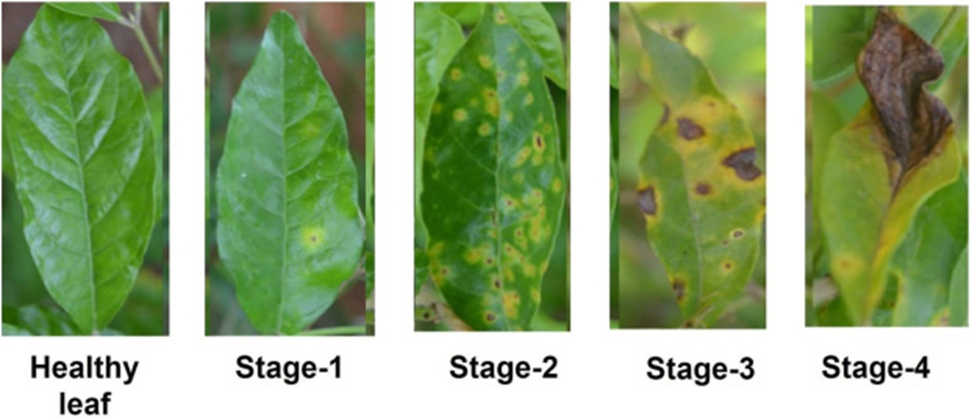
Figure 2. Jasmine plant leaf spot disease dataset.
A Conditional Generative Adversarial Network (CGAN) employs a conditioning parameter to generate novel instances that belong to a predetermined class [50]. Providing this conditional input enables the Generator component of the CGAN to generate artificial specimens aligned with the specified condition. In Generative Adversarial Networks, Convolutional Neural Networks (CNNs) are widely used, particularly for handling visual data. CNN architectures have consistently achieved remarkable results across diverse computer vision challenges, repeatedly securing leading-edge performance. Regarding the GAN architecture, the Generator ingests a compact latent representation from the training image corpus and produces entirely new visual outputs. The augmentation procedure drew upon a collection of 2000 pictures. These images were partitioned into separate groups for model development. Among them, the training batch contained 450 disease-free examples per category, functioning as the source material. Additionally, a template batch included portrayals of various leaf disease progressions, woven directly into the training procedure.
Additionally, the setup incorporated a 100-unit vector, assembled from randomly generated values sampled from a uniform distribution with boundaries 0 and 1. Every input picture possesses dimensions of 256 × 256 pixels. To generate outputs at a terminal resolution of 256 × 256 pixels in the RGB color space, a generator architecture composed of a series of Convolutional Transpose layers was used. On the other hand, the discriminator branch was equipped with two convolutional layers, each with 128 neurons, using kernel sizes of (3, 3) and strides of (2, 2) to downsample the incoming data and progressively compress its spatial footprint. Across all layers, LeakyReLU served as the nonlinear activation, and the terminal output was normalized using a hyperbolic tangent. The entire training regimen leveraged the ADAM optimization algorithm. Generator training explicitly aims to foil the discriminator’s ability to accurately distinguish between synthetic and authentic images. The GAN is optimized to suppress the Ladv loss term, which is iteratively refined as training progresses.
This cyclical tuning procedure aims to minimize the Frechet Inception Distance (FID) metric, keeping it below 3, a quantitative standard for assessing the model’s output quality. The GAN architecture completes 100 full training cycles with mini-batches of 64 samples each. To assess correspondence between synthesized results and template imagery, evaluation criteria such as the Structural Similarity Index (SSIM) and Signal-to-Noise Ratio (SNR) are used as fidelity metrics. The complete workflow is illustrated in Figure 3.
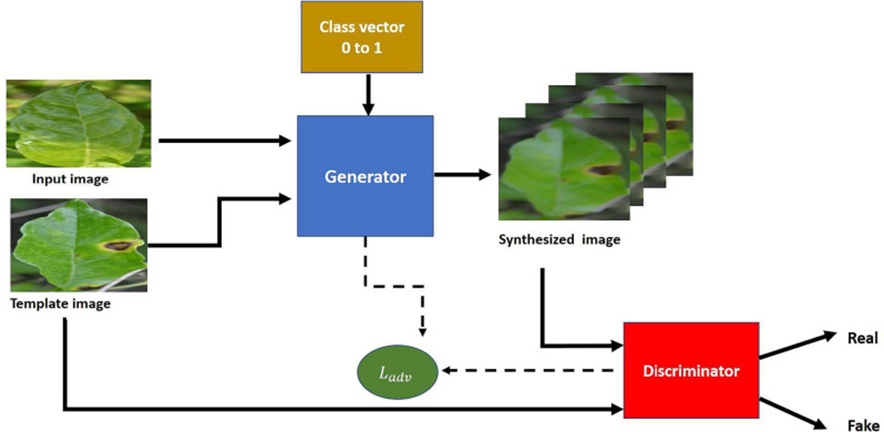
Figure 3. Data augmentation using the ConditionalGAN approach.
By exploiting the stage-1, stage-2, and stage-3 Jasmine plant templates, supplemented with multiple healthy leaf specimens as inputs, the GAN architecture successfully synthesized imagery depicting different disease phases. The framework folded a 100-length class vector with values ranging from 0 to 1, enabling the production of 100 images per round. This looping mechanism enabled the generation of 10,000 cumulative pictures spanning diverse categories. Augmented outputs subsequently advanced through the classification pipeline for continued processing, as detailed in the upcoming subsection.
Identification of jasmine leaf plant ailments is accomplished via a MobileNetV3-grounded CNN classifier, elaborated upon in the subsection that follows.
MobileNetV3 operationalizes a pioneering computational mechanism known as depthwise separable convolution. While conceptually akin to conventional convolution, this technique institutes a bifurcated computation sequence. Where standard convolution performs a single filtering computation at each layer, depthwise separable convolution splits the operation into two distinct phases. Throughout the first phase, each input channel receives its own dedicated convolutional filter with a 3 × 3 kernel, followed by batch normalization and an activation function. This particular phase is designated depthwise convolution. Moving to the second phase, the output channels from the depthwise convolution are further refined by a 1 × 1 pointwise convolution. The pointwise operation is applied across the entire set of depthwise convolution output channels. Taken together, the deployment of depthwise separable convolution yields substantial computational savings by dramatically reducing the total number of operations. Table 1 provides an exhaustive specification of the classification architecture, including details on Convolution layers 1 and 2. Throughout this research endeavor, the depthwise convolution layer is denoted conv_dw, whereas the pointwise convolution layer is labeled conv_pw. An identical procedure is repeated for layers 3 through 12, with the final convolutional layer identified as layer 13. The progressive parameter compression across successive layers is shown in Table 2.
Table 2. Overview of the LeafSpotNet classification network framework, featuring MobileNetV3 large as the backbone architecture.
Name | Layer | Meter | Feature para maps |
Input_1 | InputLayer | 0 | 3 |
conv1 | Conv2D | 864 | 32 |
conv1_bn | BatchNormalization | 128 | 32 |
conv1_relu | ReLU | 0 | 32 |
conv_dw_1 | DepthwiseConv2D | 288 | 32 |
conv_dw_1_bn | BatchNormalization | 128 | 32 |
conv_dw_1_relu | ReLU | 0 | 32 |
conv_pw_1 | Conv2D | 2048 | 64 |
conv_pw_1_bn | BatchNormalization | 256 | 64 |
conv_pw_1_relu | ReLU | 0 | 64 |
conv_pad_2 | ZeroPadding2D | 0 | 64 |
conv_dw_2_bn | BatchNormalization | 256 | 64 |
conv_dw_2_relu | ReLU | 0 | 64 |
conv_pw_2 | Conv2D | 8192 | 128 |
conv_pw_2_bn | BatchNormalization | 512 | 128 |
conv_pw_2_relu | ReLU) | 0 | 128 |
conv_dw_3 | DepthwiseConv2D | 1152 | 128 |
conv_dw_3_bn | BatchNormalization | 512 | 128 |
conv_dw_3_relu | ReLU | 0 | 128 |
conv_pw_3 | Conv2D | 16,384 | 128 |
conv_pw_3_bn | BatchNormalization | 512 | 128 |
conv_dw_13 | DepthwiseConv2D | 9216 | 1024 |
conv_dw_13_bn | BatchNormalization | 4096 | 1024 |
conv_dw_13_relu | ReLU | 0 | 1024 |
conv_pw_13 | Conv2D | 1,048,576 | 1024 |
sequential_1 | Sequential | 17,928 | 128 |
dense_1 | Dense | 645 | 5 |
The inverted residual block, used in bottleneck-centric network designs, provides the architectural inspiration for MobileNetV3’s formulation. To amplify the acquisition of multifaceted representations whilst curtailing model computational load, MobileNetV3 intertwines 1 × 1 expansion and projection convolution layers together with depthwise convolutions featuring a kernel span of 1 × 1. This compositional arrangement contains both a depthwise separable convolution layer and a residual pathway. Additionally, MobileNetV3 incorporates a channel-wise Squeeze & Excite (SE) block [51] to extract channel-wise characteristics from the foliage collection selectively. To enhance accuracy, the conventional ReLU activation in that layer is replaced by a newly proposed activation function, termed Swish, defined by Eq. 1.
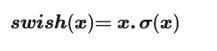 (1)
(1)
Where σ(x)=1/(1+exp(-x)) represents the sigmoid operation, the sigmoid element embedded within the swish expression could potentially consume considerable computational capacity. Inside MobileNetV3, resorting to the ReLU6 function for approximating the sigmoid portion within swish generates a close approximation of the swish function, alternatively named the hardened version of swish, symbolized as h−swish(x) and delivered through Eq. 2.
 (2)
(2)
For harvesting an expanded set of attributes linked to leaf spotting, depthwise 1 × 1 convolution layers are introduced. The extracted feature collection is then compressed using a max-pooling operation. The classifier is trained on the ImageNet-21k dataset [52] and implements a Transfer Learning (TL) paradigm with the foliage dataset. Incoming visuals are normalized to a uniform resolution of 224 × 224 pixels. The pre-existing model backbone is fine-tuned on the leaf dataset, enabling it to adapt to the distinctive properties of leaf spotting patterns. The output from the pointwise 1 × 1 convolutional stratum, serving as a pre-classification stage, is flattened to yield a feature vector. Each resultant feature vector, comprising 128 pixels, is fed into the subsequent feature selection phase.
To extract elementary signals from the foliage dataset images, additional convolutional layers are added to the architecture. This addition, however, inflates the feature dimensionality. Seeking a resolution, the feature selection module presents the Swarm Particle Optimization algorithm. The said algorithm facilitates the discarding of superfluous attributes before the classification phase. Particle Swarm Optimization (PSO), also known as the Bird Swarm algorithm, was first described by Kenny et al. in 1995 [53]. PSO is implemented as a randomized optimization procedure for feature selection and categorization objectives [54]. The overarching aim is to consistently identify the set of features with the highest relevance and utility, thereby elevating the classification capability of the leaf spot identification framework. Initially, all particles assume starting values, and fitness evaluations are computed for each particle. The existing fitness measure is then scrutinized; if it surpasses its predecessor, an update occurs. By contrast, should the earlier fitness assessment prove superior, it is retained unchanged [55]. This cycle proceeds without interruption until convergence upon the optimal solution. The PSO algorithm is formulated as an equation [56]. In the realm of feature selection for image classification, particularly in the niche of plant disease identification, the goal is to identify a compact subset of attributes that maximally improve classification accuracy. PSO garners favor for its proficiency in navigating the inherently combinatorial landscape of feature selection challenges.
 (3)
(3)
Within our framework, the velocity vector of each particle, P, is bounded by wmax and wmin, where w denotes the inertia coefficient. The temporal step t corresponds directly to the population’s iterative count i, thereby establishing the boundaries of our feature search domain. The dimensionality of the exploration space is captured by d. Acceleration constants are indicated as c1 and c2, whilst r1 and r2 signify sampled stochastic values independently. The individually best-encountered configuration is archived as P best, and the globally optimal configuration is archived as Gbest through the swarm optimizer [56, 55].
Following the feature selection operation is an elimination round in which non-contributing features are removed via an optimized filtering procedure. The classification unit then engages a softmax activation to sort leaf samples into the four delineated phases of blight spot progression.
The pursuit of maximal classification capability led us to fine-tune across 50 complete passes, each processing 32 samples at a time. For weight updates, the Adam rule was used with a fixed step size of 0.001. The values governing the PSO mechanism were determined through systematic experimentation, and the final values are presented in Table 3. Though initial parameter assignments were based on theoretical principles, their real-world calibration evolved through hands-on testing, as documented in Table 3. Cycling through this refinement loop brought the model into harmony with the inherent variability of botanical image collections, demonstrating its capacity to adapt and respond to the subtle complexities of plant imagery for reliable disease recognition.
Table 3. Parameters of PSO for the feature selection obtained experimentally.
Parameters | Description | Value |
N | Size of the population | 300 |
T | Iteration | 60 |
C1 | Cognitive factor | 8 |
C2 | Social factor | 7.5 |
wmax | Maximum bounded on inertia weight | 0.9 |
wmin | Minimum bounded on inertia weight | 0.6 |
Pmax | Maximum Velocity | 7 |
LeafspotNet — our proposed detection pipeline for leaf spot conditions that combines a Conditional GAN with an adapted MobileNetV3 backbone — follows the fine-tuning sequence outlined in Algorithms 1 and 2.
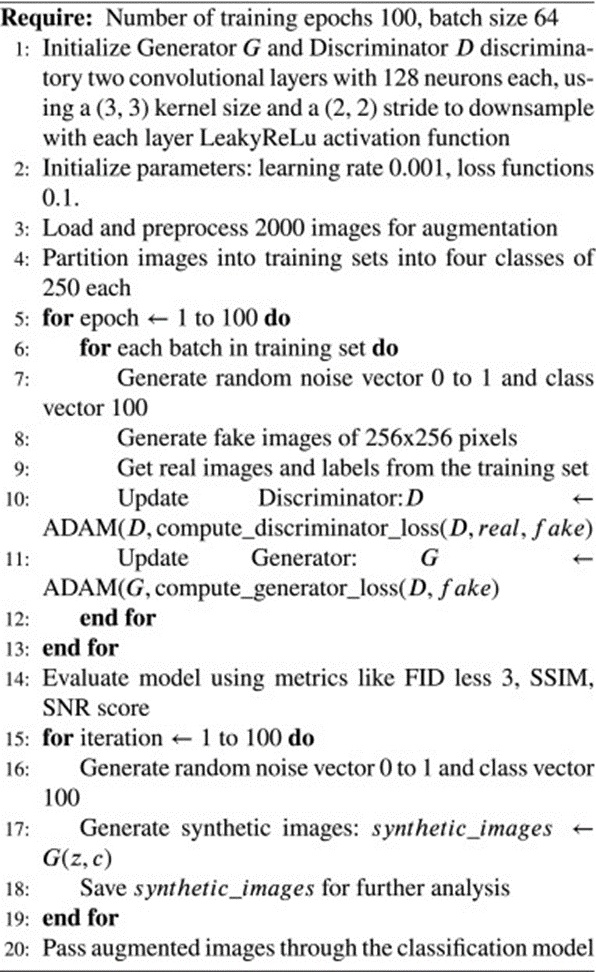
Algorithm 1. Conditional GAN augmentation for Jasmine leaf spot image generation
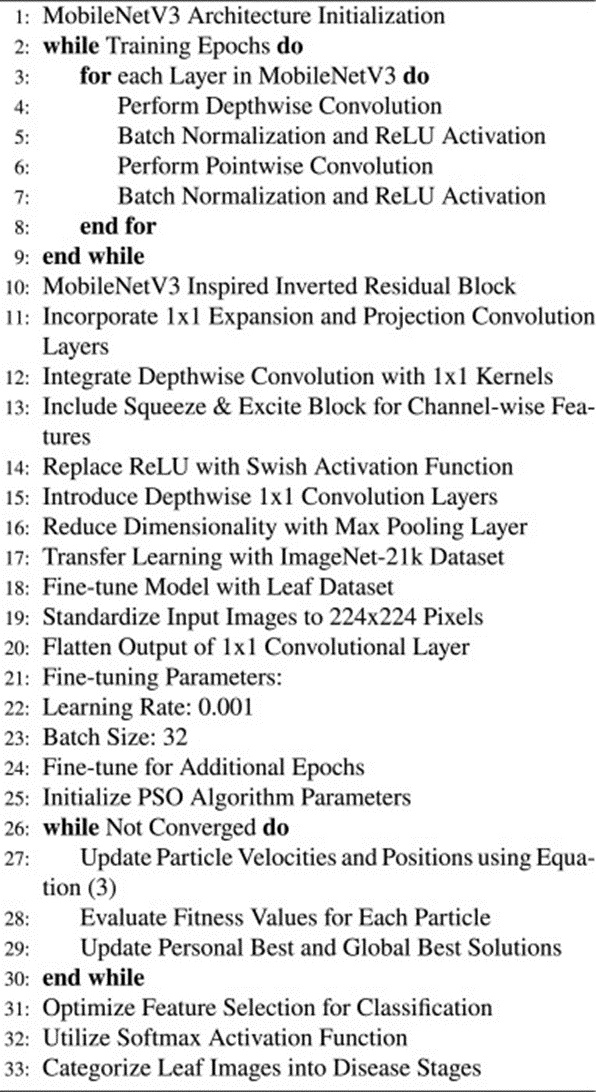
Algorithm 2. Leaf Spot Detection using MobileNetV3
A flowchart captures the end-to-end mechanics of LeafspotNet, tracing how the architecture gets trained on a blend of real captures and synthetic fabrications. Real-world imagery then serves as the proving ground, verifying that the trained system generalizes beyond its training distribution into practical deployment contexts, as visualized in Figure 4. By uniting a generator purpose-built for jasmine imagery enrichment with swarm-driven feature optimization, the overall design weaves together cutting-edge components to simultaneously fortify detection reliability and precision.
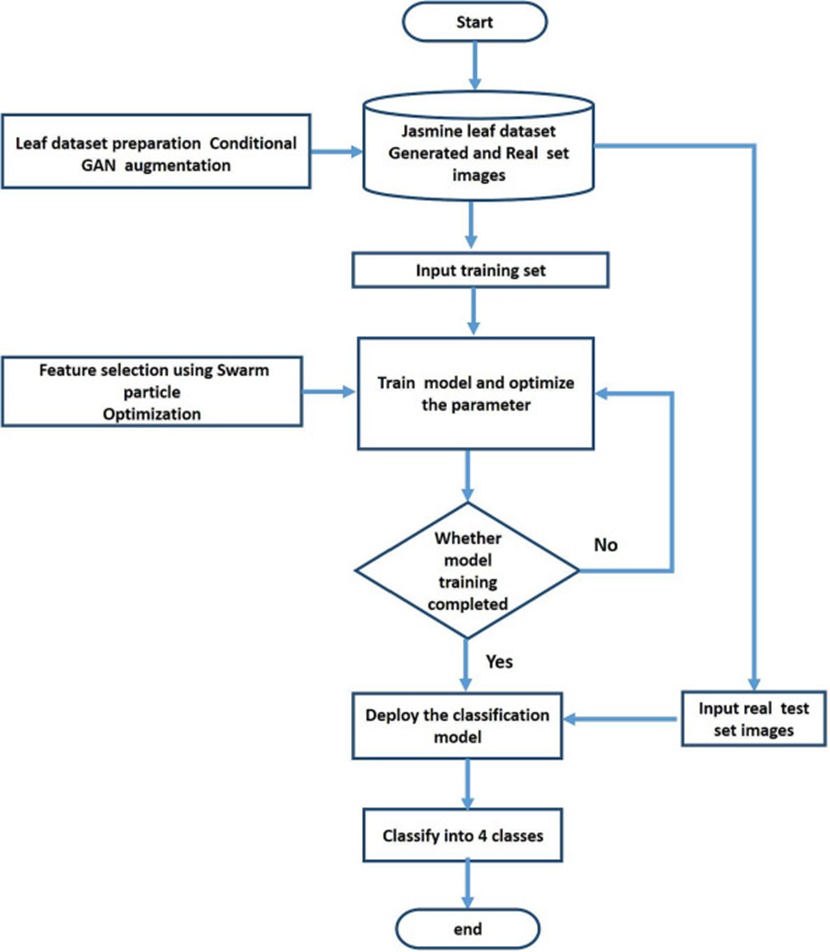
Figure 4. Overall flowchart of leaf spot disease detection.
Quantifying the contribution of the CGAN augmentation step requires measuring how closely synthetic outputs match the template originals. Two established similarity indicators are used for this purpose: Peak Signal-to-Noise Ratio (PSNR) and Structural Similarity Index (SSIM) [57], both operationalized in this context [58]. Together, these indicators shed light on the perceptual and statistical alignment between generated and reference imagery, supporting a well-rounded judgment of the augmentation module’s output fidelity.
Classifier assessment draws on Precision, Recall, F1 score, and overall accuracy. ROC graphs are constructed, with the Area Under the Curve (AUC) quantifying discriminatory strength. Additional diagnostic tools — namely the Confusion Matrix coupled with plots tracking accuracy across both training and validation splits — further illuminate classification behavior.
Benchmarking our proposed architecture against mainstream CNN baselines — VGG16, InceptionNetV3, and stock MobileNetV3 — allows for a direct performance comparison. All candidate architectures begin with ImageNet-21k pretrained weights and are subsequently adapted to our curated leaf collection. Each undergoes 50 training epochs, processing batches of 32 samples, with the Adam update rule using a base step of 0.001. Juxtaposing our model’s outcomes with these reference architectures reveals its relative standing and practical value for foliage classification workloads.
Stress-testing the classifier’s resilience involves feeding it cassava and tomato foliage images, each set containing examples of blight spots. The test pool draws upon 9000 cassava-origin samples and 8000 tomato-origin samples. All four disease progression stages factor into this robustness assessment.
An initial training run omits the feature selection module entirely, and the resulting metrics are captured. A subsequent run reintroduces that module. Across both executions, the hyperparameters remain fixed: 50 epochs, a batch size of 32, and the Adam optimizer with a learning rate of 0.001.
Generalization and sturdiness testing proceed by fine-tuning the proposed classifier separately against our in-house Jasmine collection, the public cassava leaf collection, and the public tomato leaf collection. The pretrained starting point gets independently adapted to each of these data pools under an identical hyperparameter regimen. Additionally, we construct hybrid training sets — Jasmine combined with cassava, Jasmine combined with tomato, and finally a unified pool merging all three sources.
This investigation subjects the classifier to deliberate stress through a battery of adverse capture conditions. The Jasmine test partition reserved for this stress analysis numbers 500 images gathered under deliberately varied circumstances: two smartphone models (designated Smartphone −1 and Smartphone −2), two camera bodies (Camera-1 and Camera-2), frames shot at steep inclinations, heterogeneous illumination regimes, and differing intensities of grain noise. Such a wide-ranging testbed mirrors the unpredictability of field conditions and probes whether the classifier’s learned representations transfer across these distribution shifts. Figure 5 presents visual samples of the test scenarios, illustrating the breadth of challenges confronting the classifier during this resilience examination.
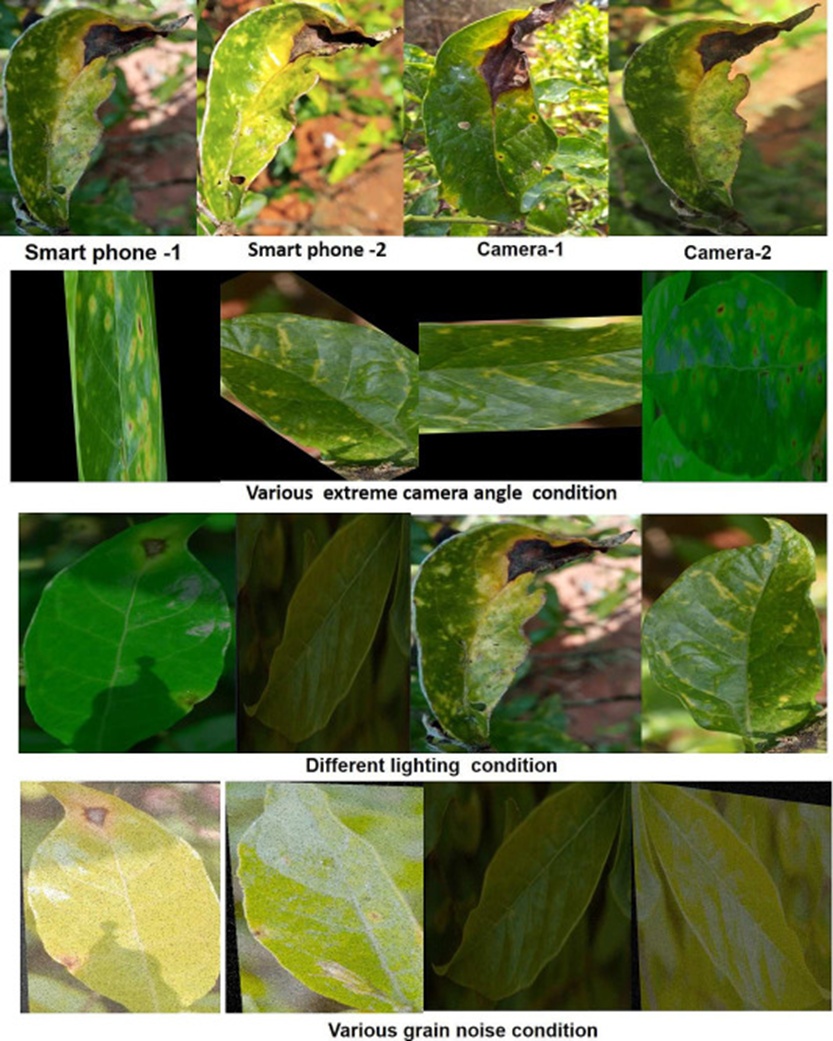
Figure 5. Jasmine leaf test dataset comprising images captured using various smartphones, cameras, lighting, and grain noise conditions.
This section documents: outputs from the CGAN-driven dataset expansion module; a side-by-side comparison of augmentation strategies within the classification pipeline; a thorough evaluation of the proposed leaf spot detection architecture; findings from ablation experiments; and a positioning of our methodology against the existing body of work.
The FID score enjoys broad recognition as a standard measure for judging how convincingly generated images replicate the statistical profile of authentic dataset samples. The training objective centers on steering the CGAN toward a stable FID within a targeted band, with the ideal hovering around 3, as shown in Figure 6. Maintaining FID within this neighborhood indicates that the generator’s outputs capture the essential characteristics of real photographs — delivering both perceptual realism and sample diversity. Stable FID trajectories signal that the training procedure has succeeded in producing lifelike imagery with meaningful variation.
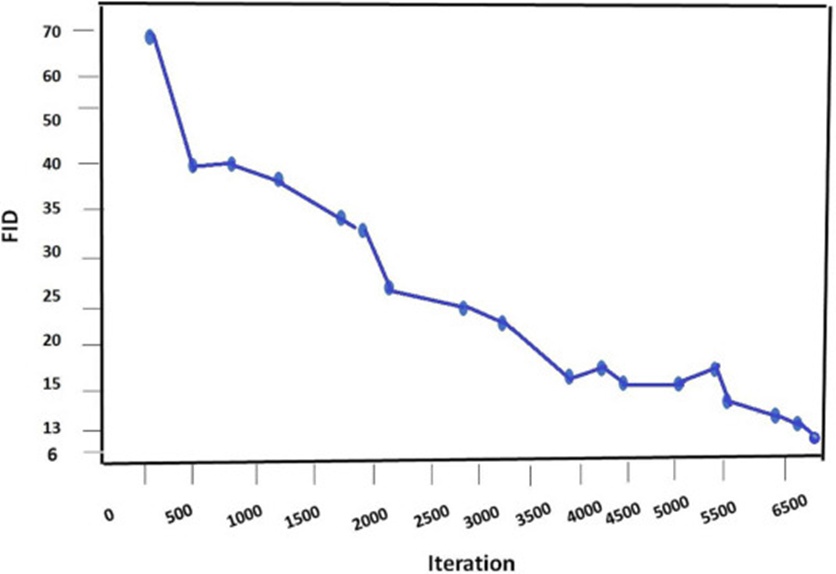
Figure 6. FID score on the Jasmine leaf dataset.
Augmentation yielded roughly 10,000 new images; representative samples are shown in Figure 7.
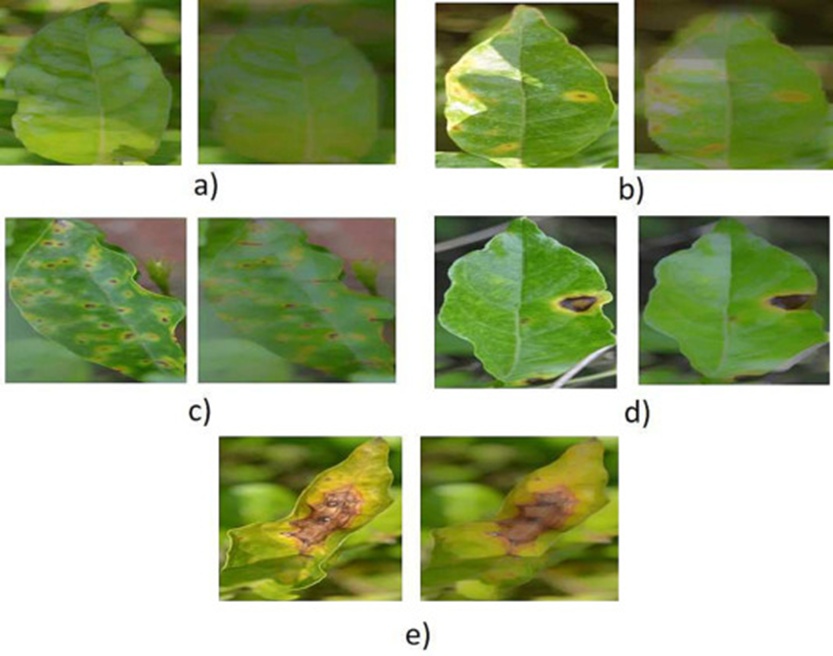
Figure 7. Augmented images using the CGAN Approach: a) Healthy leaf, b) Stage-1, c) Stage-2, d) Stage-3, and e) Stage-4 Jasmine plant leaf disease.
Our work relied on CGAN-driven augmentation to dramatically scale up the proprietary jasmine foliage dataset, ultimately reaching 2000 images per class label. SSIM gauges structural preservation — how faithfully the spatial arrangement of visual elements carries over from templates to generated counterparts. PSNR, in contrast, tracks color fidelity—measuring whether chromatic properties transfer intact. Statistical confidence for both SSIM and PSNR readings is based on averaging across 500 test samples; the aggregated findings are presented in Table 4.
Table 4. Evaluation metrics of methods.
Synthesized image | SSIM | P SNR |
Healthy leaf | 0.81 ± 0.02 | 17 ± 3.1 |
Stage-1 | 0.87 ± 0.011 | 18 ± 4.5 |
Stage-2 | 0.89 ± 0.072 | 23 ± 1.7 |
Stage-3 | 0.90 ± 0.072 | 25 ± 2.4 |
Stage-4 | 0.88 ± 0.072 | 27 ± 6.7 |
Table 5 assembles a comparative landscape of augmentation strategies drawn from prior plant disease detection literature, all evaluated on the Jasmine leaf benchmark. The surveyed methods encompass: cropping combined with mirroring [59], shift plus rotation transforms [60], Gaussian blurring [21], locality-based augmentation [61], and CNN-driven generation approaches [62]. Accuracy, precision, and F1 score form the basis for comparison across all candidates. What stands out is the margin by which the CGAN-based proposal surpasses alternatives — delivering accuracy of 0.93, precision of 0.96, and an F1 score reaching 0.97. These figures underscore the potency unlocked by pairing LeafspotNet’s classifier design with CGAN-synthesized training data, confirming its edge in achieving accurate, dependable plant disease categorization on Jasmine leaf imagery.
Table 5. Comparative analysis of data augmentation techniques employed in previous studies on plant disease detection during the classification process for the jasmine leaf dataset.
Technique | F1 Score | Precision | Accuracy |
Cropping, Mirroring [59] | 0.77 | 0.75 | 0.72 |
Shifting, rotating [60] | 0.79 | 0.71 | 0.72 |
Gaussian blurring method [21] | 0.84 | 0.85 | 0.87 |
CNN method [63] | 0.84 | 0.85 | 0.86 |
Local-Based [61] | 0.80 | 0.83 | 0.81 |
Proposed CGAN method | 0.97 | 0.96 | 0.93 |
CNN [62] | 0.84 | 0.84 | 0.82 |
Scaling up the number of training instances produced noticeable upticks in what the classifier could achieve. A concurrent effect, however, was the emergence of jaggedness and inconsistency across the training and validation accuracy readings, which bounced within a band spanning 88% to 90%. One can trace this unsteadiness back to the richer feature mining afforded by the enlarged data pool, itself a consequence of stacking further convolution and max pool layers into the architecture. To give visual form to this behaviour, Figure 8 plots the accuracy trajectories of LeafSpotNet when the feature selection component is not engaged.
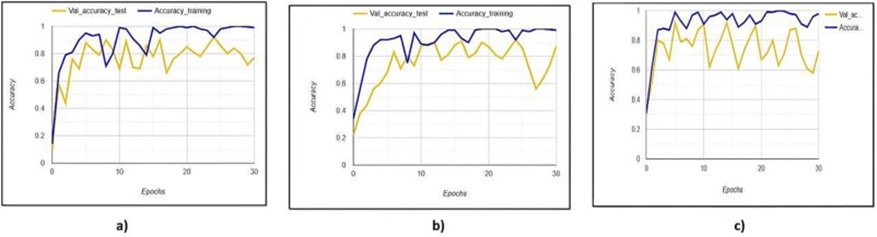
Figure 8. Training and validation curve of a) Jasmine plant leaf dataset, b) Cassava dataset, and c) tomato dataset before the PSO optimization algorithm.
The LeafSpotNet architecture was trialled on several distinct data sources. Once the PSO-guided feature selection pipeline was enabled, the system achieved 97% classification accuracy on the Jasmine plant corpus — a noteworthy high-water mark. Extended testing showed the framework hitting 94% on the Cassava corpus and 95% on the Tomato leaf corpus. To give these figures comparative meaning, several CNN backbones that appear perennially in the plant pathology imaging literature — namely VGG16, InceptionNetV3, and vanilla MobileNetV3 — were subjected to identical evaluation protocols. In this field, LeafSpotNet achieved the highest accuracy of 97%, as shown in Figure 9.
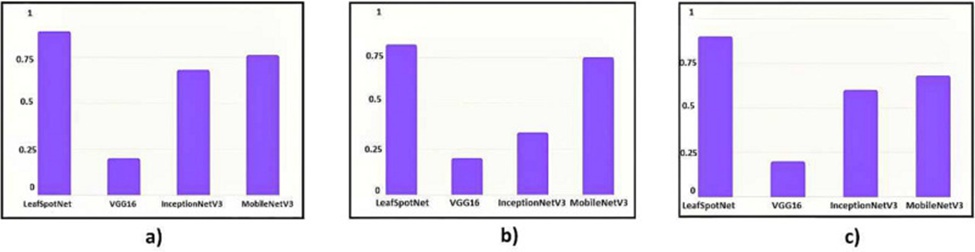
Figure 9. Classification accuracy graph of a) Jasmine plant leaf dataset, b) Cassava dataset, and c) Tomato dataset.
A triplet of performance indicators — Precision, Recall, and the F1 Score — was computed for LeafSpotNet alongside VGG16, InceptionNetV3, and MobileNetV3. The resulting bar groupings, shown in Figure 10, leave no doubt that LeafSpotNet outpaced all rivals across all metrics. A finer-grained analysis reveals that the architecture’s edge was sharpest on the privately held dataset compared with the publicly sourced cassava and tomato benchmarks. To enable detailed error inspection, confusion matrices were derived from held-out test partitions for all three corpora and are reproduced in Figure 11. Every matrix was built from a test slice comprising exactly 500 samples for each category label. These tables lay bare the classifier’s decision patterns — surfacing both correct assignments and systematic confusions between classes. Figure 12 presents the training and validation accuracy plots obtained after the PSO optimization module became operational. The visual narrative here is one of stabilisation: the troublesome oscillations have largely subsided, supplanted by a smooth and predictable progression. This evening-out of the learning curve points directly to the PSO mechanism successfully reining in overfitting, thereby shrinking variance and sharpening consistency.
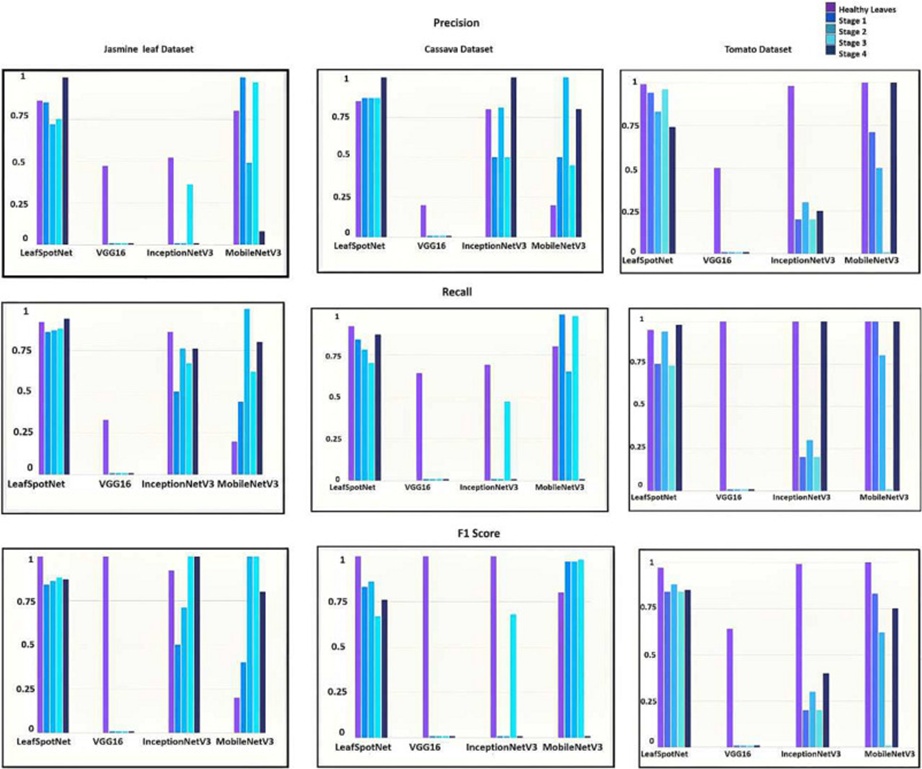
Figure 10. Performance matrix of proposed LeafSpotNet, VGG16, InceptionNetV3, and MobileNetV3 for Jasmine plant leaf, Cassava, and tomato leaf datasets.
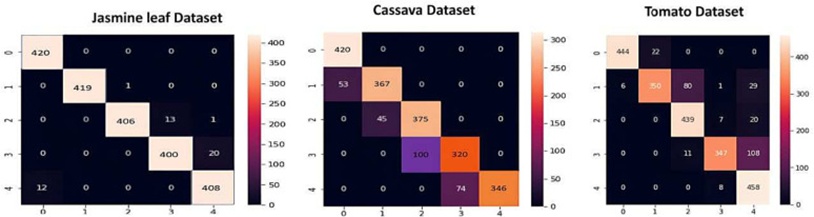
Figure 11. Confusion matrix obtained for different datasets.
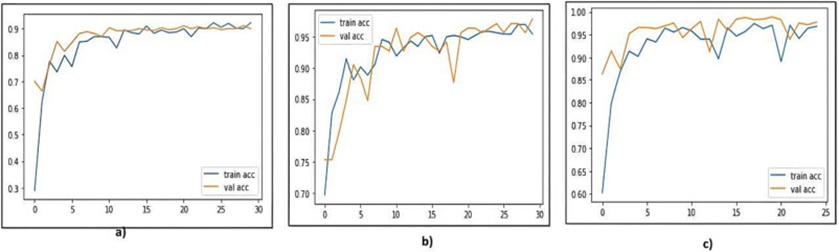
Figure 12. Training and validation curve of a) Jasmine plant leaf dataset, b) Cassava dataset, and c) Tomato dataset obtained after the feature selection block.
The body of results firmly establishes that LeafSpotNet reaches its peak when trained on the proprietary Jasmine plant leaf collection, surpassing all comparators. Reinforcing evidence surfaces in Figure 13, which captures LeafSpotNet securing an Area Under the Curve (AUC) score of 0.98 — a value unmatched by any other tested model. Fusing the Jasmine and tomato leaf collections pulls this figure downward somewhat, resulting in an AUC of 0.90, as shown in Figure 14.
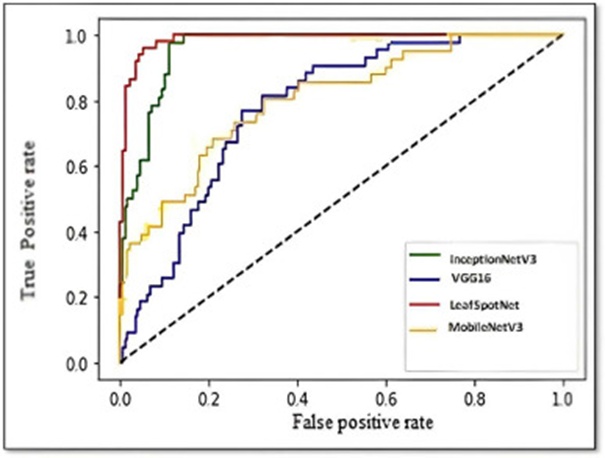
Figure 13. Precision and recall curve of various CNN and tomato dataset classification.
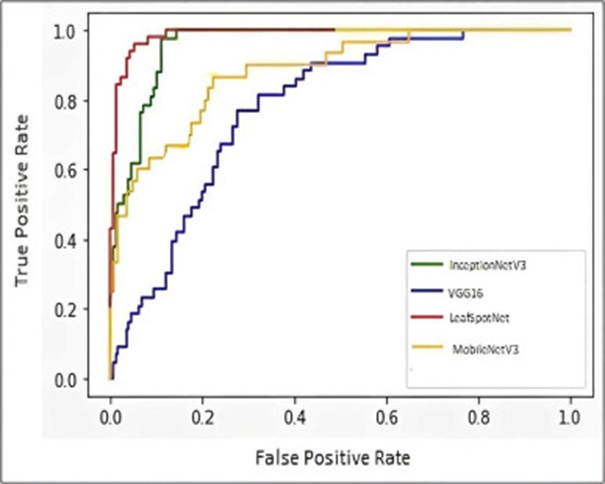
Figure 14. ROC curve of Jasmine plant leaf classifier for Jasmine plant leaf dataset.
Performance stages a recovery; however, upon supplementing the Jasmine-tomato combined pool with cassava leaf samples, this three-way merger restores AUC to 0.95, as shown in Figure 15.
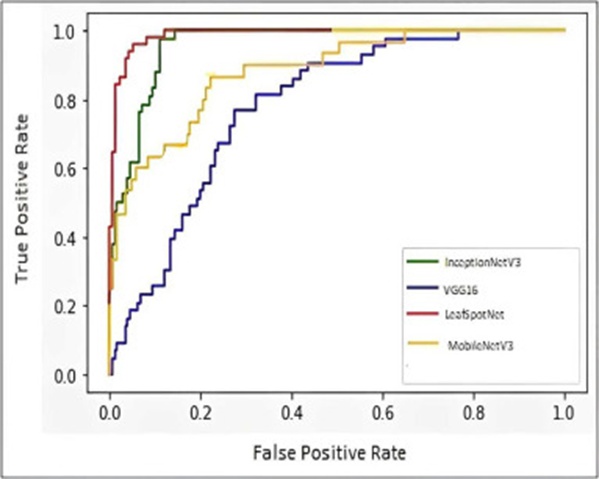
Figure 15. ROC curve of Jasmine plant leaf, cassava, and tomato leaf classification.
Figure 16 catalogues the various training recipes tested and their associated outcomes. The top-performing configuration was the full tripartite aggregation — Jasmine, Tomato, and Cassava merged into a single training pool — which achieved 95% accuracy. Two-way mixtures proved markedly less effective: Jasmine paired solely with tomato managed only 88%, while Jasmine combined only with cassava languished at 82%. The upshot is unambiguous: pooling data from all three sources yields a clear and decisive benefit.
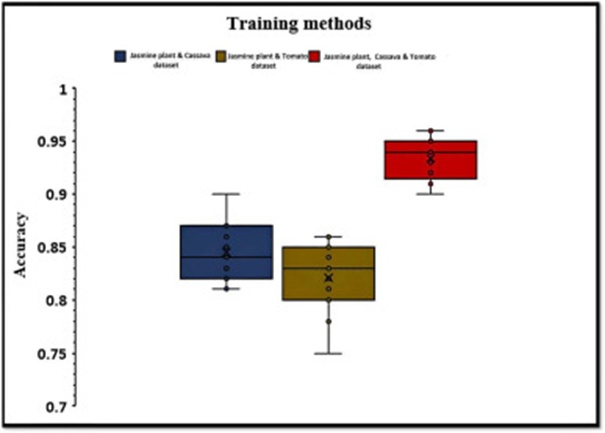
Figure 16. Training methods used in the classification process.
Beyond purely numerical assessments, GRAD-CAM saliency maps were applied to diseased Jasmine leaf exemplars. The resulting heatmaps, shown in Figure 17, reveal the specific tissue zones the classifier assigns the greatest weight to in its predictions.
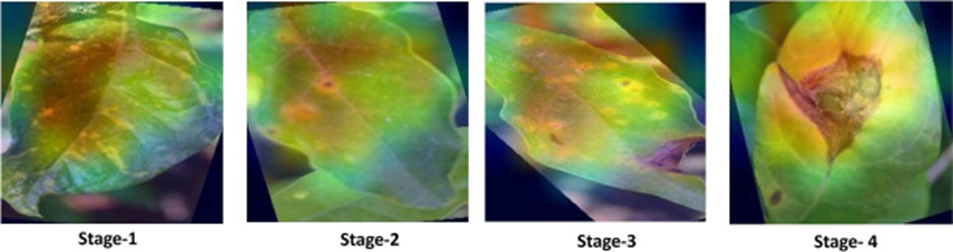
Figure 17. Jasmine plant leaf visualization using the GRAD-CAM tool.
Placed alongside earlier contributions — including models originally conceived for wholly different datasets — the technique introduced here demonstrates a clear performance advantage for the jasmine leaf disease diagnostic task. The solutions described in [21] and in [22] demonstrated competence in the contexts for which they were built, but repurposing them for our jasmine leaf imagery brought certain weaknesses to light. Consider the model from [21]. Though it achieved strong precision and accuracy metrics on cassava leaf disease imagery, it proved brittle when image fidelity decreased, exhibiting inconsistent behaviour on degraded captures. The pipeline from [22], prized for its stability across heterogeneous conditions, nonetheless laboured under the burden of a comparatively heavy model footprint. Set against these reference points, our methodology distinguishes itself in jasmine leaf disease detection — registering precision of 0.96, recall of 0.95, an F1 score of 0.97, and aggregate accuracy of 0.96. Practical considerations further favour our design: short inference latency, coupled with a compact parameter count, makes the system well-suited for embedding into real-world agricultural workflows. The exhaustive comparative analysis of our jasmine leaf benchmark, presented in Table 6, corroborates the methodology’s potency and wide-ranging utility, cementing its standing as a dependable instrument for precise, computationally lean jasmine leaf disease screening across diverse deployment scenarios and environmental conditions.
Table 6. Comparison of the performance metrics of existing methods with the proposed methodology for our Jasmine leaf dataset.
Method | Model size (MB) | Computation time (Sec) | Accuracy | F1 score | Recall | Precision |
20 | 360 | 0.65 | 0.68 | 0.70 | 0.75 | |
12 | 320 | 0.61 | 0.63 | 0.65 | 0.72 | |
30 | 180 | 0.61 | 0.62 | 0.67 | 0.75 | |
16 | 300 | 0.72 | 0.71 | 0.81 | 0.78 | |
12 | 328 | 0.76 | 0.71 | 0.70 | 0.72 | |
3 | 500 | 0.78 | 0.81 | 0.84 | 0.81 | |
4 | 620 | 0.85 | 0.82 | 0.81 | 0.79 | |
14 | 430 | 0.81 | 0.78 | 0.80 | 0.83 | |
17 | 120 | 0.75 | 0.78 | 0.73 | 0.81 | |
12 | 320 | 0.85 | 0.84 | 0.81 | 0.88 | |
105 | 110 | 0.93 | 0.91 | 0.91 | 0.89 | |
37 | 180 | 0.81 | 0.82 | 0.81 | 0.85 | |
33 | 180 | 0.83 | 0.85 | 0.88 | 0.81 | |
Proposed methodology | 10 | 30 | 0.96 | 0.97 | 0.95 | 0.96 |
The ablation analysis summarized in Table 7 systematically isolates each component’s contribution to overall classification performance. Every row in the table corresponds to a distinct architectural or procedural variant, spanning bare-bones baselines, the presence or absence of synthetic data generation, the engagement of swarm-based optimization, and structural alterations made to the MobileNetV3 backbone. What stands out most clearly is the row combining all three elements — synthetic data generation, swarm optimization, and the tailored MobileNetV3 design — which registers precision of 0.97, recall of 0.96, an F1 score of 0.97, and overall accuracy of 0.98.
Table 7. Ablation study.
Condition | Accuracy | F1 score | Recall | Precision |
Baseline (No Augmentation, No Swarm, Original MobileNetV3) | 0.82 | 0.80 | 0.82 | 0.81 |
With Data Augmentation | 0.79 | 0.76 | 0.76 | 0. 78 |
With Swarm Optimization | 0.89 | 0.87 | 0.85 | 0.85 |
Modified MobileNetV3 | 0.89 | 0.86 | 0.88 | 0.87 |
With Data Augmentation and Swarm Optimization | 0.96 | 0.91 | 0.90 | 0.91 |
With Data Augmentation and Modified MobileNetV3 | 0.91 | 0.93 | 0.94 | 0.93 |
With Data Augmentation and Modified MobileNetV3 | 0.94 | 0.96 | 0.95 | 0.94 |
With Swarm Optimization and Modified MobileNetV3 | 0.95 | 0.95 | 0.95 | 0.93 |
With Data Augmentation, Swarm Optimization, and Modified MobileNetV3 | 0.98 | 0.97 | 0.96 | 0.97 |
A side-by-side visual comparison of classifier accuracy before and after swarm optimization is shown in Figure 8. The figure reveals pronounced instability in the training accuracy trace when swarm optimization is absent. Contrast this with Figure 12, where the training accuracy follows a smooth, well-behaved curve, and the validation accuracy tracks it closely—a hallmark of successfully suppressed overfitting. This transformation emerges specifically from the joint deployment of synthetic data generation, swarm optimization, and the modified MobileNetV3. Taken as a whole, these findings demonstrate the potency of the integrated pipeline in elevating classification capability.
Table 8 provides a granular breakdown of classification accuracy across a battery of testing conditions, each of which received a corresponding visual illustration in Figure 5. The test suite encompasses captures from two distinct smartphone devices (Smartphone-1 and Smartphone-2), two separate camera units (Camera-1 and Camera-2), deliberately steep shooting perspectives, heterogeneous illumination settings, and assorted intensities of grain noise. Figure 5 provides a pictorial overview of the experimental arrangement, clearly illustrating the range of variation under which the model was evaluated. Every test scenario has its own unique capture setting, enabling a thorough gauge of how the model fares under conditions that mimic real deployment environments. The broad testing campaign reveals the model’s noteworthy stability across this spectrum of challenges, routinely delivering high accuracy.
Table 8. Comparison of data augmentation techniques in the classification process.
Test conditions | Classification accuracy |
Smartphone-1 | 0.95 |
Smartphone-2 | 0.93 |
Camera-1 | 0.98 |
Camera-2 | 0.96 |
ExtremeCameraAngles | 0.93 |
DifferentLightingConditions | 0.94 |
VariousGrainNoiseConditions | 0.96 |
A standout observation concerns Camera-1, for which the model achieves a striking accuracy of 0.98, underscoring that device’s aptitude for both acquisition and subsequent classification. Equally noteworthy is the model’s tenacity under Extreme Camera Angles, where it upholds a respectable 0.93 accuracy. This finding speaks directly to the architecture’s capacity to cope with demanding capture geometries, reflecting genuine adaptability and the ability to generalize beyond standard frontal views. Critically, the evaluation drew on a pool of 500 test images, lending statistical weight to the model’s assessment under realistic conditions. The resilience and consistency thus demonstrated affirm the model’s readiness for practical, unpredictable deployment contexts, highlighting its high accuracy and its ability to handle a diverse range of testing challenges.
Layer-wise visualizations for the proposed LeafSpotNet, VGG16, InceptionNetV3, and MobileNetV3 appear in Figures 18-21, respectively. Figure 18 additionally shows feature maps generated at different depths of the LeafSpotNet pipeline when processing the Jasmine plant leaf dataset. A notable property of the LeafSpotNet feature maps is their sharper definition and more uniform spatial distribution — a consequence of the supplementary bespoke layers woven into the design — setting them apart from the corresponding maps produced by the unmodified MobileNetV3 architecture.
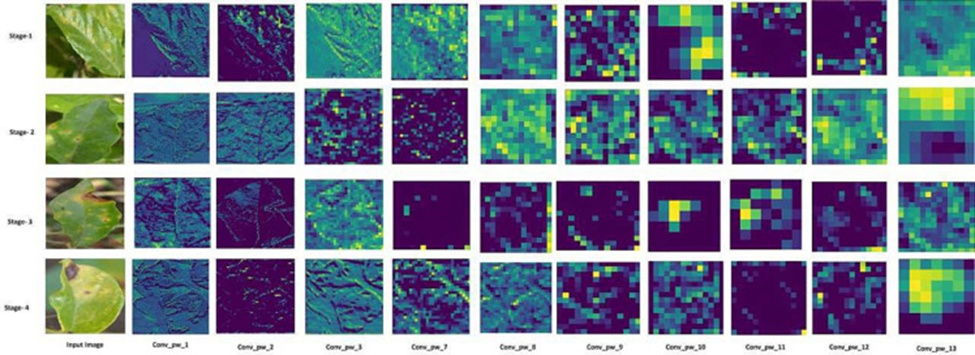
Figure 18. Layer visualization of LeafspotNet classifier.
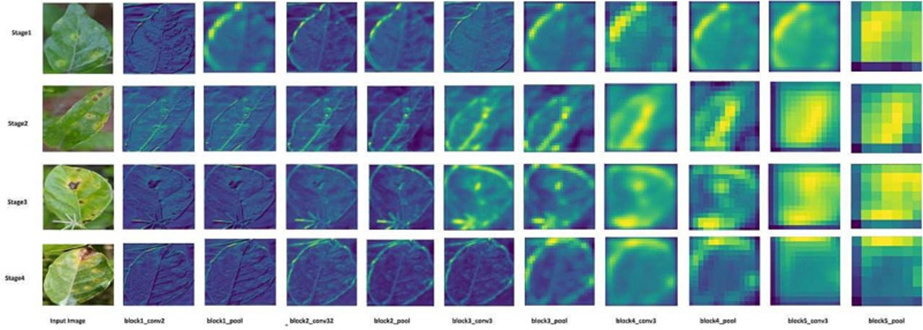
Figure 19. Layer visualization of the VGG16 classifier.
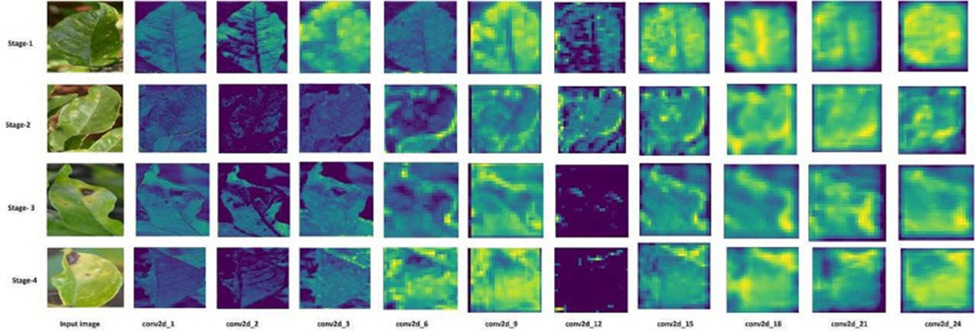
Figure 20. Layer visualization of the InceptionNetV3 classifier.
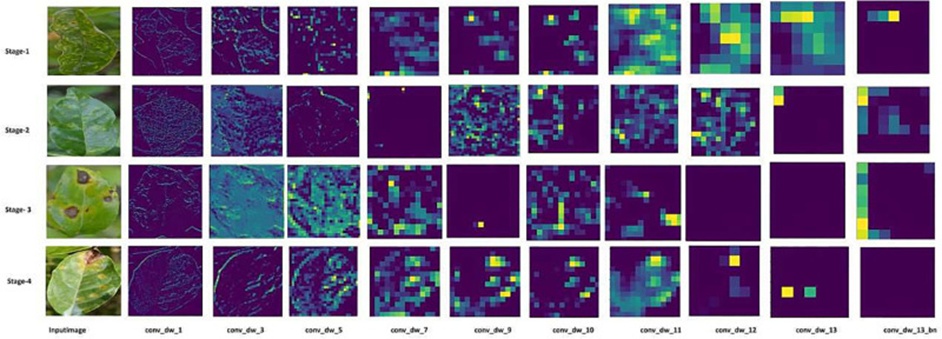
Figure 21. Layer visualization of the MobileNetV3 classifier.
To summarise, this investigation aimed to engineer a resilient classifier capable of precisely distinguishing among the successive phases of leaf blight disease affecting Jasmine plants. Embedding a lightweight architecture and coupling it with particle swarm optimization for feature curation sharply increased classification accuracy—from a baseline of 78% to an exceptional 97%. Ablation experiments proved indispensable to our assessment framework, furnishing clarity on how the model behaves under alternative configurations. Subjecting the classifier to diverse camera viewpoints confirmed its sturdiness. These outcomes attest to the model’s flexibility and dependability across heterogeneous settings, properties essential for transitioning from the laboratory to the field. The LeafSpotNet classifier, trained on a 10,000-image training corpus expanded via CGAN-based synthetic generation, delivered outstanding performance, as evidenced by the impressive accuracy achieved on the private Jasmine plant leaf evaluation set. The model’s capacity to generalise was further borne out by the consistency of its accuracy across the Jasmine, Cassava, and Tomato leaf datasets. Head-to-head benchmarking against existing image generation and classification pipelines highlighted the edge our CGAN-driven approach holds. With inference times of 30 s and a model footprint of merely 10 MB, the system qualifies as a computationally economical option suitable for time-sensitive, on-site applications. The strong potential to embed this solution within mobile platforms holds considerable promise for farming practitioners, opening the door to faster, more precise plant health diagnostics and, in turn, empowering proactive, well-targeted crop management interventions. In brief, the ablation study, stress testing, and cross-condition evaluation collectively substantiate the effectiveness, generalisability, and field readiness of our LeafSpotNet classifier, positioning it as a meaningful instrument for assisting growers with rapid, accurate plant health screening. To close, opting for a MobileNet-derived LeafSpotNet design creates pathways toward seamless assimilation into live agricultural environments. Capitalising on the computational economy inherent to MobileNet, the continued refinement of the model for dynamic field conditions and handheld deployment is a compelling avenue for future work. Sustained engagement with domain specialists in agronomy will ensure that development remains grounded in practical requirements, offering a genuine opportunity to reshape how plant disease surveillance supports enhanced crop husbandry.
None
None
No research grants from private or public funding agencies support this work. Open-access publication funding will be provided by the Manipal Academy of Higher Education, Manipal.
None
Open Access The author(s) retain copyright. This article is licensed under the Creative Commons Attribution-NonCommercial-ShareAlike 4.0 International License. It may be shared and adapted for non-commercial purposes with appropriate attribution, an indication of changes, and distribution of adaptations under the same license. Third-party material may be subject to separate terms identified in its credit line. View the license at https://creativecommons.org/licenses/by-nc-sa/4.0/.
 Agro Intelligence Research Press