Precise tracking and forecasting of dissolved oxygen (DO) concentrations in aquaculture environments are essential for sustaining ideal water quality and safeguarding fish well-being. This research introduces an improved Long Short-Term Memory (LSTM)-based framework for DO forecasting that leverages historical records of DO concentrations, water temperature, and other environmental variables. In contrast to conventional techniques that rely on static assumptions, the proposed framework dynamically adapts to changing environmental conditions, delivering immediate, high-accuracy predictions. Experimental results show that the improved LSTM framework achieves a forecasting precision of 92.28%, surpassing current models, including IFP (81.97%), DOE (63.81%), and DOP (86.79%). The framework's exceptional precision and flexibility make it a reliable tool for aquaculture oversight, helping optimize DO levels and reduce the risk of fish deaths. By incorporating artificial intelligence into aquaculture surveillance, this method enhances system performance and long-term viability.
Immediate surveillance and forecasting of dissolved oxygen (DO) concentrations in aquaculture systems are vital to effective operations [1]. DO is a critical parameter for preserving water quality and ensuring the well-being and development of aquatic species in a contained aquatic setting [2]. Sustaining ideal DO concentrations (5–9 mg/L) is critical, since levels falling below 3 mg/L may induce stress, diminished feed conversion effectiveness, and higher death rates, whereas excessively elevated levels surpassing 12–15 mg/L may result in gas bubble disease, which can be lethal to fish [3-6]. Reduced DO concentrations can lead to reduced feed conversion efficiency, higher mortality, and deteriorated water quality, whereas elevated DO concentrations can cause stress and potentially lead to fish death. Surveillance of DO concentrations in aquaculture systems involves continuous measurement of water oxygen saturation [7]. This is generally performed with DO meters, which use electrochemical sensors to measure dissolved oxygen levels in the water. These meters often connect to a central surveillance system, enabling immediate DO-level monitoring. Immediate surveillance of DO concentrations enables aquaculture producers to swiftly detect variations in DO levels and promptly implement corrective actions [8]. This is critical in intensive aquaculture setups, where substantial fish stocks are cultivated within a confined area. In these setups, DO concentrations can shift rapidly due to factors such as water temperature, stocking density, oxygen demand, and water flow velocity.
Immediate surveillance enables producers to adjust these elements appropriately and maintain optimal DO concentrations for the fish [9-11]. The cultivation of aquatic organisms, including fish, crustaceans, and molluscs, in controlled aquatic environments is referred to as aquaculture [12]. Maintaining dissolved oxygen (DO) concentrations within optimal levels is crucial to the success of aquaculture operations. Inadequate levels of DO can induce stress, illness, and, potentially, death in aquatic organisms that rely on it for survival and development. The conventional approach to tracking DO concentrations in aquaculture systems involves hands-on sample collection and analysis, a process that is both time-intensive and labor-intensive [13]. This approach also imposes constraints on precision and immediate monitoring. However, advances in technology have spurred the development of automated DO surveillance systems, which pose challenges [14]. The principal concern with immediate surveillance of DO concentrations is the substantial expense associated with setting up and maintaining these systems. These systems require specialized sensors and equipment, along with regular calibration and maintenance to ensure precise measurements. This can represent a significant financial strain for small-scale aquaculture enterprises. An additional difficulty lies in interpreting the information acquired from these surveillance systems, an intricate task [15]. DO concentrations can be affected by multiple factors, including water temperature, salinity, and the presence of organic matter. Consequently, thorough data interpretation and comprehension of the connections among these elements are essential for reliably forecasting DO concentrations. The dependability and longevity of the surveillance systems can also be problematic. Aquaculture systems are often installed in harsh environments, and the equipment used to track DO concentrations must withstand corrosion and biological fouling [16]. The precision of the measurements may be compromised, leading to unsuitable managerial decisions.
The lack of uniform procedures for DO surveillance in aquaculture further complicates matters. Each aquaculture setup may exhibit distinct traits, such as water movement, depth, and stocking density, which can influence DO concentrations in different ways [17]. There is a need for standardized protocols to track DO concentrations across diverse aquaculture setups. In summary, although immediate surveillance of DO concentrations in aquaculture systems offers multiple benefits, a range of challenges must be addressed [18]. These encompass substantial expenses, data interpretation, equipment reliability, and the need for uniform procedures [19]. Tackling these issues through further research and technological advances is vital to ensure the long-term growth of the aquaculture sector [20]. The primary contribution of this research encompasses the following:
• Creation of immediate surveillance technology: The research aids in the creation of immediate surveillance technology for dissolved oxygen concentrations in aquaculture setups. This technology enables ongoing, precise monitoring of dissolved oxygen concentrations, providing useful data to maintain ideal conditions for aquatic species.
• Enhanced aquaculture oversight: Through forecasting and tracking dissolved oxygen concentrations in aquaculture setups, this investigation assists in enhancing aquaculture oversight methods. It can improve growth rates and survival rates for aquatic species, boosting output and financial returns for aquaculture enterprises.
• Reducing the threat of oxygen shortage: The research aids in the reduction of oxygen shortage incidents in aquaculture setups, which can be harmful to aquatic species. By providing immediate data and forecasts, aquaculture overseers can implement prompt measures to prevent oxygen shortages and ensure a robust environment for their species. It can also reduce the risk of financial setbacks stemming from fish deaths.
Objectives of the Study:
This investigation seeks to:
1. Create an immediate surveillance system for DO concentrations in aquaculture setups.
2. Boost predictive abilities to uphold ideal DO concentrations and avert oxygen shortage.
3. Enhance aquaculture oversight methods by combining immediate data with mechanized decision-making.
Whereas earlier research focused on conventional DO tracking methods, this investigation presents an immediate AI-powered DO surveillance and forecasting system that leverages machine learning (ML) models to enhance aquaculture oversight [1]. In contrast to standard approaches that depend on manual sample collection or unchanging threshold-based surveillance, the suggested method provides:
• Uninterrupted immediate surveillance featuring adaptive learning for fluctuating environmental settings.
• Machine learning-informed predictive analysis to foresee DO variations and deliver advanced warning notifications.
• Mechanized decision-making for proactive measures, lessening reliance on human supervision.
• Budget-friendly and expandable deployment, rendering immediate DO surveillance attainable for both modest and extensive aquaculture enterprises alike.
This pioneering method markedly enhances prediction accuracy, operational effectiveness, and economic viability, ensuring sustainable, evidence-based oversight of aquaculture.
The subsequent chapters constitute the remainder of the investigation. The investigation's recent publications are addressed in Chapter 2. Chapter 4 outlines the comparative evaluation, whereas Chapter 3 details the suggested model. Finally, chapter 5 delivers the results, and chapter 6 sketches the investigation's prospective paths and concluding remarks.
An intelligent aquaculture farm management architecture that merges IoT (Internet of Things) and AI (Artificial Intelligence) to raise production levels, long-term viability, and operational efficiency has been explored by Chiu et al. [21]. By deploying sensors, performing analytical data processing, and using AI-based surrogate modeling, it strengthens producer decision-making by tracking, projecting, and refining farm conditions. Yang et al. [22] have examined the critical importance of forecasting and regulating water parameters in recirculating aquaculture systems (RAS) to maintain a thriving environment for aquatic life. By combining data-driven and process-driven modeling approaches, hybrid neural networks deliver precise predictions and control over water quality variables. Such integration can streamline procedures and elevate the comprehensive output and sustainability of RAS. The DE-GWO-SVR framework, which integrates Differential Evolution (DE) and Grey Wolf Optimisation (GWO) with Support Vector Regression (SVR) to reliably predict dissolved oxygen content in perch aquaculture settings, has been presented by Bao et al. [23]. This composite model accounts for diverse influences on oxygen saturation and utilizes optimization strategies to strengthen predictive accuracy. Palconit et al. [24] have detailed Multi-gene genetic programming. This technique employs multiple genetic units to construct a fuzzy system for observing the water quality index of Oreochromis niloticus in a recirculating aquaculture environment. The methodology leverages advanced evolutionary computation to heighten monitoring precision and effectiveness, fostering optimal fish-rearing conditions. To acquire and process information from aquaculture sites using networked devices, Kameshwar Rao et al. [25] have outlined an aquaculture observation platform built upon the Internet of Things. By enabling real-time surveillance of surrounding conditions, water characteristics, and stock health, it allows aquaculture enterprises to boost productivity and efficiency. Furthermore, it enables off-site infrastructure management and observation, reducing labor costs and mitigating potential hazards. Capetillo-Contreras et al. [26] have detailed an artificial intelligence-powered aquaculture framework that applies machine learning and computational algorithms to continuously observe and assess numerous variables affecting water conditions in aquaculture operations. It enables swift, accurate modifications to refine water quality, thereby creating superior habitats for aquatic species and elevating productivity. Arabelli et al. [27] have outlined how water quality observations and regulatory mechanisms are fundamental for protecting these systems. These setups involve scheduled assessments of water metrics, such as thermal conditions, pH balance, and dissolved oxygen saturation, alongside the implementation of corrective actions, such as filtration and oxygenation, to uphold or enhance water standards. Such measures help ward off stress, outbreaks, and fatalities among aquatic populations, fostering a more robust and enduring aquaculture enterprise. Chen et al. [28] have presented the intelligent nutrition strategy employed in recirculating aquaculture operations to maximize shrimp growth. Using sensors and analytical methods, it predicts shrimp growth trajectories in response to water conditions, thermal levels, and dietary patterns. This facilitates accurate, well-timed feeding, promoting growth while minimizing feed loss. Yang et al. [29] have examined the deep learning-directed intelligent, precision aeration method for industrial recirculating aquaculture installations. This state-of-the-art solution harnesses artificial intelligence and data evaluation to fine-tune the aeration cycle within aquaculture facilities. The outcome encompasses elevated water quality standards, improved fish health, and enhanced system efficiency, culminating in higher yields and economic returns for aquaculture plants. Arepalli et al. [30] have detailed a structure employing IoT technology along with a dilated spatial-temporal convolutional neural network (DSCNN) for observing water conditions in aqua-ponds. The DSCNN framework processes spatial and temporal data streams captured by IoT sensors, furnishing reliable, instantaneous appraisals of water quality attributes. This advances the governance of aqua-ponds, ensuring healthier aquatic ecosystems and heightened output. Rozario et al. [31] have explored the estimation of dissolved oxygen levels in shrimp ponds, an essential task for maintaining a salubrious environment conducive to shrimp cultivation. The Dolphin Glow Worm Optimization-based Radial Basis Function Neural Network is a robust tool that leverages algorithms mimicking dolphin and glow-worm behaviors to produce accurate projections of dissolved oxygen concentrations in shrimp ponds. This framework helps shrimp growers implement knowledge-based actions to maintain optimal oxygen levels in their operations. Ramesh et al. [32] have highlighted the importance of improving aeration performance in brackish-water aquaculture to maintain a healthy habitat for fish and other aquatic fauna. This encompasses the appropriate arrangement and sizing of oxygenation devices, as well as consistent monitoring and calibration of dissolved oxygen parameters. Wu et al. [33] have detailed the composite XGBoost-ISSA-LSTM framework, which fuses three advanced forecasting architectures to reliably project dissolved oxygen concentrations in ponds over both short- and long-term time horizons. The architecture capitalizes on the unique advantages of each constituent model to generate a holistic, high-accuracy forecast, supporting superior pond management and the preservation of ideal oxygen environments for aquatic organisms. The fuzzy-logic-based adaptive aquaculture water observation system is a technological solution that uses real-time limnological variables to monitor and regulate aquatic conditions at farming sites. Bautista et al. [34] have examined this system. To optimize conditions for fish and other aquatic creatures, it deploys a fuzzy-logic control mechanism to dynamically regulate water-quality variables, including thermal state, pH, dissolved oxygen, and nutrient load. A resilient, health-supporting atmosphere for aquaculture output is thereby secured. The recommended approach, coupling advanced support vector machines with a hybrid metaheuristic optimization method to model multistep-ahead dissolved oxygen content estimation, has been proposed by Adnan et al. [35]. By fusing optimization and machine learning paradigms, this strategy aims to improve estimation reliability. Artificial neural networks or regression-based analysis can be employed to build predictive representations of dissolved oxygen in urban lakes, as described by Selim et al. [36]. Applying statistical frameworks, regression analysis probes variable interconnections and extrapolates future readings. Artificial neural networks are computational structures inspired by the architecture of the human brain and capable of generating predictions. Both techniques can accurately determine dissolved oxygen concentrations in an urban lake ecosystem, thereby supporting conservation initiatives and water resource management. Ubina et al. [37] have contributed to the literature on digital twin-enabled intelligent fish farming. This pioneering methodology constructs a virtual replica of a fish cultivation site using artificial intelligence and the Internet of Things. Insight-informed strategic choices aimed at maximizing yields and protecting fish welfare become feasible via continuous, real-time observation and scrutiny of farm activities. This methodology holds the promise of increased production, reduced costs, and enduring sustainability in the fish farming domain. Shreesha et al. [38] have explored Pattern recognition and forecasting via deep learning architectures. This practice entails deploying advanced algorithms and neural configurations to dissect datasets and uncover behavioral regularities of fish within aquaculture contexts. It paves the way for the development of intelligent decision-assistance platforms, equipping fish cultivators to make evidence-based choices that refine their operational practices. Nagaraju et al. [39] have examined The Estimation of Inland Aquaculture Ammonia Leveraging Hybrid Intelligent Soft Computing. This approach combines artificial intelligence tools with soft computing techniques to anticipate and moderate ammonia levels in inland aquaculture systems. It draws on a range of algorithms and modeling structures to project and manage ammonia loads, thereby strengthening the sustainability and productive capacity of aquaculture undertakings. Forecasting stream water metrics for freshwater lobsters through IoT-based machine learning comparative frameworks has been examined by Bakhit et al. [40]. This setup projects parameters including pH, thermal conditions, and water oxygen saturation using inputs from diverse stream-based sensors. To enhance management effectiveness and conservation practices, the collected information is subsequently processed through machine learning algorithms to estimate habitat suitability for freshwater lobsters. The detailed examination of relevant works is displayed in Table 1.
Table 1. Comprehensive analysis.
Researchers | Publication year | Applied AI method | Optimized variables | Best achieved outcomes | Benefits | Drawbacks |
Chiu et al. [21] | 2022 | Random Forest (RF), Decision Trees (DT) | Resource management, aquaculture efficiency | 80.5 % resource optimization | Enables efficient resource utilization and enhances operational performance through real-time monitoring and intelligent decision-making. | The effectiveness and reliability of AI-driven surrogate models may decline when inaccurate input data are provided. |
Yang et al. [22] | 2023 | Artificial Neural Networks (ANN) | Water Quality Index, Dissolved Oxygen (DO) forecasting | 89.2 % accuracy in DO prediction | Enhances the precision and effectiveness of water quality management systems. | Strong reliance on high-quality and accurate input datasets. |
Bao et al. [23] | 2024 | CNN + LSTM | Fish survival percentage, water pH regulation | 90.1 % fish survival rate, pH 7.2–7.8 | Improves fish survival and water conditions, thereby supporting perch aquaculture productivity and profitability. | Prediction performance can fluctuate depending on environmental complexity and variations influencing dissolved oxygen levels. |
Palconit et al. [24] | 2022 | Support Vector Machine (SVM) | Water quality in Recirculating Aquaculture Systems (RAS) | 85.7 % accuracy for RAS water quality prediction | Provides more comprehensive and accurate monitoring of water quality indices in Oreochromis niloticus recirculating aquaculture systems. | Insufficient understanding of the relationships between fish health and water quality may reduce model performance. |
Kameshwar Rao et al. [25] | 2022 | K-Nearest Neighbors (KNN) + Deep Learning | Data acquisition, sensor calibration | 81.4 % reduction in sensor errors | Accurate and efficient data gathering and analysis contribute to improved productivity and sustainability in aquaculture practices. | Technical failures or connectivity interruptions may compromise data reliability and generate inaccurate outcomes. |
Capetillo-Contreras et al. [26] | 2024 | IoT + Reinforcement Learning (RL) | Adjustment of water quality parameters | 87.5 % optimization of water parameters | Supports continuous monitoring and immediate adjustment of water conditions to maintain optimal aquatic growth and health. | Unable to fully capture unpredictable environmental changes and fluctuations in water quality. |
Arabelli et al. [27] | 2022 | Bayesian Networks | Fish health assessment, water quality monitoring | 79.6 % disease detection accuracy | Assists aquaculture practitioners in early prevention and timely remediation of potential issues. | High installation and maintenance expenses may limit accessibility for small-scale farmers. |
Chen et al. [28] | 2022 | Genetic Algorithms (GA) + ANN | Nutrient management, feed efficiency | 88.4 % decrease in feed wastage | Growth-based nutrient optimization enhances feed efficiency and lowers operational expenses in RAS systems. | Environmental variability and behavioral differences among shrimp make growth prediction challenging. |
Yang et al. [29] | 2024 | Hybrid ANN-LSTM | Resource efficiency, cost reduction | 86.2 % decrease in operational expenses | Promotes efficient resource allocation, cost savings, and greater environmental sustainability. | Limited capability for real-time adaptation to environmental variations. |
Arepalli et al. [30] | 2024 | Decision Trees (DT) + IoT | Real-time water quality monitoring | 89.9 % accuracy in identifying water quality problems | Enables rapid, precise real-time detection of water-quality abnormalities. | Environmental influences may reduce model accuracy. |
Rozario et al. [31] | 2024 | CNN + LSTM | Dissolved oxygen prediction | 90.5 % accuracy in DO prediction | More reliable dissolved oxygen forecasting can improve shrimp growth and pond health management. | Performance is highly dependent on accurate input information, making the system vulnerable to uncertainty and data errors. |
Ramesh et al. [32] | 2024 | Fuzzy Logic + Neural Networks | Aeration performance, dissolved oxygen levels | 85.6 % improvement in aeration efficiency | Improved aeration and DO forecasting can reduce costs, enhance production, and improve water quality in brackish aquaculture systems. | Environmental variability and complex factor interactions in brackish water make accurate prediction difficult. |
Wu et al. [33] | 2024 | Hybrid Model (RF + LSTM) | Short-term and long-term dissolved oxygen prediction | 91.3 % DO prediction accuracy | Combining multiple models improves the precision of short- and long-term dissolved oxygen predictions. | Requires substantial training and optimization for each pond environment. |
Bautista et al. [34] | 2024 | Fuzzy Logic | Instantaneous water quality control | 86.8 % improvement in water quality | Real-time adjustment of water parameters supports optimal conditions for the growth and health of aquaculture species. | High variability in limnological parameters may reduce the ability to accurately predict long-term changes in water quality. |
Adnan et al. [35] | 2022 | Hybrid Metaheuristic Algorithm + SVM | Dissolved oxygen estimation | 89.7 % accuracy in DO prediction | Enhanced SVM combined with hybrid metaheuristic techniques improves the reliability and precision of dissolved oxygen forecasts. | Sudden environmental shifts and external influences may not be fully incorporated into the model. |
Selim et al. [36] | 2023 | ANN + Regression Analysis | Dissolved oxygen level estimation | 87.9 % reduction in prediction error | Integrating regression techniques with ANN improves prediction accuracy and minimizes dissolved oxygen estimation errors in lakes. | Excessively complex models may compromise interpretability and generalizability, even when accuracy is higher. |
Ubina et al. [37] | 2023 | IoT + Deep Learning | Optimization of fish farming conditions | 80.3 % increase in fish production | Facilitates real-time monitoring and adjustment of farming parameters, reduces resource consumption, and improves sustainability and productivity. | Dynamic fish behavior and changing environmental conditions can hinder the reliable real-time processing of data. |
Shreesha et al. [38] | 2023 | Recurrent Neural Networks (RNN) | Fish behavior monitoring | 88.5 % anomaly detection accuracy | Improves the detection of abnormal fish activities, enabling timely intervention and better fish health management. | Effectiveness is constrained by dataset availability and reduced prediction reliability under unpredictable environmental conditions. |
Nagaraju et al. [39] | 2023 | Deep Reinforcement Learning (DRL) | Ammonia concentration prediction | 90.7 % accuracy in ammonia detection | Accurate ammonia forecasting contributes to improved sustainability and profitability in inland aquaculture operations. | Environmental changes and complex system interactions may affect the consistency and reliability of predictions. |
Bakhit et al. [40] | 2024 | IoT + Machine Learning | Freshwater lobster production enhancement | 87.2 % improvement in production efficiency | Integrating IoT with machine learning strengthens predictive performance for sustainable freshwater lobster production. | Sensor-derived data reliability may be affected by environmental conditions, leading to inaccurate forecasts. |
• Insufficient precision in sensor calibration: Dependable tracking and forecasting of dissolved oxygen concentrations depend on meticulously accurate, properly calibrated sensing instruments. Even minor calibration discrepancies can yield erroneous measurements and flawed oxygen-level projections, potentially compromising the well-being and development of cultured aquatic stocks.
• Scarcity of instantaneous data streams: Live surveillance of dissolved oxygen concentrations requires uninterrupted collection and processing of data from sensors distributed across various points within the aquaculture setup. Nevertheless, the limited availability of real-time data may prevent aquaculture managers from implementing prompt, precise interventions to address variations in oxygen levels.
• Cross-parameter interference effects: Additional water characteristics, such as thermal conditions, acidity, and salt content, can distort the accuracy of dissolved oxygen readings. These variables may disrupt sensor outputs and generate faulty oxygen level forecasts. Hence, incorporating these influences and crafting computational routines capable of reliably projecting dissolved oxygen levels irrespective of such disturbances is essential.
Engineering real-time observation and forecasting platforms underpinned by artificial intelligence (AI) routines for dissolved oxygen concentrations marks a substantial leap forward in aquatic environment stewardship. This innovation enables uninterrupted, high-fidelity surveillance of dissolved oxygen levels in a designated water body, whether a natural lake, a watercourse, or an engineered aquaculture installation. The AI routines harness intricate, high-level mathematical formulations to interpret signals from sensing apparatuses such as oxygen electrodes and thermal detectors, thereby projecting future oxygen regimes. Such capability facilitates the prompt identification of impending oxygen-shortfall incidents, a factor often decisive for the survival of aquatic species. Moreover, this technological approach helps regulate and counteract factors that threaten oxygen balance, such as contamination or shifting climate patterns. Owing to its capacity to deliver instantaneous, high-confidence forecasts, this advancement holds the potential to substantially elevate aquatic environment stewardship and the safeguarding of aquatic habitats.
The methodological design embeds an all-encompassing structure for examining dissolved oxygen (DO) behavior within aquaculture environments. The schematic in Figure 1 depicts the principal mechanisms regulating DO status, highlighting the interplay between innate and engineered processes that shape oxygen accessibility.
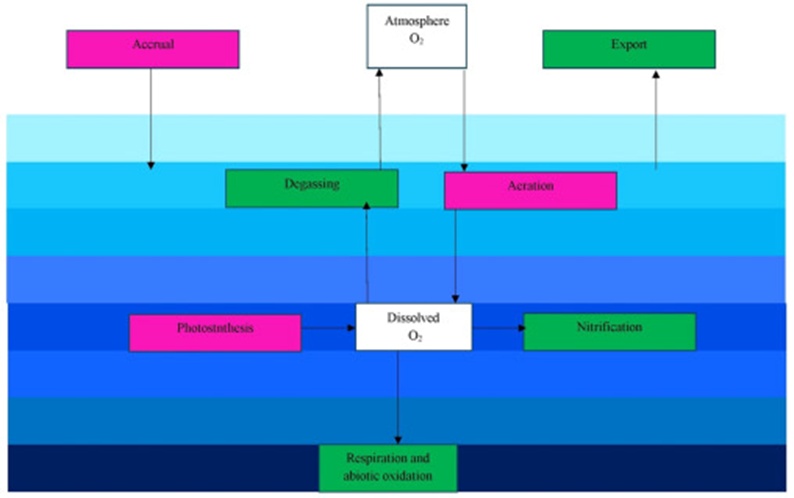
Figure 1. Methodology for prediction of dissolved oxygen levels.
Dissolved oxygen status is predominantly maintained through oxygen-enrichment pathways, including photosynthetic activity and artificial aeration. Photosynthesis, carried out by submerged flora and algae, serves as a biological oxygen source by transforming carbon dioxide and solar radiation into molecular oxygen, which is subsequently released into the surrounding water. Concurrently, aeration, whether driven by natural wind-generated turbulence or mechanical apparatus, enhances oxygen transfer from the gaseous atmosphere into the liquid medium, ensuring ample oxygen for aquatic fauna. Enrichment pathways help maintain a balanced DO level, supporting desirable water quality and ecosystem vitality.
In contrast, numerous mechanisms drive DO reduction, demanding constant vigilance and intervention. Biological respiration and non-living oxidative reactions are notable oxygen-depleting processes that diminish DO reserves through the metabolic functions of aquatic organisms and microbially mediated oxidation. Additionally, nitrification, a microbial transformation sequence that converts ammonia to nitrate, plays a vital role in water quality management while simultaneously serving as a substantial oxygen consumer. Export phenomena, incorporating water discharge and oxygen-absorbing chemical exchanges, add further variability to DO levels. Degassing, triggered whenever DO loads exceed saturation ceilings, expels surplus oxygen back to the atmospheric reservoir, modulating the net oxygen equilibrium.
The dynamic interplay between atmospheric oxygen flux and dissolved oxygen reserves underscores the imperative for real-time surveillance and anticipatory governance. Atmospheric gas transfer replenishes oxygen when DO stocks are depleted, whereas supersaturation provokes degassing. Embedding artificial intelligence (AI)-guided architectures alongside IoT-connected sensory apparatuses permits meticulous tracking of these fluctuating phenomena, enabling mechanized decision processes for ideal aeration and oxygen modulation. By applying predictive computational analysis, this procedural construct ensures ongoing DO refinement, mitigates oxygen-deficit hazards, enhances fish vitality, and advances the broader sustainability of aquaculture practices.
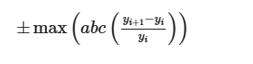
To project DO concentrations with fidelity, a methodical workflow is adopted. Initially, ambient condition readings, including water temperature, pH, salinity, and ammonia load, are collected using sensory grids. The compiled information then undergoes preparatory refinement, during which missing entries are rectified using a data imputation protocol. Within a dataset where Iy signifies the observed reading at temporal point t and Iy-1 indicates the antecedent temporal point, data imputation is executed as:
 (1)
(1)
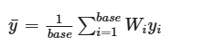
They are as follows: yi indicates the information captured at temporal point t, and yi+1 indicates the information captured at temporal point t -1. Data imputation computational method
 (2)
(2)
Where y represents the information awaiting validation, base indicates the overall count of imputations, I y stands for the previously validated information, and weight is denoted. Let us examine the training collection:
 (3)
(3)
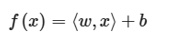
Where Y stands for the quantity of instances composing the dataset, X symbolizes the target variable (observed) linked to Y, and Y indicates the input tier comprising Y attributes. The regression mapping is formulated as follows:
 (4)
(4)
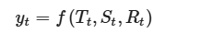 (5)
(5)
Beyond serving as an effective instrument for projecting data magnitudes across tiers, the DO decomposition enables scrutiny of the constituents that form LSTM tier structures. The evaluation of test framework efficacy is iterated to identify the quantity of hidden tiers alongside the empirical equation. The tier count is determined empirically via the subsequent formula:
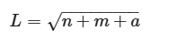 (6)
(6)
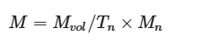 (7)
(7)
The objective expression for the LSTM tiers can be formulated as:
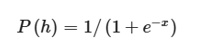 (8)
(8)
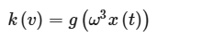 (9)
(9)
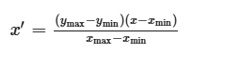
The normalized expression applied appears subsequently:
 (10)
(10)
Here, x denotes the original data element, whereas the quantities man and mix reflect the collection's smallest and largest magnitudes, respectively. Respiration is the mechanism by which organisms break down glucose to liberate energy for their essential biological processes. This sequence requires oxygen and yields carbon dioxide as a byproduct. Abiotic oxidation, conversely, refers to the chemical interaction between oxygen and specific elements or compounds, culminating in the liberation of energy. Both mechanisms fulfill fundamental functions in nutrient circulation and energetic flux across diverse ecological settings. Degassing is the process of expelling dissolved gases from a liquid medium. Within planetary oceans, degassing occurs through molecular diffusion and the respiration of marine lifeforms. It fulfills a vital role in sustaining the equilibrium of atmospheric and oceanic gas compositions. Aeration denotes the introduction of atmospheric air or oxygen into a substance or setting. In water-based habitats, aeration is indispensable for maintaining robust dissolved oxygen levels and fostering the growth of beneficial microbial communities. Terrestrial cultivation employs aeration to enhance soil architecture and stimulate root proliferation. Aeration is also widely used in water purification processes to remove contaminants and improve water quality.
Finfish, crustaceans, and mollusks are among the aquatic livestock that can be cultivated in a regulated enclosure, known as an aquaculture tank. Preserving the prime water characteristics necessary for the microorganisms to prosper is pivotal to the triumph of aquaculture endeavors. In this context, a range of equipment and machinery is critical to ensuring the tank operates according to specifications. The microporous aeration diffuser constitutes the initial element of the aquaculture tank. Infusing oxygen into the aquatic medium is a process called aeration, and it remains fundamental to the existence of aquatic biota. By producing minute air pockets that blend into the water column, the microporous diffuser amplifies the interfacial area accessible for gaseous exchange. The vitality and development of cultured aquatic stocks correlate positively with dissolved oxygen saturation in the water body. The sensing probe represents another indispensable element within the aquaculture tank. It functions as a detector that gauges oxygen saturation, acidity, thermal state, and additional water characteristics. These measurements are relayed to the adaptive PID (Proportional-Integral-Derivative) regulator, which deploys a computational routine to modulate the operational parameters of the aeration setup in response. This ensures a uniform, steady oxygen saturation throughout the tank, preventing detrimental oscillations. The effluent filtration apparatus is another vital component of an aquaculture tank. As the captive aquatic fauna generate excreta, it can rapidly accumulate and foul the water,0 presenting a hazard to the organisms' welfare. The architecture of the proposed model is illustrated in the subsequent Figure 2.
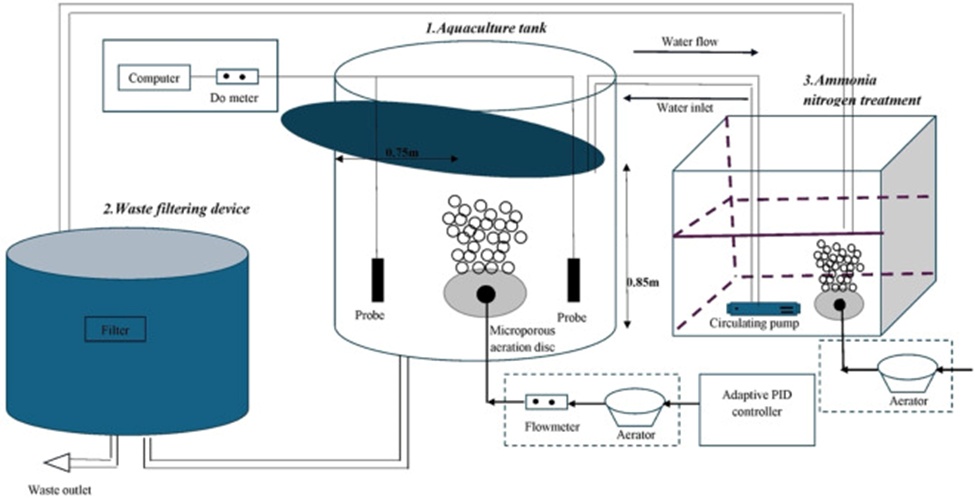
Figure 2. Block diagram of proposed model.
The filtration device operates by capturing solid particulate waste while permitting purified water to flow onward. Various categories of filters may be employed, including physical, biological, and chemical filtration media, tailored to the specific requirements of the aquaculture enterprise. An ammoniacal nitrogen processing unit is critical in the aquaculture tank, particularly when raising finfish. Finfish secrete ammonia as a metabolic waste product, a compound that is exceedingly poisonous to them. The ammoniacal nitrogen processing unit converts ammonia into less toxic substances via biological pathways or oxidative reactions. This helps maintain a secure and salubrious habitat for cultured aquatic stocks. The recirculation pump keeps the water in continuous motion throughout the tank. This proves crucial for multiple considerations:
1. It facilitates the uniform dispersal of oxygen across the entire tank volume, guaranteeing all zones possess adequate concentrations.
2. It aids in conveying waste materials toward the filtration apparatus, enabling effective extraction.
3. It contributes to preserving a stable thermal regime and pH balance within the tank.
A flow measurement device is ordinarily fitted to track the water characteristics and the operational status of the apparatus. It quantifies the water movement rate and can signal the overseer regarding any anomalies or deviations. This uninterrupted surveillance helps prevent potential complications and ensures the seamless operation of the aquaculture tank. In addition to these elements, an oxygenator remains fundamental to maintaining water quality in the tank. It increases the surface area for gas exchange and maintains thorough water mixing, preventing quiescent zones where detrimental microbial colonies might proliferate. The functioning of an aquaculture tank entails an intricate orchestration of diverse apparatus and devices. Each element fulfills a designated function in preserving prime water quality for the development and survival of aquatic organisms. Diligent upkeep and consistent monitoring of these constituents are indispensable to the success of the aquaculture undertaking.
The developed LSTM-based architecture is engineered to capture extended temporal dependencies within sequential datasets. It is built from linked processing elements, each containing a memory unit that handles and retains information across successive time intervals. The unit accepts three input streams:
• The present input is generally a feature representation corresponding to the current temporal step within the sequential data stream.
• The retained memory from the preceding LSTM module, encapsulating the knowledge preserved during the earlier time interval.
• The generated output from the preceding LSTM module arising from the computations executed at the prior time interval.
The LSTM module performs computations using non-linear transformations, vector manipulations, and gating structures. The non-linear elements within an LSTM module encompass the sigmoidal activation layer and the hyperbolic tangent (tanh) layer. These non-linear components introduce nonlinearity into the processing pipeline, enabling the LSTM module to discern intricate dependencies between inputs and outputs. The architecture of the developed LSTM model is depicted in the subsequent Figure 3.
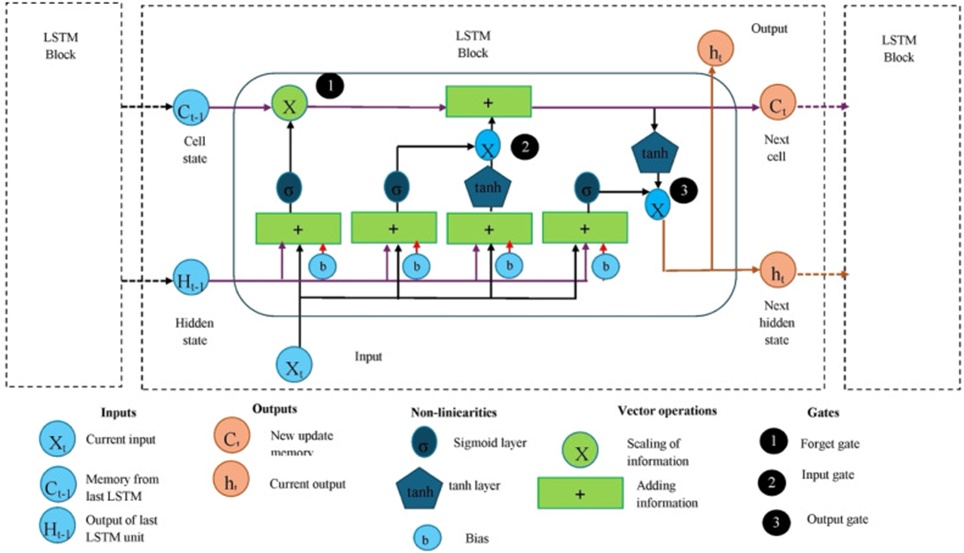
Figure 3. Construction of proposed LSTM unit.
The sigmoidal layer governs information throughput, whereas the tanh layer normalizes data magnitudes. The vector manipulations within the developed module entail scaling operations and the incorporation of data into both the present input and the retained memory from the antecedent time interval. This enables the LSTM module to discriminatively determine which information to preserve and which to discard, contingent on the current input. Furthermore, it deploys gating structures to modulate information flow and determine which data are relevant to the current temporal step. An LSTM module incorporates three categories of gates:
• The forget gate, input gate, and output gate collectively dictate which segments of the prior memory to eliminate, which fresh data to incorporate into the memory, and which stored data to employ for output computation.
In concert, these mechanisms and components coalesce into a functional block that ingests inputs, refreshes memory, and produces the current output. By adopting these techniques, the developed framework becomes a robust apparatus for diverse forecasting tasks, adept at handling prolonged interdependencies within sequential data, contingent on the responsiveness of water quality indicators and the discrepancy between observed and projected water quality variables.
 (11)
(11)
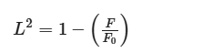 (12)
(12)
The inputs undergo fuzzification via the membership function (μ). A mathematical expression is applied to ascertain the quantity of functional layers.
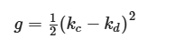 (13)
(13)
Within the expression, e signifies the deviation between the projected and actual output, alongside the network's anticipated output and the network's actual output.
 (14)
(14)
Three neuronal units populate the hidden layer. Empirical testing indicates that increasing the number of layers or neuronal units has no meaningful effect on outcomes; consequently, a streamlined network is adequate.
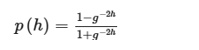 (15)
(15)
It is deployed within the hidden layer's activation function to propagate the aggregated inputs to the output layer.
The cost function, Ep, is defined as the mean squared error between the outputs (On) and the target values. The halting criterion is either the minimal magnitude of Ep or a predefined epoch count (3000).
 (16)
(16)
Signal propagation is restricted to a single trajectory. Connections are assigned a weighting factor that modulates the signal strength they transmit.
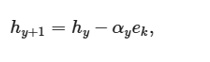 (17)
(17)
Where constitutes a vector array denoting the present weights and bias terms, represents the quantity serving as the input for the succeeding iteration, and corresponds to the present gradient, learning coefficient, and iteration index k.
To accelerate convergence, a momentum term should be included.
 (18)
(18)
Recognition rate (RR), maximum relative error (MRE), and root mean square error (RMSE) served as benchmarks for evaluating the framework's efficacy.
 (19)
(19)
Where designates the forecasted variable and indicates the measured variable.
Missing data gaps can be rectified through straightforward linear interpolation, provided the interval between absent readings is not excessively wide.
 (20)
(20)
Owing to dimensional inconsistencies among water-quality parameters. Standardizing water-quality datasets is necessary to improve the framework's forecasting fidelity.
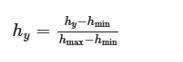 (21)
(21)
Within the data series, where signifies the maximum magnitude and denotes the minimum magnitude.
The raw aquatic environmental datasets are sourced from diverse channels, encompassing sensor networks and hands-on sample collection. For each parameter—including dissolved oxygen concentration, salinity level, thermal condition, and chlorophyll content—this dataset comprises a count of observations. A holistic representation of the current aquatic environment is achieved because each observation corresponds to a distinct spatial coordinate and temporal moment. A segment of the raw dataset employed for framework training is designated as the training corpus. Conventionally, the training corpus encompasses archival records from preceding time intervals. The framework can generate projections by leveraging this training corpus to discern structures and interrelations among disparate variables. The projection span, often called the prediction time horizon, defines the future interval over which the forecasting framework will estimate future magnitudes. This horizon may fluctuate depending on the study's objectives but is conventionally chosen to lie within a feasible interval conducive to reliable forecasting. The moving window represents a strategy for selecting a portion of the training corpus to fit the framework. This technique entails shifting a window across the training corpus, with the window dimension matching the prediction time horizon. As the window advances, the framework is fitted to varying data segments, allowing it to continually update its projections as new data arrives. The moving window strategy is critical because it facilitates framework training across an extensive corpus and equips it to adapt to evolving data structures and trends over time. This proves particularly advantageous within the aquatic environment, a system in perpetual flux. The operational mechanism of the developed framework is illustrated in the subsequent Figure 4.
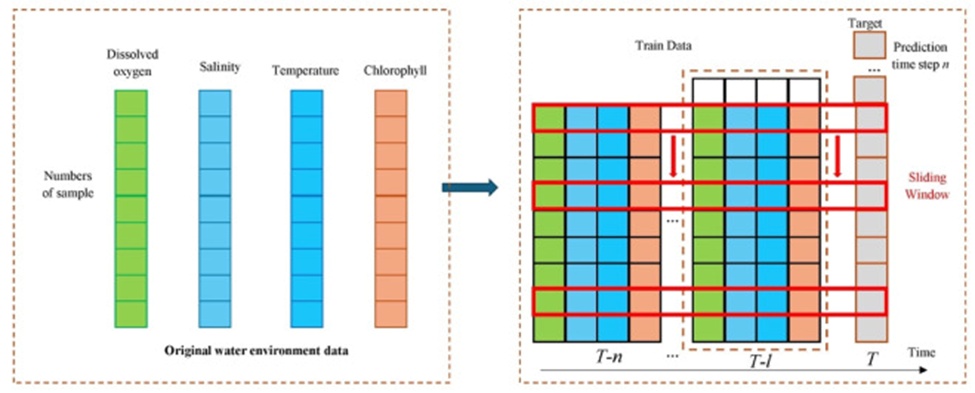
Figure 4. Operating principle.
To clarify the functioning of these elements, consider a scenario in which we aim to forecast dissolved oxygen saturation in a water body over the next 24 hours. Data has been collected over six months, with measurements captured at hourly intervals. We commence by designating a prediction time horizon of 24 hours. Subsequently, a 24-hour moving window is applied to our training corpus, which incorporates data from the preceding six months. The framework is fit to the initial 24-hour data segment, generating a forecast for the next 24-hour period. The moving window is then advanced by 1 hour, and the procedure is repeated. This cycle continues until the entire accessible training corpus has been used for model fitting. As fresh data is gathered and appended to the foundational dataset, the moving window enables the framework to incorporate this new intelligence into its forecasts, ensuring it remains current and delivers precise projections. The functioning of the raw aquatic environmental dataset, the training corpus, the prediction time horizon, and the moving window collectively constitute fundamental components in formulating a precise and adaptive forecasting framework for the perpetually shifting aquatic milieu. These constituents operate in unison to provide an understanding of the current state of the aquatic environment and to assist in formulating future forecasts.
The phrase "input data" refers to the time-series data points supplied to the CNN for processing. Depending on the nature of these chronological data points, they may constitute textual entries, imagery, or numerical quantities. The aggregate count of consecutive data points that constitute a sequence is called the time step duration. This step's magnitude can be adjusted based on the data's characteristics and is crucial for capturing the sequential dependencies inherent in chronological datasets. Various categories of patterns that can be extracted from chronological data are collectively referred to as multiple features. Illustrations of these encompass seasonal fluctuations, recurring cycles, and long-term directional tendencies. More precise forecasts are attainable with the CNN by integrating multiple feature types, which enable it to assimilate and evaluate diverse facets of the data. In CNNs, the kernel dimension is a pivotal parameter. It defines the quantity of input data examined during the computation of the output and establishes the filter's receptive field. A larger kernel dimension allows the network to encode more elaborate information; conversely, a smaller kernel dimension may lead to excessive data simplification. The dimensionality of the input data—designated as data width—can vary depending on the type of chronological data under scrutiny. Unlike a numerical chronological series, which may possess only a single feature, an imagery-based chronological series might incorporate dimensions such as breadth and height. The data width additionally influences the receptive scope of the filters. Figure 5 illustrates the functional operation of the developed paradigm.
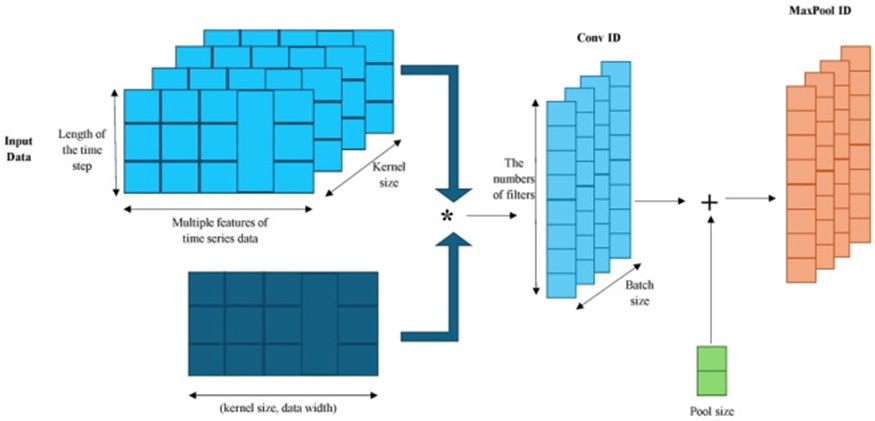
Figure 5. Functional working of the proposed model.
Conv ID (the quantity of filters) establishes the depth of the convolutional strata within the CNN. Every filter functions as a pattern recognizer, pinpointing particular motifs within the data. By adjusting the filter quantity, the CNN can isolate diverse features and improve its forecasting performance. Batch size denotes the count of data instances processed concurrently. By partitioning the dataset into smaller groups, the network can assimilate and fine-tune its parameters more effectively, resulting in faster fitting and convergence. MaxPool ID indicates the maximum pooling stratum within the CNN, which diminishes the data's dimensionality by condensing the outputs from the convolutional strata. This helps curb overfitting and enhance the network's generalization.
The regression mapping g(x) must diverge from the training corpus by a margin smaller than the user-specified insensitive loss threshold ε.
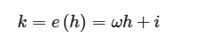 (22)
(22)
Where b signifies the offset and determines the separation between the separating hyperplane and the coordinate origin; y represents the output; and ω corresponds to the weight vector defining the hyperplane's orientation. The separation metric is presented in:
 (23)
(23)
Following this, the gate refines its alignment and placement in response to this metric. The placement refinement computation is presented in:
 (24)
(24)
Once the gates have approximated the positions corresponding to α, β, and δ, they commence execution. The positional adjustment expression is presented in:
 (25)
(25)
 (26)
(26)
Three entities are selected at random from the collective to undergo the mutation procedure, with the mutation expression displayed in:
 (27)
(27)
Eq. 25, employed for evaluating entity fitness, was applied. Subsequently, gates α, β, and δ were identified as the trio exhibiting the highest fitness among the progenitor population.
 (28)
(28)
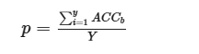
Regarding gating mechanisms, the sigmoidal mapping (Eq. 1) is commonly adopted, as a gate is intended to yield exclusively non-negative outputs and to provide a definitive judgment on whether a particular characteristic should be preserved or eliminated.
 (29)
(29)
 (30)
(30)
The frameworks are assessed using root-mean-square error (RMSE). This formulation computes the RMSE across n observations.
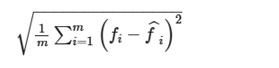 (31)
(31)
To derive meaningful characteristics from chronological datasets and formulate precise forecasts, these methodologies are integrated.
The effectiveness of the developed framework has been benchmarked against established models, encompassing those put forward by Jasmin et al. [2], Chatziantoniou et al. [7], Khan and Byun [8], Kim et al. [13], Feng et al. [14], and Saeed et al. [19]. These frameworks utilize approaches including machine learning, evolutionary optimization, long short-term memory (LSTM) architectures, and artificial neural networks for undertakings such as forecasting, estimation, and signal decomposition. The comparative evaluation draws upon outcomes generated using the dissolved oxygen repository [41] with a Python-based simulation environment serving as the computational instrument.
The forecasted and observed dissolved oxygen concentrations are juxtaposed to determine the accuracy. To accomplish this, the deviation—the discrepancy between the forecasted and observed readings—is quantified. The average deviation is subsequently derived by dividing the cumulative error by the total count of observations. Accuracy is then determined by deducting the average deviation from 1 and scaling the result by 100 to express it as a percentage. This procedure is reiterated across numerous observations to derive an aggregate accuracy metric for the algorithm. Table 2 presents the accuracy estimation.
Table 2. Estimation of accuracy (in %).
No. of Inputs | Proposed | WQP | DOP | TSDM | ODOP | DOE | IFP |
100 | 91.83 | 81.06 | 66.04 | 53.39 | 58.77 | 75.32 | 79.16 |
200 | 91.93 | 75.65 | 72.88 | 47.53 | 57.11 | 69.46 | 77.50 |
300 | 92.00 | 74.16 | 74.17 | 48.67 | 56.66 | 70.60 | 77.05 |
400 | 92.05 | 70.92 | 76.31 | 47.53 | 61.24 | 69.46 | 81.63 |
500 | 92.13 | 67.47 | 80.37 | 45.17 | 60.18 | 67.10 | 80.57 |
600 | 92.21 | 64.28 | 83.58 | 43.53 | 60.88 | 65.46 | 81.27 |
700 | 92.28 | 61.09 | 86.79 | 41.88 | 61.58 | 63.81 | 81.97 |
Figure 6 illustrates the accuracy comparison. Compared to the benchmark, the existing IFP attained 81.97%, DOE registered 63.81%, ODOP secured 61.58%, TSDM recorded 41.88%, DOP reached 86.79%, and WQP achieved 61.09% accuracy. The developed framework achieved 92.28% accuracy. An elevated accuracy score signifies greater dependability and precision of the algorithm in forecasting dissolved oxygen concentrations within aquaculture installations.
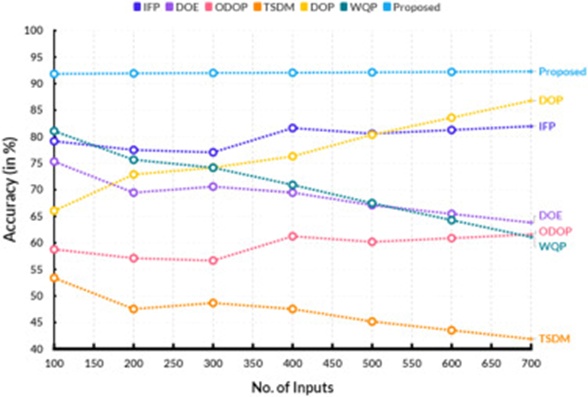
Figure 6. Comparison of accuracy.
Precision quantifies the exactness of a model's predictions. Regarding our developed algorithm for dissolved oxygen concentrations in aquaculture setups, precision is determined by comparing the predicted dissolved oxygen levels with the observed readings. The LSTM framework leverages historical data to discern patterns and formulate forecasts, then evaluates them against the true measurements. Precision is subsequently computed as the proportion of accurate predictions relative to the total number of predictions. Table 3 displays the precision estimation.
Table 3. Estimation of precision (in %).
No. of Inputs | Proposed | WQP | DOP | TSDM | ODOP | DOE | IFP |
100 | 92.09 | 71.64 | 74.74 | 46.65 | 61.74 | 68.58 | 82.13 |
200 | 92.12 | 71.77 | 73.12 | 45.45 | 61.58 | 67.38 | 81.97 |
300 | 92.12 | 70.50 | 71.32 | 43.80 | 60.84 | 65.73 | 81.23 |
400 | 92.14 | 70.16 | 69.64 | 42.45 | 60.49 | 64.38 | 80.88 |
500 | 92.15 | 69.59 | 67.93 | 41.02 | 60.04 | 62.95 | 80.43 |
600 | 92.17 | 69.02 | 66.22 | 39.60 | 59.59 | 61.53 | 79.98 |
700 | 92.18 | 68.45 | 64.51 | 38.17 | 59.14 | 60.10 | 79.53 |
Figure 7 depicts the precision comparison. Compared to the benchmark, the existing IFP attained 79.53%, DOE registered 60.10%, ODOP secured 59.14%, TSDM recorded 38.17%, DOP reached 64.51%, and WQP achieved 68.45% precision. The developed framework attained 92.18% precision. An elevated precision figure suggests that the LSTM framework reliably estimates dissolved oxygen concentrations, making it a reliable tool for monitoring and controlling dissolved oxygen levels in aquaculture installations.
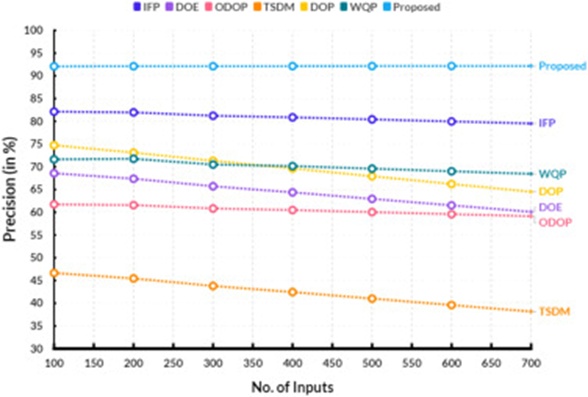
Figure 7. Comparison of precision.
The Critical Success Index (CSI) is derived by comparing projected readings with actual observations against predetermined benchmarks. The CSI accounts for the quantity of successful projections, characterized as those falling within a designated tolerance band around the actual reading, and imposes penalties for false positives and missed events. The algorithm initially feeds historical dissolved oxygen readings into the LSTM framework to learn fundamental patterns and subsequently applies those patterns to project future concentrations. The CSI is calculated as (successful projections - false positives - missed events) / overall projection count, expressed as a percentage. Table 4 presents the critical success index estimation.
Table 4. Estimation of critical success index (in %).
No. of Inputs | Proposed | WQP | DOP | TSDM | ODOP | DOE | IFP |
100 | 89.18 | 75.84 | 66.77 | 40.83 | 60.23 | 62.76 | 80.62 |
200 | 90.22 | 77.71 | 67.36 | 42.33 | 60.56 | 64.26 | 80.95 |
300 | 90.35 | 78.54 | 68.34 | 43.44 | 61.90 | 65.37 | 82.29 |
400 | 91.09 | 80.06 | 69.06 | 44.81 | 62.57 | 66.74 | 82.96 |
500 | 91.67 | 81.41 | 69.84 | 46.11 | 63.40 | 68.04 | 83.79 |
600 | 92.26 | 82.76 | 70.63 | 47.42 | 64.24 | 69.35 | 84.63 |
700 | 92.84 | 84.11 | 71.41 | 48.72 | 65.07 | 70.65 | 85.46 |
The Critical Success Index contrast is shown in Figure 8. In the comparison, the critical success index for the existing IFP registered 85.46%, DOE was 70.65%, ODOP was 65.07%, TSDM was 48.72%, DOP was 71.41%, and WQP reached 84.11%. The critical success index for the developed framework was 92.84%. An algorithm with superior CSI demonstrates greater reliability and precision.
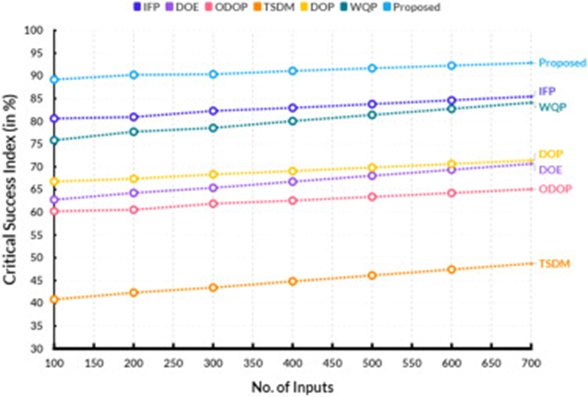
Figure 8. Comparison of critical success index.
The Fowlkes-Mallows index is a statistical measure used to assess the quality of groupings or categorizations. It is derived by evaluating the resemblance between two distinct grouping or categorization results through their respective contingency matrices. In the context of the developed algorithm for projecting dissolved oxygen concentrations in aquaculture setups, the Fowlkes-Mallows index would be calculated by juxtaposing the forecasted dissolved oxygen values with the observed measurements. This process would entail building contingency matrices for both the projected and observed readings and then deriving the associated index. Table 5 displays the accuracy estimation.
Table 5. Estimation of the Fowlkes-Mallows index (in %).
No. of Inputs | Proposed | WQP | DOP | TSDM | ODOP | DOE | IFP |
100 | 91.31 | 79.45 | 69.55 | 43.82 | 63.04 | 65.75 | 83.43 |
200 | 90.88 | 80.37 | 70.69 | 44.83 | 64.09 | 66.76 | 84.48 |
300 | 92.12 | 81.70 | 71.80 | 45.76 | 64.80 | 67.69 | 85.19 |
400 | 92.23 | 82.57 | 72.50 | 46.76 | 66.10 | 68.69 | 86.49 |
500 | 92.63 | 83.69 | 73.62 | 47.73 | 66.98 | 69.66 | 87.37 |
600 | 93.03 | 84.76 | 74.62 | 48.70 | 67.97 | 70.63 | 88.36 |
700 | 93.43 | 85.83 | 75.62 | 49.68 | 68.96 | 71.61 | 89.35 |
Figure 9 illustrates the Fowlkes-Mallows index comparison. At a comparative benchmark, the existing IFP attained 89.35%, DOE registered 71.61%, ODOP secured 68.96%, TSDM recorded 49.68%, DOP reached 75.62%, and WQP achieved 85.83% Fowlkes-Mallows index. The developed framework achieved an Fowlkes-Mallows index of 93.43%. A higher index magnitude indicates a stronger alignment between the forecasted and observed values, indicating the efficacy of the developed algorithm in projecting dissolved oxygen concentrations within aquaculture installations.
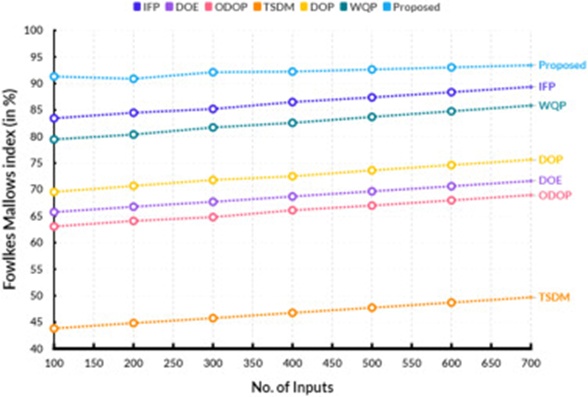
Figure 9. Comparison of the Fowlkes-Mallows index.
A classification framework that simultaneously accounts for the aggregate count of accurate predictions and the equilibrium between accurate and inaccurate predictions is assessed through the Matthews correlation coefficient (MCC). Its derivation involves computing the covariance proportion between the forecasted and actual class designations, which is subsequently measured against the geometric mean of the overall accurate and inaccurate prediction tallies. The Matthews correlation coefficient estimation is shown in Table 6.
Table 6. Estimation of the Matthews correlation coefficient (in %).
No. of inputs | Proposed | WQP | DOP | TSDM | ODOP | DOE | IFP |
100 | 84.99 | 70.47 | 47.06 | 40.77 | 32.98 | 62.70 | 53.37 |
200 | 85.02 | 70.23 | 46.42 | 40.37 | 32.70 | 62.30 | 53.09 |
300 | 85.04 | 70.88 | 47.00 | 40.94 | 33.42 | 62.87 | 53.81 |
400 | 85.07 | 70.94 | 46.77 | 40.86 | 33.47 | 62.79 | 53.86 |
500 | 85.09 | 71.14 | 46.74 | 40.95 | 33.69 | 62.88 | 54.08 |
600 | 85.12 | 71.35 | 46.71 | 41.03 | 33.91 | 62.96 | 54.30 |
700 | 85.14 | 71.55 | 46.68 | 41.12 | 34.13 | 63.05 | 54.52 |
Figure 10 shows the comparison of the Matthews correlation coefficient. At a comparative benchmark, the existing IFP attained 54.52%, DOE registered 63.05%, ODOP secured 34.13%, TSDM recorded 41.12%, DOP reached 46.68%, and WQP achieved 71.55% Matthews correlation coefficient. The developed framework achieved a Matthews correlation coefficient of 85.14%. In the developed algorithm for dissolved oxygen concentrations in aquaculture setups, the MCC is derived by comparing forecasted dissolved oxygen readings with observed levels. This facilitates a more comprehensive appraisal of the algorithm's efficacy, encompassing both the correctness and the spread of the projections.
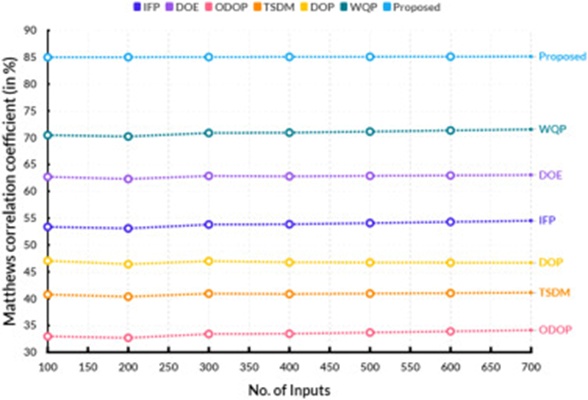
Figure 10. Comparison of the Matthews correlation coefficient.
The developed aquaculture framework successfully incorporates the fundamental elements necessary to preserve prime water conditions; however, several constraints warrant attention. The current configuration positions both DO sensors at the same depth, potentially failing to accurately reflect oxygen stratification across distinct water layers. Adjusting the sensor depths could yield a more holistic representation of dissolved oxygen distribution. Furthermore, the approach for quantifying and regulating water-circulation velocity in high-intensity aquaculture systems requires further clarification, as accurate flow modulation is vital to ensuring uniform oxygen distribution and debris clearance. Although the microporous aeration diffuser enhances gaseous exchange, the absence of a standalone oxygenator in the aquaculture vessel may limit oxygen dispersion, particularly at elevated stocking densities. Incorporating an oxygenator could elevate oxygen saturation and overall systemic functionality.
While the filtration assembly and ammoniacal nitrogen processing module help preserve water purity, their sustained efficacy under fluctuating operational conditions should be examined. A more flexible waste filtration strategy could bolster system reliability and ensure sustainable stewardship of water quality. The developed LSTM-based forecasting architecture efficiently captures extended temporal linkages among water quality variables; however, its computational demands could pose an obstacle to immediate deployment. Refinement strategies might be investigated to accelerate computation velocity without sacrificing precision. Additionally, because the LSTM architecture is trained on archival records, its precision depends on the representativeness of the training corpus. Shifts in ambient conditions, such as thermal oscillations and unexpected pollutants, may compromise forecast reliability. Embedding real-time flexible learning processes could strengthen resilience. The existing illustrations furnish a structured depiction of the system constituents and LSTM architecture, yet enhancements in lucidity and granularity could bolster their capacity to communicate pivotal concepts. By addressing these constraints, the developed methodology can undergo further polishing to enhance its suitability for real-world aquaculture oversight.
Artificial intelligence (AI), alongside machine learning techniques, has shown encouraging results across diverse sectors, including aquaculture. Regarding dissolved oxygen (DO) surveillance and forecasting in aquaculture installations, the developed LSTM-driven AI algorithm has emerged as a powerful tool. The developed algorithm is architected to manage sequential datasets, making it appropriate for DO projection in aquaculture setups where oxygen concentrations shift over time. The algorithm harnesses archival records of DO readings, thermal conditions, and other ambient variables to continuously assimilate and update its forecasts. This implies the algorithm can deliver precise projections instantly, empowering aquaculture operators to take swift measures to maintain ideal DO levels within their installations. The algorithm can adapt to fluctuating ambient conditions, such as thermal variations that affect DO concentrations in aquaculture systems. This establishes it as a more dependable and resilient forecasting tool than conventional techniques, which often rely on static formulations and assumptions. The developed algorithm for DO surveillance and projection in aquaculture setups offers numerous benefits, including instantaneous tracking, flexibility under shifting conditions, and fidelity in DO level forecasting. Its adoption can substantially benefit the aquaculture sector by optimizing DO levels, reducing the risk of fish loss, and enhancing overall output and economic returns from aquaculture installations. Nonetheless, irrespective of its merits, the developed methodology exhibits specific shortcomings. The fidelity of the projections is strongly contingent upon the caliber and volume of the fitting data, posing difficulties for extending the framework across varied aquaculture settings.
Furthermore, the complexity of LSTM configurations may require substantial computational resources, limiting immediate deployment in resource-constrained environments. Ambient elements, such as abrupt, unmodeled perturbations in water quality indicators, may likewise affect forecasting fidelity. Additional investigation is warranted to corroborate the framework's effectiveness across heterogeneous aquaculture settings and to augment its operational efficiency via optimization methodologies.
The authors extend their appreciation to the Deanship of Scientific Research and Libraries at Princess Nourah bint Abdulrahman University for funding this research work through the Research Group project, Grant No. (RG-1445-0018).
The authors declare the following financial interests/personal relationships which may be considered as potential competing interests:
Prabu p reports were provided by Imam Mohammad Ibn Saud Islamic University (IMSIU). Prabu P reports a relationship with Imam Mohammad Ibn Saud Islamic University (IMSIU), including: We confirm that there are no relationships or activities that could be interpreted as potential conflicts of interest related to this research. None of the authors—P.P., A.S., R.A., or S.B.—hold editorial roles or have any affiliations that would influence the impartiality of the manuscript submitted to Environmental Monitoring and Assessment. All authors declare no competing financial or personal interests that could be perceived as influencing the research or its outcomes. If there are other authors, they declare that they have no known competing financial interests or personal relationships that could have appeared to influence the work reported in this paper.
None
None
Open Access The author(s) retain copyright. This article is licensed under the Creative Commons Attribution-NonCommercial-ShareAlike 4.0 International License. It may be shared and adapted for non-commercial purposes with appropriate attribution, an indication of changes, and distribution of adaptations under the same license. Third-party material may be subject to separate terms identified in its credit line. View the license at https://creativecommons.org/licenses/by-nc-sa/4.0/.
 Agro Intelligence Research Press