Achieving food availability, advancing the long-term viability of farming, and propelling economic progress. However, current forecasting frameworks often overlook the specific characteristics of rice yield distributions, which vary across regions, exhibit skewness, and are constrained by fixed lower and upper thresholds, conforming to a four-parameter beta distribution. The consequence is outputs that are less reliable and can potentially misguide decision-making. Furthermore, a majority of techniques fall short in modeling the intricate variable interactions that arise when satellite observations are fused with field survey measurements, an integration widely viewed as essential for boosting forecast fidelity and streamlining cultivation methods. To remedy these deficiencies, the present research proposes a four-parameter beta Generalized Linear Mixed Model (GLMM) and advances it into a four-parameter beta Generalized Mixed Effect Tree (GMET). This four-parameter beta GMET extends the four-parameter beta GLMM architecture by embedding a regression tree mechanism, thereby providing superior flexibility for representing non-linear and interaction-laden dependencies. Deploying this analytical framework on empirical data from Central Kalimantan and Karawang yields significant gains over earlier approaches, as evidenced by markedly lower AIC and RRMSE metrics. Significantly, the investigation finds that time-lagged reflectance values from bands 4 and 8 and the NDVI index captured by Sentinel-2A satellites are the dominant determinants of rice productivity, overshadowing the explanatory contribution of farmer questionnaire responses. This finding underscores the promise of remotely sensed data as a cornerstone for rice yield estimation, offering a more streamlined, less resource-intensive alternative to reliance on farmer-reported data. By further refining satellite-based technologies, upcoming initiatives in yield forecasting can realize superior efficiency and precision, thereby underpinning evidence-based choices in agricultural governance.
Rice is a fundamental dietary cornerstone in Indonesia, playing an indispensable role in securing food for the country's vast citizenry. Anticipating rice yields can accordingly be harnessed to detect looming harvest gaps, facilitating swift countermeasures to circumvent food crises and temper price fluctuations. Forecasting yield levels is also central to structuring agricultural insurance mechanisms. Indonesia is transitioning towards unconventional insurance arrangements, exemplified by the Area Yield Index (AYI), which represents an indemnity product based on productivity benchmarks. Kusumaningrum et al. [1] demonstrated, through simulation-based investigations, that AYI offers an attractive premium structure and can overcome the typical drawbacks plaguing existing multi-peril schemes, including pronounced moral hazard and substantial operational overhead.
The durability of farming systems also rests on yield projections to support well-founded judgments about terrain allocation, crop rotation, and input distribution. Dependable forecasts will orchestrate planting calendars, water stewardship, and nutrient application, culminating in heightened harvests and optimized resource utilization. Finally, rice stands as the predominant agricultural commodity consumed domestically and shipped to international markets by Indonesia. Forecasting its output is likewise imperative for macroeconomic planning, given its profound sway over the livelihoods of millions of cultivators and its significant contribution to the national gross domestic product.
Rice harvest estimates are based on official statistical compilations issued by government agencies. For instance, in Indonesia, yield information is derived from Crop Cutting Experiments (CCE) administered by Statistics Indonesia (SI). The agency conducts CCE throughout the year, employing a 2.5 × 2.5-meter tile-based apparatus on probabilistically selected plots sourced from a regional sampling scheme [2]. The mass of the harvested tile is logged in survey instruments, with subsequent farmer questioning to elicit further details about the respondent's cultivation activities. Yet, signals point to a substantial divergence separating estimates derived solely from CCE and the factual nationwide average productivity. By 2022, this divergence is projected to reach at least 2.8 tons/hectare [3].
In recent years, a growing body of scholarship has documented the deployment of orbital sensing platforms to develop crop yield estimation models. Said et al. [4] proficiently exploited vegetation greenness indices (vegetation index) computed through satellite imagery processing to engineer a framework for approximating rice productivity. Vitasari et al. [5] estimated rice harvest quantities using vegetation indices. The attained predictive correctness reached 73.01%. Nevertheless, fusing these information streams yields convoluted associations linking the outcome variable to its predictors. Survey-derived data tends to maintain linear correlations with productivity measures, whereas satellite-sourced variables frequently exhibit non-linear patterns [6]. This reality intensifies the complexity of pinpointing the most fitting predictive architecture.
To date, a multitude of forecasting systems have utilized Linear regression [6], non-linear regression [6, 7], Double Exponential Smoothing and ARIMA [8], alternative time series formulations [9], image categorizations anchored in Maximum Likelihood [4, 5], and Machine Learning methodologies [10-14] to estimate rice production levels. Confirmation that climatic shifts influence productivity, together with the proliferation of Big Data, has catalyzed continued exploration of prospective predictive models [13]. In this work, we endeavor to improve forecasting reliability by addressing the empirical distribution of rice yields, the spatial heterogeneity of output across disparate locales, and the intricate relationships that arise when blending heterogeneous data types. Thus, we amalgamate CCE measurements, cultivator survey responses, and Sentinel 2A orbital imagery to bolster prediction accuracy.
A majority of forecasting tools disregard the skewed and bounded nature of rice productivity distributions, which are constrained to identifiable floor and ceiling values, a form recognized as the four-parameter beta distribution. If the distributional assumption is misspecified, resultant estimates can be inappropriate and lack practical applicability. In the Indonesian context, it is established that the ceiling for rice productivity approximates 7.8 tons per hectare [15]. Using a multiple linear regression technique could yield projections that exceed this upper bound. Acknowledging this dilemma, Zhou and Huang [16] proposed a four-parameter beta regression model within a Bayesian inference framework. Their methodology was applied to a Florida COVID-19 dataset to examine the relationship between multiple county-level characteristics and cumulative case and fatality counts. The outcomes indicated that the four-parameter beta regression surpasses comparative baseline formulations. Consistent conclusions emerged when the same framework was used to estimate body fat proportions in athletes, drawing on data from the Australian Institute of Sport. Most predictive configurations conventionally assume uniform conditions throughout the study region. In actuality, agricultural terrain circumstances across Indonesia are markedly heterogeneous [17]. Such variation is likewise frequently witnessed internationally. Hence, it becomes necessary to accommodate inter-regional variability effects by including a random component within the predictive formulation.
Accordingly, we propose an innovative predictive model rooted in the four-parameter beta probability law. Initially, we constructed a four-parameter beta Generalized Linear Mixed Model (GLMM). GLMM specifications accommodating a four-parameter beta-distributed response have never been employed in prior research. In our investigation, we further broadened the model by incorporating random-effect terms and applying a transformation mechanism. We converted the four-parameter beta distribution to a standard Beta distribution and leveraged the Beta GLMM structure proposed by Bonat et al. [18]. Following this, we expanded the four-parameter beta GLMM into a Generalized Mixed Effect Tree (GMET) specification by synthesizing GLMM with regression tree algorithms [19]. A regression tree is a foundational, well-established machine learning procedure for estimating a continuous numeric outcome by segmenting the predictor space into discrete, mutually exclusive partitions. Through this methodological fusion, the four-parameter beta GMET emerges as a substantially more pliable predictive instrument compared to the standalone four-parameter beta GLMM. As a consequence, the four-parameter beta GMET is anticipated to better align with the data-generating process and thereby enhance the fidelity of rice productivity forecasting.
An applied investigation was undertaken within Indonesia's Central Kalimantan Province and Karawang Regency to gauge how well the four-parameter beta GLMM and GMET frameworks perform when estimating rice yields. The modeling procedures were validated against three data sources from the 2020 period: Crop Cutting Experiments, questionnaires administered to growers, and Sentinel 2A orbital imagery across both study sites. The selection of Central Kalimantan was motivated by the prevalence of peat-rich soils, which generate considerable heterogeneity in harvest outcomes. In contrast, yields in Karawang are markedly more consistent and higher, regularly exceeding 6 tons per hectare over a single growing season. This track record cements Karawang's standing as a top-tier rice belt within Indonesia, furnishing a sizable share of the nation's dietary staples. Earlier exploratory work has likewise suggested that the observed spread of harvest figures aligns with a four-parameter beta form. Accordingly, both geographic settings provide a suitable testbed, and the validated approach holds promise for expansion into additional territories. The core advancements delivered by this manuscript are itemized as follows:
1. Bolstering rice yield forecasting fidelity by devising an innovative modeling pipeline centered on the four-parameter beta GLMM and four-parameter beta GMET.
2. Putting the freshly constructed four-parameter beta GLMM and four-parameter beta GMET pipeline to work on both grower-reported data and Sentinel 2A remote sensing streams for yield estimation.
3. Measuring the goodness-of-fit and forward-looking predictive power of the four-parameter beta GLMM and four-parameter beta GMET pipeline to isolate the most fitting specification.
4. Interrogating the highest-performing yield prediction variant and offering wide-ranging practical counsel.
The layout of the subsequent text follows this roadmap. The Method block unpacks the fundamentals of the four-parameter beta and standard beta probability distributions, along with the transformations required before model assembly. Following this, the architecture of both the four-parameter beta GLMM and the four-parameter beta GMET is laid out in detail. The nature of the assembled data, the sequence of modeling and prediction tasks, and the benchmark metrics used for evaluation are also covered within the Method block. The Results and Discussion block communicates the empirical evidence alongside a thorough interpretive treatment of the case studies. The closing block, dedicated to conclusions, synthesizes the overarching contributions and charts prospective avenues for continued inquiry.
A four-parameter beta distribution describes a random variable strictly confined inside the limits (a, b), where a marks the floor and b marks the ceiling [16]. Its highly malleable functional form accommodates many distributional silhouettes, a trait that renders it advantageous in numerous applied settings. The density function that defines the four-parameter beta distribution takes the following expression:
 (1)
(1)
The first moment, or mean, of a four-parameter beta variable is specified by μ=a+ (b−a), while the second central moment, or variance, follows:

The Beta distribution, conversely, describes a continuous quantity bounded exclusively on the [0, 1] segment, governed by the density function given below:
 (2)
(2)
In this specification, α is the location-related parameter, and α-β is the scale-related parameter. The first moment is captured by , and the variance by . One can also establish that the mean of a Four-Parameter Beta Distribution connects to the mean of a Beta Distribution through . In a parallel vein, the linkage between their respective variances takes the form .
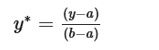
As demonstrated by Zhou and Huang [16], should a variable y originate from a four-parameter beta law, written as y ∼ B(α, β, a, b), the transformation laid out below may be invoked:
 (3)
(3)
The output of this mapping, y∗, will itself be governed by a Beta distribution with shape coefficients α and β. Consequently, when constructing the four-parameter beta GLMM, the conversion encapsulated in Eq. 3 can be brought to bear, shifting the observed outcome y, inherently bounded within (a,b), onto the rescaled outcome y∗ occupying the unit interval (0,1).
Re-expressing a four-parameter beta variable as its standard beta counterpart simplifies analysis. Thanks to this re-mapping, information that natively exhibits a four-parameter beta structure becomes amenable to modeling and forward prediction through conventional GLM or GLMM machinery. Opting for a GLMM formulation is appropriate when response values are clustered within specific groups or spatial zones (i = 1, 2,…, q); conversely, a GLM specification suffices for less hierarchically structured data.
This re-expression strategy brings clear gains: computational burdens are lightened, a standardized scale is imposed, data distributions are symmetrized, and theoretical derivations become less cumbersome. Offsetting these merits, certain drawbacks emerge, most notably the potential for systematic distortion. The root of this bias lies in the greater flexibility of the four-parameter beta law, which can faithfully reflect a much wider range of empirical patterns. To be precise, the four-parameter beta formulation grants skewness and tail weight the freedom to shift independently, whereas the ordinary Beta distribution locks these attributes at predetermined levels. A practical way to assess how consequential this bias might be is to examine the precision of the model's fitted outputs, a topic further discussed in the upcoming Key Performance Indicator subsection.
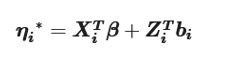
Within the GLMM framework, the response variable y∗ is understood to be a function of multiple predictor variables xi=(x1i,x2i,……,xKi) while simultaneously being shaped by heterogeneity across clusters or spatial units [20], leading to the following specification:
 (4)
(4)
In this expression, XTi and ZTi represent the design structures for the fixed effects and the random effects, respectively. The vector of fixed-effect coefficients associated with the explanatory variables is denoted β, whereas bi captures the random-effect deviations attributable to a specific cluster or region. The customary distributional assumption imposed on the random effects is bi∼ N(0, σ2i), equivalently expressed as [bi |Σ] ∼ N(0, Σ). Among the available linking mechanisms in GLMMs, the logit transformation is frequently adopted, defined as:

Building upon the work of Bonat et al. [16], the newly proposed Four-Parameter Beta GLMM formulation corresponds to model (4) under the condition that y∗∼B(μ,φ), with the joint probability density function taking the form:
 (5)
(5)
The governing parameters of this density comprise the location measure and the dispersion measure, where Γ(·) symbolizes the Gamma function. The location parameter resides strictly within the bounds 0 < μ < 1, the dispersion parameter satisfies φ > 0, with the first moment given by E(y∗) =μ∗ and the variance expressed as V(y∗) = μ∗ (1 − μ∗)/(1 + φ∗).
Estimation of the parameters in model (4), predicated on the assumption y∗∼ B(μ∗,φ∗), proceeds by maximizing the marginal likelihood constructed through integrating the joint density [y∗,b]. The likelihood contribution attributable to the i th cluster or subject is:
 (6)
(6)
Under the premise that clusters or subjects are mutually uncorrelated, the likelihood simplifies to:
 (7)
(7)
Evaluating the expression above requires integrating q distinct times. One viable computational strategy is a sampling-oriented data-cloning algorithm [18].
The GMET architecture was originally proposed by Fontana et al. [19], motivated by the recognition that GLMM formulations do not necessarily suit datasets exhibiting inter-cluster variability, particularly when the relationship between the outcome and the predictors departs from linearity. That earlier formulation was tailored for the Binomial distribution and deployed to forecast student attrition among Politecnico Italia enrollees spanning the years 2010 through 2014. The general structure of the newly advanced Four Beta Parameter GMET is as follows:
 (8)
(8)
Here, i indexes the cluster or area, and ni denotes the count of observations or growers nested within each cluster, such that .
The fixed effects portion of this specification is embodied by f(Xi), which entertains a non-linear association with the outcome variable. Accordingly, its estimate relies on a regression tree. Concurrently, the random effects constituent (bi) is recovered through the Four Beta Parameter GLMM detailed earlier in Eq. 4. Parameter inference for the new Four Beta Parameter GMET approach rests on adaptations of the algorithm originally set forth by Fontana et al. [19].
The analytical strategy adopted in this investigation commences with exploring and assessing the empirical distribution of harvest measurements sourced from 534 CCEs conducted in Central Kalimantan Province and 363 CCEs carried out in Karawang Regency, West Java, throughout 2020 by Statistics Indonesia (SI), as displayed in Figure 1. SI administers these crop-cutting exercises continuously across the calendar year, deploying a 2.5 × 2.5-meter tiling frame on probabilistically selected parcels supplied by the Area Sampling Frames [2]. The harvested grain mass from each tile is entered into a structured questionnaire, after which enumerators interview the plot operators to collect supplementary details regarding their cultivation practices. Despite this effort, a substantial discrepancy persists between CCE-based projections and the realized nationwide average yield. By 2022, this divergence was projected to reach at least 2.8 tons/ha [3]. To remedy this, the present study merges grower questionnaire responses with Sentinel-2A orbital data.
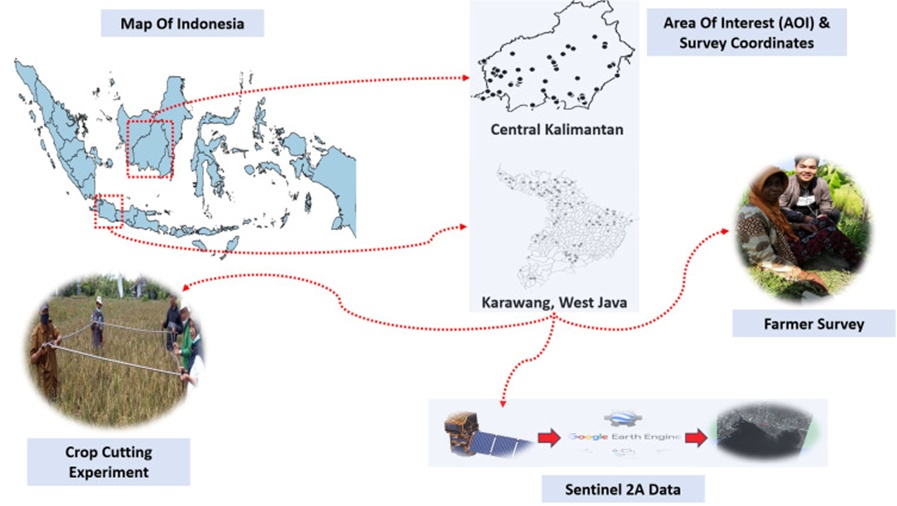
Figure 1. Distribution of survey plots and data used in Central Kalimantan and Karawang.
The complete roster of explanatory variables or predictors utilized in this work is catalogued in Table 1. Drawing from the farmer questionnaires, attributes such as pest incidence, pest control measures, consequences of climatic shifts, and adequacy of water supply serve as covariates in the model. Furthermore, Sentinel 2A satellite-derived indices corresponding to each surveyed coordinate have been incorporated, along with their values lagged over a 12-month window. Among the 13 spectral bands captured by the Sentinel 2A platform, the authors selected bands 4 (the red channel) and 8 (the near-infrared channel), along with a computed Normalized Difference Vegetation Index (NDVI), as model predictors.
Table 1. Predictor variables used in the prediction model.
Variable | Symbol | Measurement unit/Classification | Source of data |
Paddy yield productivity | y | Tons per hectare (Tons/Ha) | CCE (SI) |
Pest infestation in the current year | x1 | 1 = Heavy, 2 = Moderate, 3 = Light, 4 = Unaffected | Farmer Survey (SI) |
Pest infestation in the previous year | x2 | 1 = Heavy, 2 = Moderate, 3 = Light, 4 = Unaffected | Farmer Survey (SI) |
Climate change effects in the current year | x3 | 1 = Affected, 2 = Not Affected | Farmer Survey (SI) |
Climate change effects in the previous year | x4 | 1 = Affected, 2 = Not Affected | Farmer Survey (SI) |
Adequacy of water supply this year | x5 | 1 = Insufficient, 2 = Adequate, 3 = More than Adequate | Farmer Survey (SI) |
Adequacy of water supply last year | x6 | 1 = Insufficient, 2 = Adequate, 3 = More than Adequate | Farmer Survey (SI) |
Pest management method | x7 | 0 = No Action, 1 = Agronomist, 2 = Mechanical, 3 = Biological, 4 = Chemical | Farmer Survey (SI) |
Band 4 | Lag | μm | Sentinel-2A Satellite |
Band 8 | rlag | μm | Sentinel-2A Satellite |
NDVI | nlag | Index | Sentinel-2A Satellite |
The Sentinel 2A platform was selected for this study owing to its favorable spatial granularity, revisit frequency, and spectral breadth. It carries a multi-spectral instrument (MSI) encompassing thirteen spectral channels. These channels span the visible, near-infrared, and shortwave infrared portions of the electromagnetic spectrum. For this analysis, only Band 4, Band 8, and NDVI were retained as covariates. Band 4 aligns with the red segment of the spectrum, covering wavelengths from 630 to 680 nm, whereas Band 8 corresponds to the near-infrared (NIR) region, spanning 780 to 900 nm. NDVI, in turn, constitutes a vegetation metric employed to gauge plant vitality and canopy vigor. It ranks among the most widely adopted indices extracted from satellite imagery spectral bands for crop yield estimation [21]. The computational expression for NDVI is:

Regarding spatial detail, the visible and near-infrared spectral bands deliver 10 m resolution, while the shortwave infrared bands deliver 20 m resolution. Regarding temporal cadence, Sentinel 2A provides a 5-day revisit interval at equatorial latitudes, enabling dense time-series observations of terrestrial dynamics, such as phenological progression and land cover change.
The overarching goal of this study is to forecast rice yields, grounded in the empirical observation that such productivity measures follow a four-parameter beta law. Scholarly efforts to model four-parameter beta-distributed phenomena remain relatively scarce. An overview of the investigative workflow undertaken is provided in Figure 2.
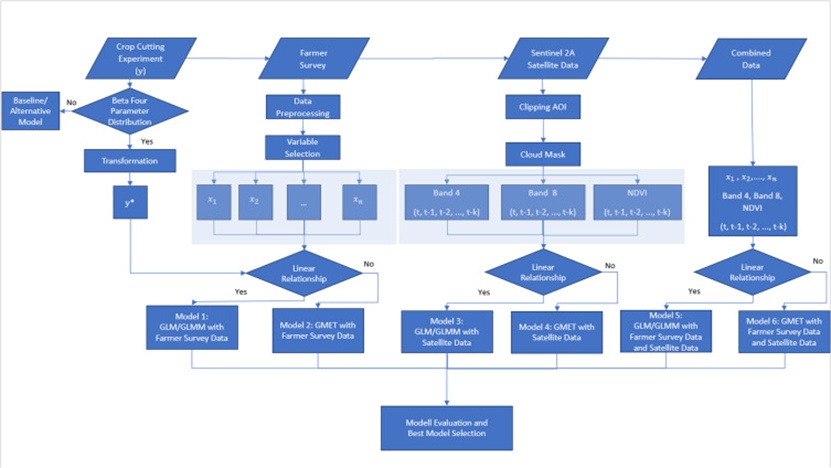
Figure 2. Research process flowchart.
Delving into finer granularity, the procedural steps are enumerated below:
Initial data assembly and curation, encompassing the variables itemized in Table 1.
Across all assembled datasets, an 80% allocation to model training and a 20% allocation to out-of-sample testing were established. Accordingly, the full dataset was partitioned into training and testing subsets.
Perform an exploratory analysis of the data and examine the empirical distribution of rice productivity figures derived from the CCEs.
Should the productivity variable conform to a four-parameter beta distribution, expressed as y ∼ B (α, β, a, b), a transformation of the outcome to a standard beta form is executed via Eq. 3. Consequently, we obtain y∗∼ B (α, β). This re-expression is applied to both the training and testing partitions.
With respect to the farmer questionnaire data, preprocessing operations are undertaken, comprising:
Rectifying inaccuracies present in the survey records.
Identifying and managing anomalous observations.
Conducting exploratory data analysis.
A predictor selection phase was performed, guided by prior literature and insights from data exploration.
For the Satellite Sentinel 2A data, the initial step is to delineate the Area of Interest (AOI) based on the geolocations of the surveyed plots. Subsequently, scripts in Google Earth Engine are configured to perform cloud masking, thereby detecting and excluding cloud-contaminated pixels to yield cleaner, more reliable data.
Formulate the predictive four-parameter beta GLMM and four-parameter beta GMET models based on the training partition. Multiple candidate specifications are constructed, including:
Formulations relying exclusively on predictor variables sourced from Sentinel 2A satellite imagery.
Formulations relying exclusively on predictor variables sourced from farmer questionnaires.
Formulations integrating both Sentinel 2A satellite imagery and farmer questionnaire data.
Additionally, the authors examine specifications, both with and without random effects, for each of the aforementioned categories a–c.
Exploratory random-intercept configurations encompass growers, sub-districts, and districts, as well as hierarchically nested random-effect structures.
For every specification falling under categories a–e, both a full model and a variant subjected to variable selection are evaluated.
Taken together, 21 distinct models are assessed on the training and testing datasets in each geographic setting to identify the most fitting predictive framework for rice productivity. This ensemble comprises 18 four-parameter beta GLM/GLMM variants, augmented by 3 additional four-parameter beta GMET configurations.
Every model constructed in the preceding steps was evaluated using Key Performance Indicators. This approach ensures that we identify not only the most appropriate model specification but also the most precise yield estimates for each monitored rice parcel included in the survey. The sequence and mathematical expressions employed to establish these Key Performance Indicators are outlined below:
1. Quantify and contrast the goodness-of-fit across the eighteen candidate models using the Akaike Information Criteria (AIC), expressed as:

In this formulation, K denotes the number of predictor variables in the model, while L denotes the log-likelihood estimate. Models with lower AIC values are judged to have superior fit.
2. Select the best-fitting specifications, indicated by the minimal AIC values, and deploy them for forecasting rice yields on the held-out testing partition.
3. Gauge predictive precision through the Relative Root Mean Square Error (RRMSE), which is derived from the Root Mean Square Error (RMSE). RMSE captures the standard deviation of the forecast residuals and is specified as:
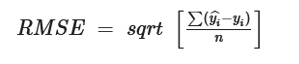
Within this notation, yiˆ signifies the model-predicted figure, yi denotes the observed ground-truth value, and n indicates the overall count of observations or records.
4. The RRMSE is ultimately obtained by dividing the RMSE by the arithmetic mean of the observed values. Lower RRMSE values indicate superior predictive capability among the candidate specifications.
5. The optimal model is subsequently identified based on the joint criteria of the smallest RMSE and RRMSE figures.
Rice yields across Central Kalimantan and Karawang lie within bounded intervals, with floor and ceiling thresholds that exhibit mild seasonal fluctuations. In Central Kalimantan, productivity spans from 0.691 to 7.676 tons per hectare. Marginally narrower, Karawang's productivity extends from 3.186 up to 5.488 tons per hectare. A distributional fit assessment summarized in Table 2 reveals that the four-parameter beta specification surpasses both the normal and Laplace alternatives in both regions, as reflected by its markedly lower AIC. Drawing on the parameter estimates presented in Table 2, the mean rice yield for Central Kalimantan is approximated at 3.031 tons per hectare, with a variance of 1.070 tons per hectare. In Karawang, by contrast, productivity conditions display greater uniformity, evidenced by a modest variance of 0.206. The average output in Karawang also registers at a higher level, approaching nearly 5 tons per hectare. Nonetheless, yield levels in both Central Kalimantan and Karawang remain beneath the national benchmark, which hovers around 5.23 tons per hectare.
Table 2. Distribution fit test and parameter estimates.
AIC of the distribution fit test | |||
Area | Four-parameter beta | Laplace | Normal |
Central Kalimantan | 335.208 | 336.688 | 338.168 |
Karawang | 113.299 | 139.975 | 127.154 |
Parameter estimates | ||||
Empty Cell | Alpha (α) | Beta (β) | a | b |
Central Kalimantan | 3.067 | 6.091 | 0.691 | 7.676 |
Karawang | 3.099 | 1.382 | 3.186 | 5.488 |
Multiple factors are recognized as capable of fostering yield improvements, among them the adoption of suitable soil husbandry practices and fertilizer regimes. Furthermore, several government initiatives support growers in both Central Kalimantan and Karawang in increasing their output. Using the models developed, these influential factors can be pinpointed, enabling the formulation of actionable guidance to raise productivity levels in the two study areas.
Figure 3 illustrates that the yield distribution in both locales exhibits a pronounced leftward skew. Moreover, productivity in each region is confined within specific lower and upper limits. These features collectively reinforce the appropriateness of adopting a four-parameter beta distributional framework.
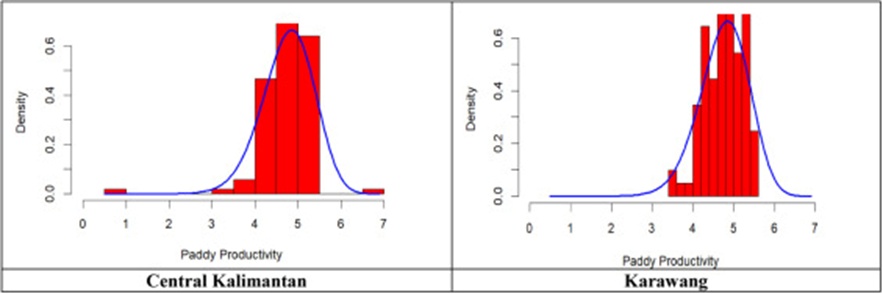
Figure 3. Paddy productivity distribution.
In aggregate, we assessed eighteen GLM and GLMM formulations. A GLM specification omits random effects and uses only fixed effects, making it comparatively parsimonious. In contrast, GLMMs accommodate both random and fixed effects. GLMMs are typically favored when the data embody multiple variance components, such as when observations are nested within distinct spatial units (cross-sectional data) or exhibit clustering. In the present investigation, the impact of differing administrative districts on the predictors was captured through an intercept term bi. Beyond this, we also explored random-effect configurations for individual growers, sub-districts, districts, and hierarchically nested structures [22]. Following an iterative experimentation process, it emerged that random effects at the farmer level, farmers nested within sub-districts, and sub-district-level effects yielded superior fit when constructing a GLMM for productivity forecasting. Consequently, the general form of the optimal model can be expressed as:
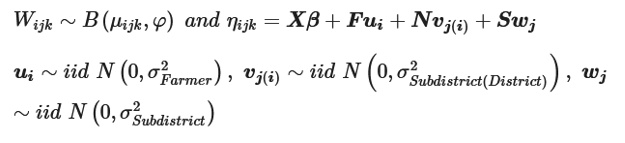
In this representation, Wijk denotes the transformed harvest productivity for farmer i in subdistrict k, which is itself nested in district j. Furthermore, when employing the logit link mechanism. The fixed effect coefficients of the retained variables are captured by β. At the same time, ui, vj(i), and wj denote the random deviations attributable to farmers, farmers nested within subdistricts, and subdistricts, respectively.
It is evident that the four-parameter beta GLMM outperforms the four-parameter beta GLM, as indicated by its lower AIC readings (Figure 4). This pattern holds uniformly across all categories of explanatory variables employed, underscoring that both random and fixed components are essential for credible rice yield prediction. This finding aligns with an earlier systematic literature synthesis by Klompenburg et al. [14], which demonstrated that tailoring models to particular geographic settings enhances the pertinence and fidelity of yield forecasts. In our analyses, the most fitting random-effect structures for both regions include farmers, farmers nested within sub-districts, and sub-districts themselves. Among the eighteen candidate specifications evaluated per area, the top-performing GLMM is the one that fuses both farmer questionnaire and satellite-derived information, registering AIC values of −124.117 (Central Kalimantan) and −228.000 (Karawang). Grounded in this model, the explanatory factors exerting a statistically meaningful influence on yields in Central Kalimantan include Pest Attacks Last Year (x2), How to Handle Pest (x7), Band 4 (Lag 0 and Lag 5), Band 8 (Lag 0), and NDVI (Lag 3, Lag 5). In Karawang, alongside Pest Attacks Last Year (x2) and the present and lagged values of Band 4, Band 8, and NDVI, the Impact of Climate Change Last Year (x4) additionally emerges as a significant determinant of productivity.
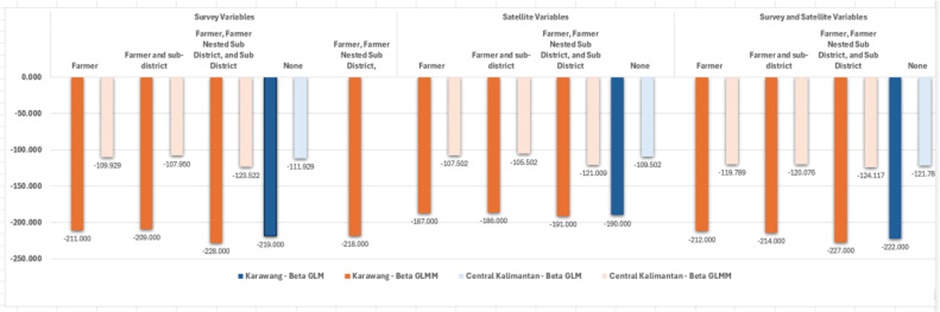
Figure 4. Four-Parameter Beta GLM and GLMM Goodness of Fit.
Subsequently, we scrutinize the predictive fidelity of the chosen four-parameter beta GLMM specifications, benchmarking them against the more adaptable four-parameter beta GMET framework. In total, three four-parameter beta GMET variants were constructed: one relying exclusively on farmer survey predictors, a second on satellite-extracted predictors, and a third integrating both. The four-parameter beta GMET earns its reputation for flexibility by accommodating intricate, non-linear associations between the response and covariates. These models also generate a tree-structured representation that is straightforward to interpret and understand, enabling researchers to pinpoint pivotal predictor variables and their interactions. Four-parameter beta GMET configurations are also recognized for their resilience against anomalous data points and incomplete records, as they do not rely on rigid distributional assumptions about the outcome variable. Finally, four-parameter beta GMET models are computationally efficient and well-suited for managing voluminous datasets with numerous predictors. In the present study, covariate selection during construction of the four-parameter beta GMET is automated, thereby departing from the GLMM development workflow. Nonetheless, future efforts could incorporate supplementary automated selection techniques, such as the LASSO (Least Absolute Shrinkage and Selection Operator) methodology.
The definitive yield forecasts were generated through six selected model configurations (Table 3) applied to the testing dataset. When juxtaposing the six model variants, the four-parameter beta GMET consistently delivers a markedly superior fit across all scenarios, indicating that its greater flexibility aligns well with the inherent characteristics of both survey-based and remotely sensed data streams. Outcomes further indicate that, particularly for the testing partition, both the four-parameter beta GLMM and the four-parameter beta GMET achieve their highest predictive accuracy when survey and satellite data are combined, as reflected by the lowest RRMSE and RMSE values. Thus, merging survey-derived information with satellite observations demonstrably elevates forecasting performance.
Table 3. Prediction accuracy based on RRMSE of GMET and GLMM models was developed.
Model | Testing data set | Training data set | ||
Central Kalimantan | Karawang | Central Kalimantan | Karawang | |
GLMM with farmer survey data | 0.261 | 0.110 | 0.123 | 0.120 |
GLMM with satellite data | 0.283 | 0.150 | 0.121 | 0.110 |
GLMM with farmer survey and satellite data | 0.247 | 0.170 | 0.117 | 0.110 |
GMET with farmer survey data | 0.020 | 0.200 | 0.000 | 0.097 |
GMET with satellite data | 0.025 | 0.004 | 0.000 | 0.000 |
GMET with farmer survey and satellite data | 0.020 | 0.002 | 0.000 | 0.001 |
The four-parameter beta GMET specification that merges farmer questionnaire responses with satellite-derived measurements marginally surpasses the four-parameter beta GMET variants relying exclusively on either survey or satellite inputs. The predictive precision across the three GMET configurations is comparable, an advantageous feature, as satisfactory forecasting performance can be achieved using either grower-reported or remotely sensed data in isolation. Looking ahead, however, the deployment of satellite data for predictive tasks holds greater promise, given that orbital imagery encompasses vast geographic extents, rendering it well-suited for discerning patterns and trajectories across broad spatial domains. In contrast, questionnaire data are typically confined to particular localities or modest sample sizes, which may fail to adequately represent entire regions. Satellite observations can also be accessed in near-real time, facilitating rapid event forecasting. Survey data, conversely, may require weeks or months to gather and process. Lastly, the expense of administering field surveys, especially across sizable samples, can be considerable, whereas satellite data are often readily obtainable at comparatively modest cost.
The four-parameter beta GMET models described above result from a pruning procedure. Accordingly, they constitute more parsimonious formulations, as superfluous parameters have been stripped away. Nonetheless, owing to the transformation step applied during model development, a back-transformation must be executed via y=y∗(b−a)+a to recover the actual paddy productivity figures.
Broadly speaking, the optimal four-parameter beta GMET specification for each study area (Figure 5) pinpoints the time-lagged values of Band 4, Band 8, and NDVI as influential predictors. In Central Kalimantan, Band 8 readings from 11 months prior can forecast present-day rice yields. Analogously, in Karawang, NDVI measurements from 12 months earlier also predict current productivity levels. Among the three indices, Band 4 was designated as the initial splitting node in both locales, making it the foremost predictor variable for capturing the variability in paddy productivity across Central Kalimantan and Karawang. Even so, further refinement is warranted by including additional present and historical NDVI and Band 8 states. NDVI shows the greatest number of selected lag periods in both regions, indicating that not only contemporaneous NDVI values but also antecedent NDVI values exert meaningful influence on forecast precision. Such lagged observations furnish distinctive insights into vegetation conditions that shape present-day yields. They also mirror seasonal cycles, a dimension explored in greater depth in the subsequent subsection. Hence, ensuring consistent and precise NDVI data collection over time is imperative to sustain the model's predictive capacity.
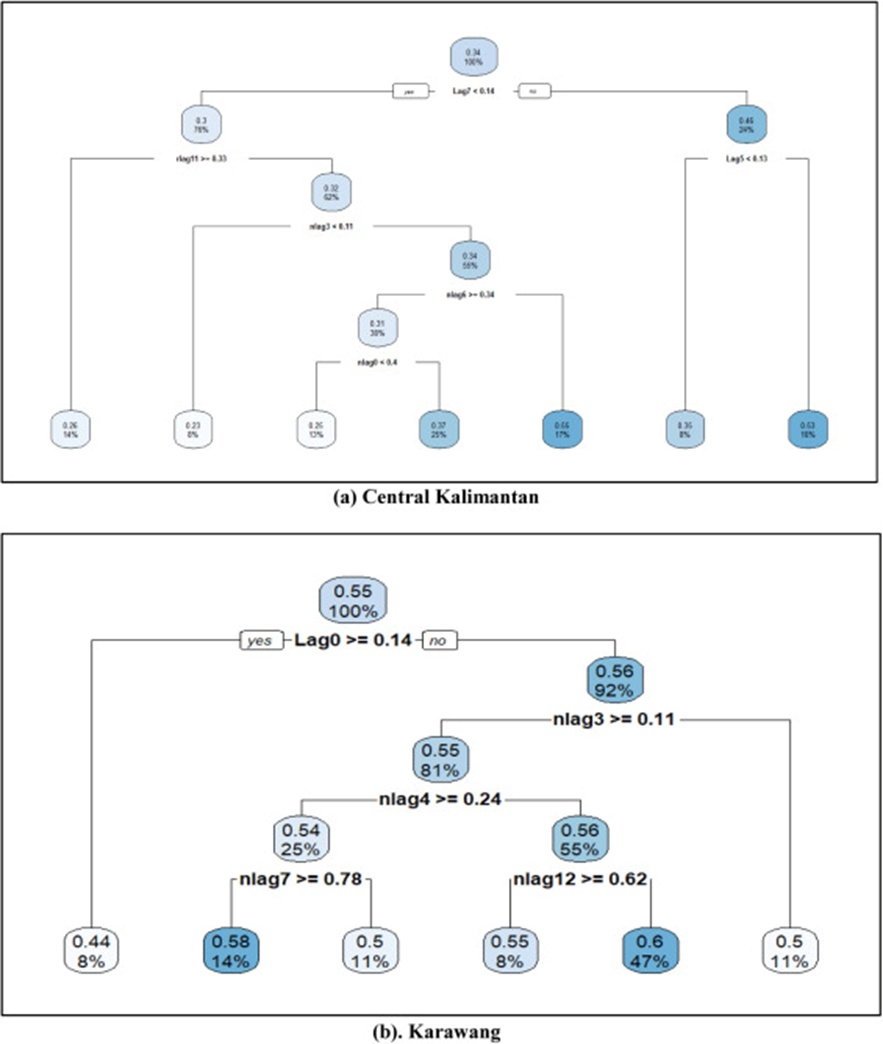
Figure 5. The best model: four-parameter beta GMET model.
The pronounced role of temporally lagged satellite measurements suggests that archival remotely sensed data can serve as a principal determinant of rice productivity. These outcomes resonate with the work of Debaeke et al. [21], in which amplifying the exploitation of satellite data enables stakeholders to generate yield appraisals across expansive territories where direct access to individual grower survey records may be absent. Such intelligence can also underpin the surveillance and preservation of crop vitality during critical phenological phases, potentially boosting yields. Drawing on our model, this monitoring process can commence as early as seven months beforehand. Whereas conducting such field-based survey operations demands considerable time and financial outlay, harnessing satellite data provides a more cost-effective approach for large-scale operations.
We now turn to an interpretation of the fitted models specific to each region. In Central Kalimantan, rice fields with elevated Band 4 index readings that persist for up to 5 months are associated with relatively high mean productivity (3.60 tons/ha). Conversely, fields characterized by diminished Band 4 index values at a seven-month lag, coupled with either low Band 8 index readings at an eleven-month lag or elevated Band 8 index readings at an eleven-month lag paired with depressed NDVI values spanning three to five months prior, are linked to lower average yields (2.14 tons/ha). A comparable pattern emerges in Karawang: rice fields registering elevated present-day Band 4 index readings tend to be associated with reduced average productivity (4.20 tons/ha), while fields with lower present-day Band 4 index values diverge according to antecedent NDVI conditions. The highest forecasted rice yields were observed where elevated NDVI readings 4 and 12 months earlier were evident (4.57 tons/ha).
In brief, the two models exhibit considerable resemblance. The point of departure lies in the finding that Band 8 was not identified as a critical factor in Karawang. The divergent significance of Band 8 between Karawang and Central Kalimantan plausibly mirrors the contrasting agricultural profiles of these regions. Central Kalimantan features a broader assortment of vegetation types and denser forest cover, which likewise contributes to heightened heterogeneity in paddy productivity conditions. This circumstance elevates Band 8 to a more indispensable role for fine-grained monitoring. Band 8 is highly responsive to lush, vigorous vegetation, making it crucial for differentiating among various vegetation classes and their respective health statuses.
In contrast, Karawang constitutes an agrarian landscape dominated by expansive rice monocultures, resulting in comparatively uniform productivity conditions. The homogeneous and specialized character of paddy fields may obviate the critical necessity for Band 8 that heterogeneous vegetated landscapes demand, such that dependence on Band 4 and NDVI for predicting rice yields is judged adequate. Evidently, cultivating a deeper appreciation of these regional distinctions helps tailor remote sensing strategies to specific environmental and agricultural needs.
Within Indonesia, three principal cultivation seasons are recognized by Statistics Indonesia (SI): Sub Round 1 (January–March), Sub Round 2 (April–June), and Sub Round 3 (August–December). The harvest peak customarily falls within the Sub Round 1 window. At the opposite extreme, rice yields are lowest during the dry planting period of Sub Round 3, when cultivation is feasible only in areas with robust irrigation infrastructure. As illustrated in Figure 3, both NDVI and Band 8 (Near-Infrared, NIR) ascend as the rice crop progresses from establishment through to harvest. This pattern is clearly manifested during Sub Round 1 and Sub Round 2. During Sub Round 3, by contrast, NDVI and Band 8 undergo a decline, mirroring the sharp reduction in productivity. Elevated NDVI and Band 4 readings denote healthier, denser, and more vigorous vegetation canopies, which correspond to greater yields. NDVI responds to leaf area index, chlorophyll concentration, and canopy architecture, all of which are closely linked to photosynthetic performance, biomass production, and the prospective yield of robust plants. Thriving plants also exhibit strong reflectance in the near-infrared portion of the spectrum, resulting in high Band 8 index readings.
Meanwhile, Band 4 (the Red Band) may not exhibit a straightforward correlation with productivity. Even so, Band 4 constitutes a vital element within broader analytical frameworks, such as vegetation indices linked to productivity evaluations. Figure 6 further delineates, in finer detail, a recurring similarity between the prevailing conditions of Sub Round 1 and the antecedent conditions of Sub Round 2 and Sub Round 1. This observation corroborates the findings yielded by our Four-Parameter Beta GMET Model.
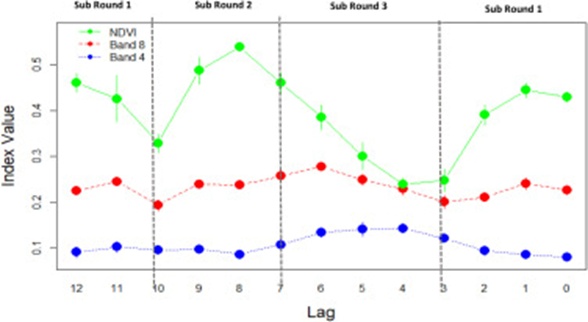
Figure 6. Band 4, band 8, and NDVI index trend.
A finer-grained examination allows us to examine how band 4, band 8, and NDVI correlate with yield at the present moment and through their lagged antecedent measurements. To support this exploratory analysis, harvest figures were partitioned into four strata—high, medium, low, and very low—aligned with their quartile cut-points. For every stratum, the graphical displays are rendered using bivariate high-density estimates. The shading progresses from faint tints to deeper hues as concentration increases, so that the darkest zones indicate regions of maximum point density. Scrutiny of these displays reveals a degree of overlap in certain observations spanning neighboring categories, implying that individual data points could plausibly belong to dual groupings. This observation hints that subsequent investigations might profit from adopting more refined clustering methodologies for yield classification. That said, Figure 7 offers several compelling insights.
To begin with, under the immediate harvest-phase circumstances, the linkages between observed yield (Y) and the spectral indices Band 4, Band 8, and NDVI adopt a downward-sloping configuration for all strata except the low category. This outcome reflects the reality that rice paddies are undergoing reaping, leaving behind scant standing vegetation. Secondly, outside of Sub Round 3, incremental forward movement in the magnitudes of Band 4, Band 8, and NDVI is observed across all productivity strata as one progresses to the subsequent month or lag interval, signalling crop advancement. The displacement is largest for NDVI, with Band 8 next and Band 4 exhibiting the smallest shift. Thirdly, a constructive upward tendency emerges between the spectral index readings and productivity as the calendar approaches the harvest window, implying that more substantial Band 4, Band 8, and NDVI figures serve as harbingers of amplified harvests. This phenomenon becomes more pronounced in Sub Rounds 1 and 2 across the high, medium, and very low strata. Should productivity instead sit within the low band, the trajectories remain largely static. Lastly, Sub Round 3 is characterized by attenuated displacements and weaker systematic trends throughout each yield stratum, a consequence of the arid seasonal phase that prevails during this interval. Hence, comparatively few cultivators undertake planting, and correspondingly limited vegetative expansion is registered by the Sentinel 2A platform. The varied states and trajectories characterizing the interplay of Band 4, Band 8, and NDVI with yield—both instantaneously and across earlier lag points—as visualized in Figure 4, furnish the rationale for the four-parameter beta GMET's tendency to eclipse the four-parameter beta GLMM formulation.
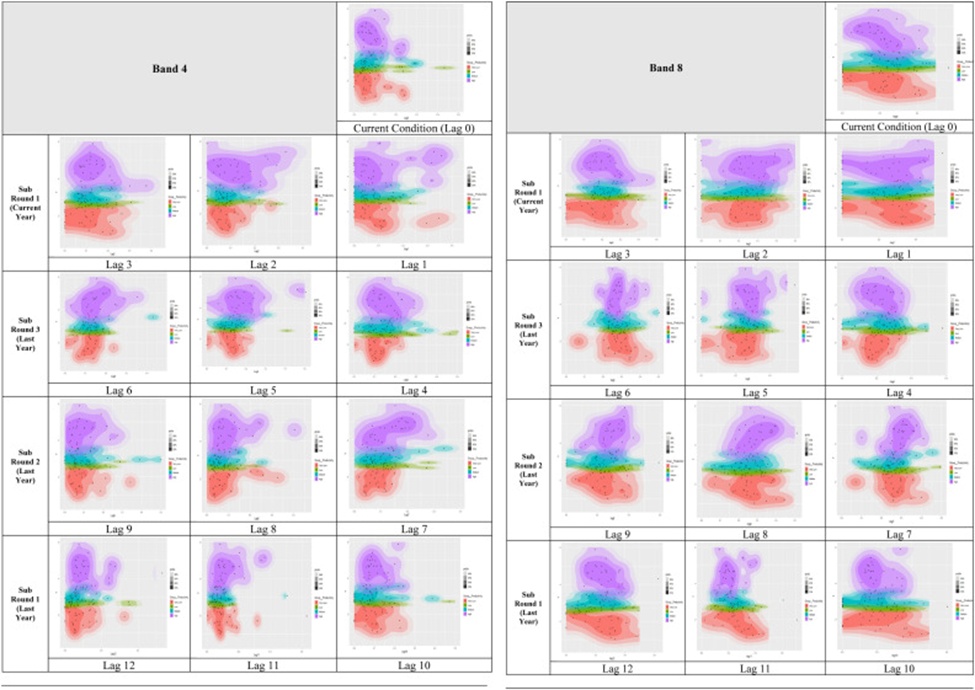
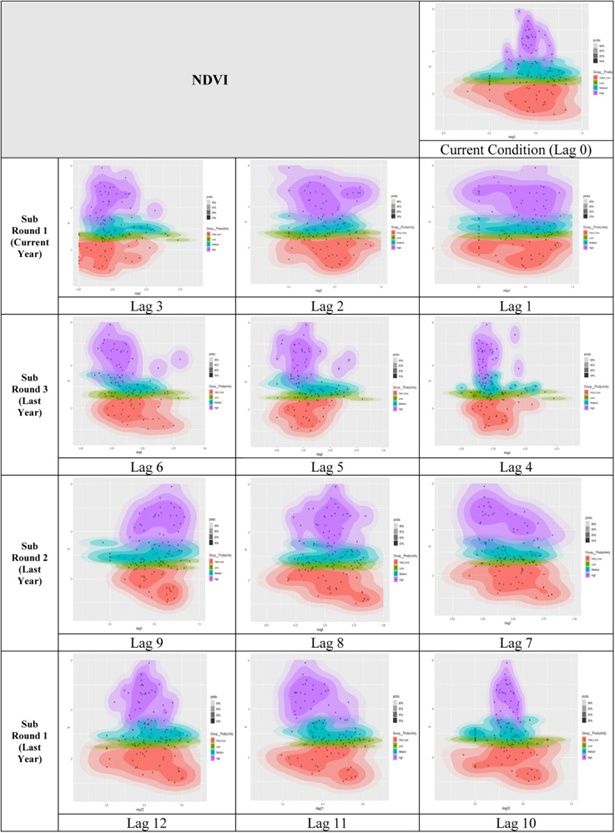
Figure 7. Band 4, band 8, and NDVI scatterplots with productivity groups.
Notwithstanding that the premier model drew on both cultivator survey inputs and orbital data, none of the farmer-supplied variables emerged as among the most influential predictors. Still, should authorities wish to amass deeper intelligence regarding the on-farm determinants of rice output, insights can be drawn from the runner-up specification—the four-parameter beta GMET constructed exclusively from questionnaire data (Figure 8). Within Central Kalimantan, the predominant influence was wielded by Pest handling (x7), followed in declining order by Recent Water Availability (x5), Previous Pest Attack (x2), Recent Pest Attack (x1), and Impact of Climate Change Last Year (x4). Over in Karawang, the principal driver of yield was Impact of Climate Change This Year (x3), with Recent Pest Attack (x1) in second place.
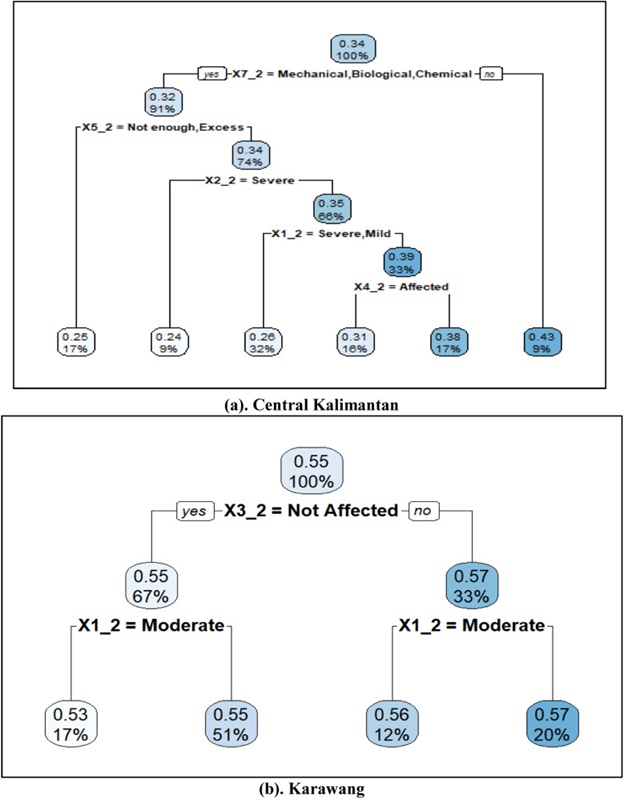
Figure 8. Four-parameter beta GMET model based on farmer survey data.
In Central Kalimantan, characterized by more heterogeneous yield conditions, a broader suite of explanatory factors proved to be operative. In Karawang, by contrast, merely a pair of predictors registered as consequential. Yet across the two study landscapes, pest incursions stood out as a pervasive challenge. The proportion of growers reporting infestations in both the ongoing and prior year exceeded 95% (Figure 9). The bulk of cultivators grappled with infestations ranging from mild to moderate severity. The predicament is somewhat more pressing in Central Kalimantan, where no fewer than one-quarter of farmers have been compelled to contend with severe pest outbreaks. Conversely, in Karawang, no respondent reported a severe infestation. Producers under harsher pest pressure generally record depressed harvest tonnages (Figure 10).
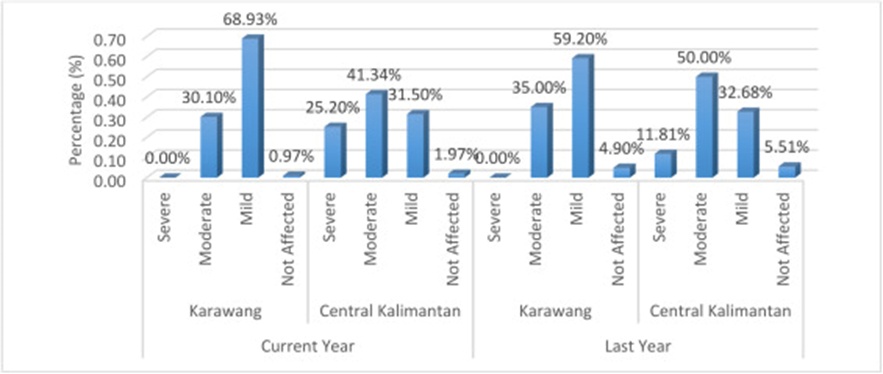
Figure 9. Pest attack severity in Central Kalimantan and Karawang.
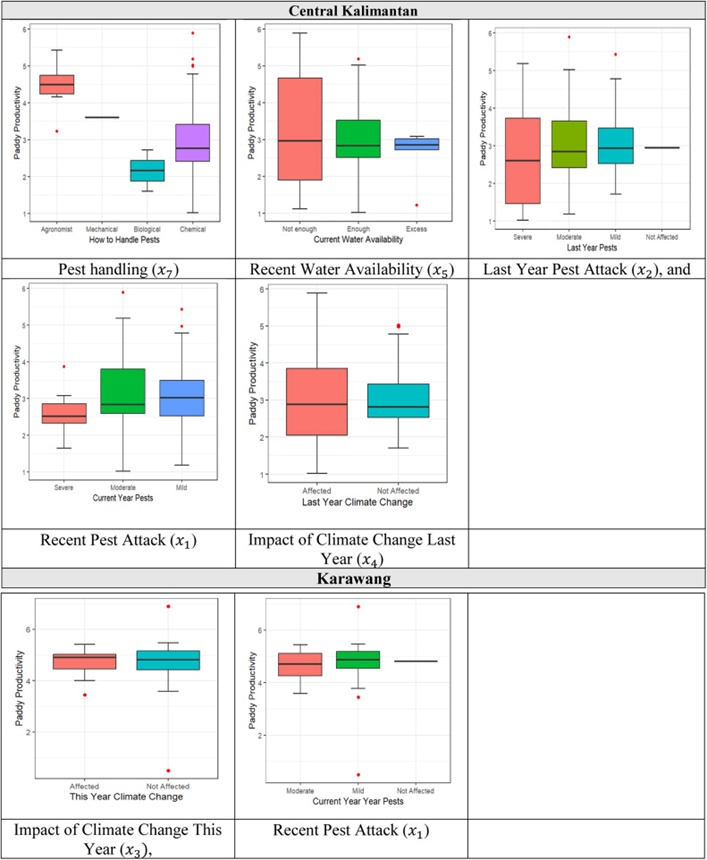
Figure 10. Clustered Boxplots of Farmer Survey Data and Paddy Productivity.
In addition to pestilence, shifting climatic conditions represent another shared concern across both territories. Climate variability translates into altered temperature profiles, modified rainfall distribution, or a heightened frequency of extreme meteorological phenomena. A minimum of 20%–40% of cultivators have felt the repercussions of such climatic shifts (Figure 11). Compared with the preceding years, a greater proportion of Central Kalimantan's growers reported experiencing climatic impacts than their Karawang counterparts. At least a quarter of Central Kalimantan's farming community has been severely affected by climate change. Consequently, agriculturalists in this zone face heightened susceptibility to climate-induced perturbations, resulting in depressed and irregular harvests that erode the reliability of farming as a livelihood. On the flip side, Karawang's agriculturalists have not experienced any severe climatic impacts in either the immediate or the previous year. From this, one can deduce that Karawang's producers enjoy comparative advantages rooted in more stable weather regimes, progressive cultivation practices, superior physical infrastructure, and enhanced connectivity to resources and institutional backing. These endowments empower Karawang's farming sector to adapt more readily and insulate itself against climate-driven stresses, thereby safeguarding steadier and more robust agricultural performance.
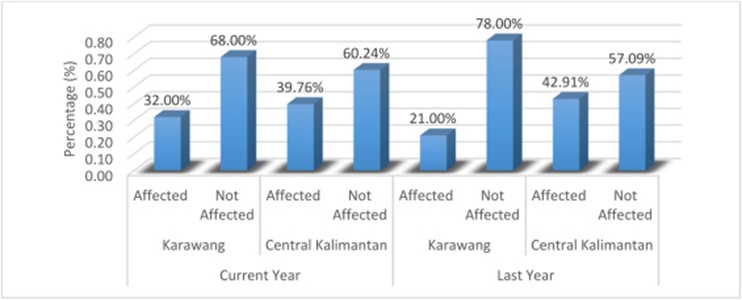
Figure 11. Climate change impact in Central Kalimantan and Karawang.
The nexus tying climate change to pest dynamics is acknowledged as noteworthy and capable of magnifying pest-induced stresses on cultivated plants and natural ecosystems [23]. Through modifications in temperature, rainfall distribution, and ecological interdependencies, climate change can reconfigure pest abundance, territorial spread, and overall consequences. Hence, sound pest governance under a shifting climate necessitates adaptable tactical approaches. Evidence from Central Kalimantan indicates that farmers who employ agronomy-based pest management strategies tend to achieve higher mean yields (3.11 tons/ha). To achieve durable pest suppression, agronomists typically marshal a combination of cultural, biological, chemical, and prophylactic measures within an Integrated Pest Management (IPM) framework, striving to reduce hazards to human health and ecological integrity while keeping pest densities below economically injurious thresholds. Such comprehensive orientation helps optimize rice output. In parallel, growers who eschew the agronomic route—especially when paired with circumstances of plentiful or adequate water yet concurrently facing severe-to-mild pest infestations in both the previous and current cropping cycles—tend to post the poorest average harvests (2.28 tons/ha). This scenario illustrates that cultivators who refrain from agronomic methods remain disproportionately exposed to pest damage, despite sufficient water. This reality underscores the imperative of carefully tailoring IPM protocols to local environmental conditions. By redressing these constraints through superior pest management regimes, the welfare of paddy farmers can be improved, yield levels raised, and output volatility reduced.
Drawing upon the findings laid out above, the four-parameter beta GMET emerged as the most fitting specification for forecasting rice yields when Sentinel 2A orbital imagery is merged with cultivator questionnaire responses. A distinguishing feature of the four-parameter beta GMET is its capacity to incorporate random-effect terms, estimated via the GLMM framework.
Once the random-effect structure associated with an explanatory factor is characterized, the four-parameter beta GMET formulation can generate conditional forecasts that account for these effects, thereby yielding group-tailored predictions [18]. The results discussed earlier have already accounted for these random components. As a consequence, the mean estimates will differ across individual growers, growers nested within sub-districts, or across districts. Should a deeper investigation into the random effects be desired, researchers may compute their associated confidence bands. For instance, when the 95% confidence interval around an estimated random effect excludes zero, this provides statistical support for the assertion that the random component introduces a meaningful deviation from the overall mean effect. In our analysis, such a pattern was observed for both sub-district and district random effects; certain sub-districts exhibited confidence intervals lying entirely above zero, whereas others fell entirely below zero, pointing to substantive latent heterogeneity among sub-districts and districts (Figure 12). Regarding the farmer-level random effects in Central Kalimantan, confidence intervals were found to reside either entirely above or entirely below the zero threshold, signifying that some cultivators systematically underperform while others consistently outperform. By contrast, among Karawang growers, the majority are performing adequately with comparatively limited dispersion.
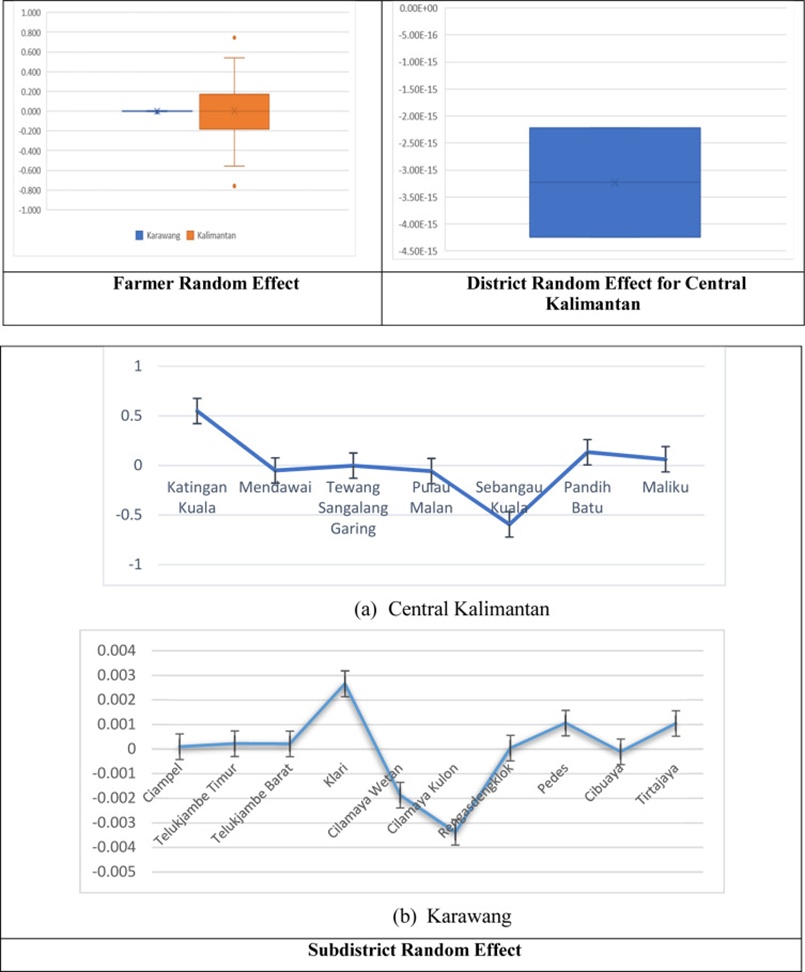
Figure 12. Estimated Random Effects for Best Four-Parameter Beta GMET Model.
While the performance delivered by the four-parameter beta GMET is encouraging, several caveats must be acknowledged, enumerated as follows:
1. The transformation procedure has the potential to introduce systematic distortion into parameter estimates and to complicate the interpretation of coefficient magnitudes. In the present work, our emphasis rested primarily on predictive fidelity, meaning these shortcomings may remain inconspicuous. Nonetheless, dedicated follow-up research to quantify the consequences of the transformation step and devise corrective measures should be pursued. As a potential workaround, the authors also advocate constructing four-parameter beta Mean and Mode GLMM and GMET variants grounded in Bayesian inferential paradigms [16].
2. This investigation concentrated on two distinct geographies—Central Kalimantan and Karawang—which exhibit contrasting agronomic profiles. Looking ahead, it will be necessary to deploy the four-parameter beta GMET and GLMM across additional territories with traits dissimilar to those of Central Kalimantan and Karawang to enrich the diversity of the training data. Doing so would strengthen model generalizability, parameter stability, and forecasting precision.
3. Caution is also warranted regarding reliance on archival satellite records, which may not entirely mirror present-day realities. Satellite measurements are subject to inherent temporal and spatial granularity constraints determined by the acquisition epoch and the specific sensor platform employed. Imagery can also be affected by quality issues, including cloud obstruction, sensor anomalies, or calibration drift, all of which may introduce noise or create data gaps. It is therefore essential to incorporate current satellite observations and to benchmark model outputs against contemporary ground conditions to mitigate these constraints.
4. Incorporating additional covariates—such as phenological indicators, climatic variables, and geospatial attributes—should be explored to bolster rice yield forecasting under shifting climatic regimes. Phenological metrics are tightly coupled to crop developmental phases and are thus pivotal for yield determination. Phenological stages can be captured using unmanned aerial vehicles (UAVs) outfitted with multi-spectral and hyperspectral sensors, an approach that has proven highly efficacious [24-26]. Climatic inputs encompass thermal readings, moisture levels, precipitation, and related atmospheric parameters. Geospatial characteristics, including latitude, longitude, and elevation—which remain temporally invariant at a fixed location—could be further exploited by integrating spatial weighting schemes. These factors have been demonstrated to exert a substantial influence on rice yield estimation [24].
5. Within this work, the four-parameter beta distributional framework was exclusively coupled with GLMM and regression tree architectures. A broad spectrum of Machine Learning algorithms has been used for yield prediction, including Random Forests, Support Vector Machines, Artificial Neural Networks (ANNs), and Gradient Boosting Trees [14]. These techniques have been widely deployed, and their efficacy fluctuates depending on the predictor set and the specific algorithms trialed. Accordingly, researchers are encouraged to advance hybrid model formulations that marry the four-parameter beta GLMM with these machine learning paradigms. Such hybrids can harness the complementary strengths of statistical models such as GLMMs and contemporary machine learning algorithms.
Notwithstanding the aforementioned limitations, this investigation furnishes meaningful contributions regarding the application of four-parameter beta GMET and GLMM methodologies for rice yield forecasting. Our proposed four-parameter beta GMET and GLMM framework delivers the following benefits:
1. Enables prediction for response variables governed by a four-parameter beta law that vary spatially, are skewed, and are confined within identifiable lower and upper bounds, realized through the four-parameter beta GLMM and GMET.
2. In settings marked by pronounced response variability, the four-parameter beta GLMM specification has proven capable of elevating predictive accuracy beyond that achieved by the four-parameter beta GLM.
3. In contexts characterized by both substantial response heterogeneity and a mixture of linear and non-linear associations linking the outcome to its predictors, the four-parameter beta GMET has demonstrated superior predictive accuracy relative to the four-parameter beta GLMM.
4. Graphically depicting the linkages between the outcome and the most salient predictor variables constitutes an ancillary step that aids analysts and policymakers in conducting deeper inquiry and delivering well-rounded guidance.
A central objective of this study was to identify a modeling framework that enhances the reliability of paddy yield forecasts. This aim was realized through the deployment of a novel analytical strategy, namely the flexible four-parameter beta GMET specification. This formulation proves markedly better suited to projecting rice productivity than the four-parameter beta GLMM, particularly when satellite-derived inputs are used alongside farmer questionnaire data. The results further revealed that satellite measurements carry greater weight—both over short and extended time horizons—than grower-reported information. This underscores the feasibility of predicting rice yields using Sentinel 2A imagery when paired with an appropriately tailored predictive model, such as the four-parameter beta GMET. As a corollary, this route offers considerable savings in time and financial resources relative to sole dependence on field survey collection.
We have demonstrated that the proposed model holds substantial promise due to its elevated predictive accuracy. Consequently, the Ministry of Agriculture, non-governmental organizations, insurance providers, farming communities, and other pertinent stakeholders stand to gain from further advancing and operationalizing yield predictions anchored in this modeling paradigm. Outlined below are actionable suggestions directed at policymakers and practitioners for the effective real-world implementation of this model:
• Devise policies and on-the-ground action plans that foster sustainable cultivation practices informed by model-based forecasts. For example, formulating strategies and operational blueprints that promote crop diversification in zones where projected yields are depressed could help mitigate risk.
• Harness predictive outputs to pinpoint and safeguard regions adversely affected by climate variability by deploying tailored mitigation interventions.
• Institute early warning mechanisms for detecting food insecurity threats and serve as a benchmark for food self-sufficiency initiatives.
• Equip field personnel and growers with the skills to interpret and leverage productivity forecasts for their advantage. Doing so would advance the adoption of precision agriculture methods by coupling GLMM-driven predictions with GPS and Internet-of-Things technologies to refine farm-level management.
• Undertake routine monitoring of forecast fidelity and recalibrate both the model and the underlying data as circumstances warrant. This entails juxtaposing projected yields against realized harvests to gauge ongoing model performance.
• Broaden the model's application, especially in territories where direct access to individual farmer surveys and crop-cutting experiments may be absent. The applicability of this model extends beyond rice yield estimation and can be adapted to other case studies with characteristics analogous to those delineated herein.
Beyond the policy-oriented counsel presented above, subsequent research endeavors could be directed toward constructing four-parameter beta Mean and Mode GLMM and GMET formulations within a Bayesian estimation setting to circumvent the potential for parameter bias and interpretive complications that accompany the transformation procedure. It is also advisable to deploy and validate the model across a broader spectrum of geographic settings to augment its generality, robustness, and predictive power. We further recommend augmenting the model with pertinent phenological, climatic, and geospatial predictor variables. Lastly, it is proposed that the model be integrated with additional machine learning techniques, a step likely to yield further gains in both forecasting accuracy and model interpretability.
The authors would like to acknowledge funding support from the Southeast Asian Regional Center for Graduate Study and Research in Agriculture (SEARCA) and the SUIJI Japan PhD Exchange Program. The authors are also very grateful to Statistics Indonesia for sharing the CCEs and farmer survey data in Central Kalimantan. Lastly, the authors would like to express their deep gratitude to Prasetiya Mulya University, Indonesia; IPB University, Indonesia; and The United Graduate School of Agricultural Sciences (UGAS), Ehime University, Japan, for their support and assistance during this study.
None
This research received a dissertation grant from the Southeast Asian Regional Center for Graduate Study and Research in Agriculture (SEARCA), Ref No GBG20–3281.
None
Open Access The author(s) retain copyright. This article is licensed under the Creative Commons Attribution-NonCommercial-ShareAlike 4.0 International License. It may be shared and adapted for non-commercial purposes with appropriate attribution, an indication of changes, and distribution of adaptations under the same license. Third-party material may be subject to separate terms identified in its credit line. View the license at https://creativecommons.org/licenses/by-nc-sa/4.0/.
 Agro Intelligence Research Press