A shortage of calcium and the resulting physiological problems, like tip burn, create serious difficulties for indoor hydroponic lettuce growing, reducing both harvest and grade. This paper puts forward a unique strategy that merges cutting-edge image segmentation and classification methods to spot calcium insufficiency in lettuce during its growth phases under colored LED light. Recognizing nutrient shortfalls at an early stage is key for prompt correction and efficient nutrient control. The trial cultivated butterhead lettuce in a Deep-Water Culture (DWC) arrangement with managed calcium doses. Image preparation steps, involving Contrast Limited Adaptive Histogram Equalization (CLAHE) and Red Color Correction (RCC), were used to boost picture quality and uniformity, and augmentation was performed to increase model resilience. Our method adopted a two-step workflow that enabled us to exploit the advantages of dedicated models. First, lettuce foliage was separated from the backdrop through state-of-the-art architectures, including U-Net, U-Net++, Recurrent U-Net, and Inception U-Net. U-Net++ showed the top segmentation performance (98.56%) with strong generalization compared to its counterparts. Segmentation extracts the target zone and discards background clutter, permitting the classifier to focus more productively on disease-indicating traits. Deep learning classification networks, namely ResNet and EfficientNet, were used in the second step to identify calcium insufficiency from the segmented pictures. EfficientNetB2 stood out as the most dependable classifier, securing an accuracy of 91.51% on the RCC dataset, while Resnet50 attained a closely matching accuracy of 91.18% on that same dataset. This work emphasizes the promise of weaving deep learning models into automated hydroponic setups for live nutrient tracking, supplying a workable answer to improve output and sustainability in indoor hydroponic operations.
The rising appetite for nutritious, high-value food has driven investigations into progressive farming methods like indoor hydroponics for raising crops such as lettuce (Lactuca sativa). Soilless cultivation systems bring multiple gains over conventional earth-based agriculture, such as quicker development, bigger harvests, and the capacity to exactly regulate environmental variables [1]. Yet, keeping ideal nutrient amounts in hydroponic installations is critical, since any disproportion can swiftly trigger insufficiencies or toxic buildups [2, 3].
Careful tracking and management of both the air and root-zone settings are vital to guarantee optimal, vigorous development in hydroponic growing [4]. Ideal nutrient assimilation hinges on the accessibility of specific macronutrient elements—nitrogen (N), phosphorus (P), potassium (K), magnesium (Mg), sulfur (S), and calcium (Ca)—plus micronutrients within the feeding solution, and each of these components fulfills unique functions for plant growth and caliber [2]. Calcium serves as an essential element for crop development, contributing fundamentally to cell wall composition, cellular division, and signaling pathways [5, 6]. A calcium shortfall is especially troublesome, as it can bring about physiological dysfunctions like tip burn, which negatively affects both the output and standard of lettuce [7]. Resolving this matter calls for prompt discovery and action, which has spurred inquiry into novel approaches harnessing computer vision and deep learning technology.
Standard techniques for detecting calcium shortage rely on visual checks and chemical testing, both of which are effort-intensive, slow, and frequently influenced by personal judgment [8]. An acute requirement exists for mechanized, exact, and non-disruptive means to diagnose calcium shortage early in lettuce’s development. Convolutional Neural Networks (CNNs), a branch of deep learning structures possessing convolutional layers, have achieved outstanding results in image identification tasks. Within the domain of crop health surveillance, CNNs have been widely scrutinized for their capability in pinpointing plant leaf ailments [9]. These frameworks can learn intricate motifs and characteristics from vast picture collections, making them well-suited for spotting understated signs of crop nutrient insufficiencies. Accordingly, deep learning structures, most notably CNNs, have been commissioned to detect and categorize assorted crop diseases [9, 10]. These frameworks can be trained on annotated data collections to discern specific illness indicators with considerable accuracy and sturdiness. For illustration, CNNs have been deployed to pick out lesions and blemishes triggered by different pathogens, evidencing their capacity to substitute standard diagnostic practices [11].
Earlier works have probed the usage of machine vision and digitized crop characteristics to spot nutrient insufficiencies within controlled growing spaces. These methodologies entail taking RGB snapshots of lettuce specimens and interpreting optical signals like color, surface pattern, and form to pinpoint shortage markers. Story et al. [12] harnessed computer vision methods via Top Projected Canopy Area (TPCA) to recognize calcium shortage in greenhouse-raised lettuce. Taha et al. [13] employed a Deep CNN (DCNN) to determine N, P, and K shortfalls in lettuce cultivated in aquaponic setups. They applied SegNet to partition pictures, then Inception3 and Resnet18 for sorting, and measured their findings against those from conventional frameworks, among them Support Vector Machine (SVM), K-Nearest Neighbor (KNN), and Decision Tree (DT). The work noted the highest accuracy mark of 96.5 % with Inception3. Lu et al. [14] applied three classic machine-learning methods (KNN, SVM, and random forest) to pinpoint nutrient shortages (potassium, calcium, and magnesium) in lettuce raised under LED illumination. They further employed lightweight deep-learning frameworks (ShuffleNet, SqueezeNet, and MobileNetV2) alongside feature derivation techniques (Gray-level Co-occurrence Matrix and Local binary pattern). They recorded stronger showings using deep-learning frameworks rather than classic models. An additional study [15] made use of different CNN models (EfficientNetB0 and MobilenetV3) coupled with SegNet for picture partitioning of greenhouse-raised lettuce to determine nitrogen and potassium deficits. On the other hand, Xie et al. [16] made use of Field-Programmable Gate Arrays (FPGAs) along with multi-faceted images crafted via a blend of threshold partitioning, refined Canny edge recognition, and gradient-steered adaptive threshold partitioning. The investigation noted a mean precision of 0.944, a recall level of 0.943, and an F1 measure of 0.943 for discerning NPK through varying lettuce growth intervals.
The exactness of catching any shortage indicator via computer vision relates directly to picture fidelity, which becomes tricky under man-made lighting in indoor cultivation, notably with colored LED lamps. Hence, Sankaran et al. [17] declare that refined methods for spotting crop diseases, like weaving together multiple technological instruments—hyperspectral imagery, infrared spectroscopy, and fluorescence spectroscopy—are called for to strengthen diagnostic accuracy and can round out both classic and deep learning-rooted strategies. Such technologies can yield holistic information on crop well-being, easing prompt action and successful handling of nutrient insufficiencies. Pandey et al. [18] deployed hyperspectral imagery paired with sophisticated picture handling methods to enable the quick spotting of nutrient troubles and forecast leaf nutrient densities (NPK, magnesium, calcium, and sulfur) in lettuce through a Partial Least Squares Regression (PLSR) framework. The noted R² figures spanned from 0.60 to 0.88 for N, P, K, and S, whereas those for Ca and Mg remained markedly low, spanning from 0.12 to 0.34. Even so, fluctuations in man-made light sources, steep computation needs, the intricacy of information reading, and merging hurdles with current tracking systems block the real-world roll-out of these technologies for live appraisal of nutrient strain. RGB imaging stands as a more practical substitute thanks to its inexpensiveness, straightforward embedding, and toughness under artificial lighting environments [19]. RGB platforms are fairly light on computation, suiting them better for continuous mechanized nutrient monitoring and fusion with existing precision cultivation architectures [20, 21]. Owing to light’s variability across time and the challenge of crunching big data volumes in tough settings, doubt in ambient circumstances constrains the impactful employment of RGB imaging [22]. This, sequentially, blocks the faithful real-time spotting of calcium shortage signs in indoor-raised lettuce beneath LED lighting, most of all when trying to fit light regimes to the crop’s particular requirements with hopeful correctness and model solidity. To get past these bounds, we put forward an original technique that productively handles the ambiguities in light and surrounding elements.
Contemporary writings reveal that deep learning models beat traditional machine learning (ML) pathways in singling out nutrient deficits in lettuce. The lion’s share of extant research has zeroed in on pinpointing N, P, and K insufficiencies via RGB pictures and CNN constructs such as EfficientNet and MobileNet. Even so, a meaningful research void lingers in dealing with the effect of colored multi-spectrum LED lighting on picture-based identification reliability. To be exact, the part played by sophisticated picture pre-processing to offset lighting-caused artifacts has escaped full examination. To close this void, the current study rolls out a novel dual-stage deep learning framework for the real-time pinpointing of calcium shortage in hydroponically grown lettuce under colored LED lighting circumstances across its full growth span. In the first part, a suite of picture segmentation constructions—U-Net, Recurrent U-Net, and Inception U-Net—is assessed for its power to pull lettuce foliage away from complicated backdrops. The second part centers on reliably sorting the partitioned foliage pictures through CNN-grounded constructs, precisely ResNet-50 and EfficientNet, to pick out optical signs of calcium shortage. This route sharpens identification exactness under tough lighting circumstances and adds to the crafting of intelligent tracking tools for regulated environment cultivation.
The investigation was carried out under regulated circumstances within an indoor cultivation enclosure at the Controlled Environment Engineering (CEE) Laboratory, Department of Biological and Agricultural Engineering, University of California, Davis, California, United States. The experimental arrangement featured a DWC configuration, as shown in Figure 1a, where plant root masses stay constantly submerged in an oxygen-infused, nutrient-loaded solution. A batch of 54 butterhead lettuce seeds was first germinated and afterwards relocated into the DWC setup. The rig consisted of three growing beds, each outfitted with 24 planting sockets laid out in a 3-by-8 formation. Before transplanting took place, the solution pH was stabilized at 6.8 for every treatment and subsequently left undisturbed through the remainder of the trial; CO₂ concentrations were sustained near 400 ppm, while EC figures fluctuated according to the assigned treatment. As depicted in Figure 1b, distinct nutritional regimes were allotted to each bed to mirror differing degrees of calcium accessibility: (1) Treatment 1 (T1): Mild Stress, offering a suboptimal calcium dose, (2) Treatment 2 (T2): Extreme Stress, providing a virtually eliminated calcium dose, and (3) Control treatment (Control): Full calcium provision. Nutrient recipes for every regime were derived from a half-strength Hoagland solution [23] together with its calcium-omitted modifications, thereby securing controlled discrepancies in calcium availability.
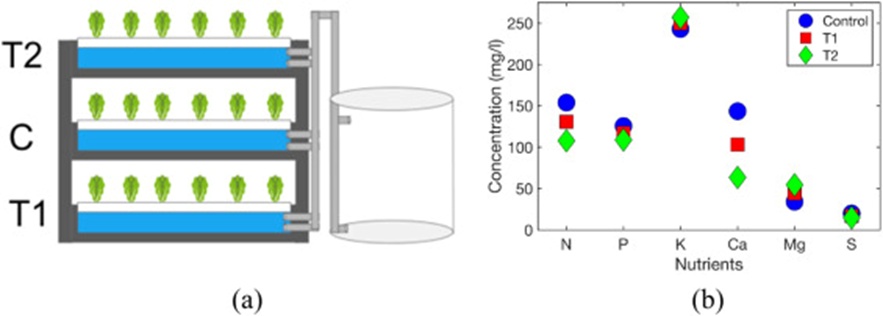
Figure 1. (a) Schematic of deep-water culture apparatus with treatments assigned per level, (b) macronutrient profiles under the three calcium regimes of Treatment 1 (T1), Treatment 2 (T2), and Control (C).
Data acquisition extended over a growing timeframe from November 18, 2023, to December 20, 2023. Photographs were taken on a daily basis using an Intel RealSense Depth Camera D405 (Intel Corporation, United States), capable of delivering RGB frames at a resolution of 1280 × 720 pixels. In sum, 1944 frames (27 days × 24 heads × 3 trays) were gathered spanning the three nutrient regimes. A hardware controller malfunction broke the imaging sequence across all trays between December 11 and December 16, leading to the forfeiture of 432 scheduled captures (6 days × 24 plants × 3 trays). These files were permanently discarded. Spoiled frames contained no salvageable pixel information. Validation and test portions were sourced strictly from dates falling outside the interval so that no partition includes interpolated time stamps. The imaging device was fixed at a height exceeding 50 cm above the crop to gather RGB frames daily, permitting it to take in more than a single lettuce head within each snapshot, as illustrated in Figure 2. Consistent with the results described by Son et al. [24], pictures were collected under managed illumination at an intensity of 200 mol/m²/s and a spectral blend of 8:1:1:1 (red: green: blue: far-red).
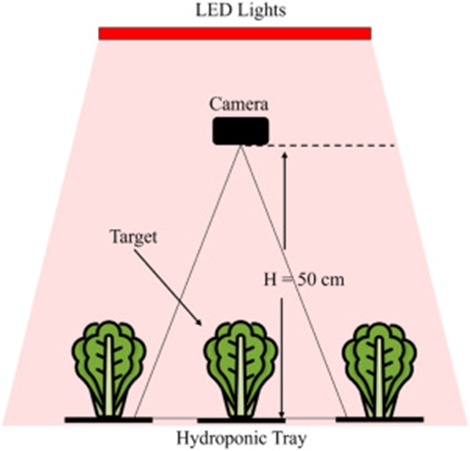
Figure 2. Outline of the overhead camera configuration for lettuce image acquisition.
This research executed a comprehensive image pre-processing sequence aimed at elevating the standard and uniformity of lettuce photographs captured beneath multihued LED illumination, which tends to amplify the red region of the spectrum and includes far-red light for growth promotion. Each picture underwent manual segmentation via LabelMe [25] to obtain exact boundary delineation of the lettuce zones, given that conventional threshold-driven and edge-detection segmentation methods fall short when handling pronounced color deviations and fine-grained details. Images were fed into the application, and Regions of Interest (ROIs) were hand-traced through polygonal markup. Every segmented region received its matching class label, securing steady annotation throughout the complete image set. The annotated information was subsequently saved in JSON format and turned into binary masks for downstream manipulation and model learning. The operational sequence using LabelMe is portrayed in Figure 3.
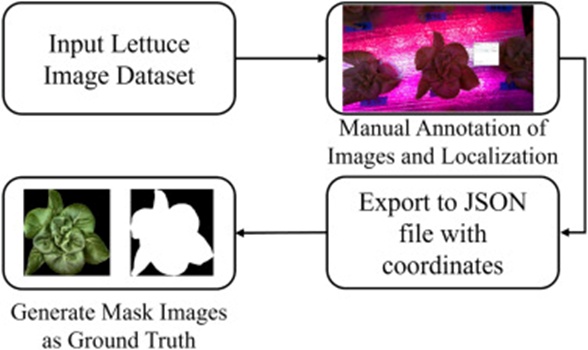
Figure 3. Operational sequence for image partitioning in lettuce production: applying LabelMe for annotation and ground truth mask derivation.
To lessen the effect of the red-skewed light spectrum, Contrast-Limited Adaptive Histogram Equalization (CLAHE) [26] was employed to strengthen contrast and feature visibility. Next, Hue, Saturation, and Value (HSV) tuning was performed to remedy color distortions, in particular lowering the prominence of red by a predetermined coefficient to produce a more natural-looking color palette. Three pre-processing methods were put into practice: (i) CLAHE exclusively, (ii) Red Color Correction (RCC), and (iii) a fusion of CLAHE and RCC. These approaches were tested and measured against the unprocessed images while training with CNN architectures. Figure 4 places the untreated image alongside the versions resulting from color segmentation using the chosen setups (CLAHE, RCC, and fused). Data augmentation maneuvers, encompassing horizontal flipping and rotation, were adopted to boost the model's capacity for generalization and restrain overfitting, growing the dataset count from 1944 to 15,552 instances. This augmentation scheme sought to strengthen model durability by introducing variability in picture positioning while safeguarding critical visual traits.
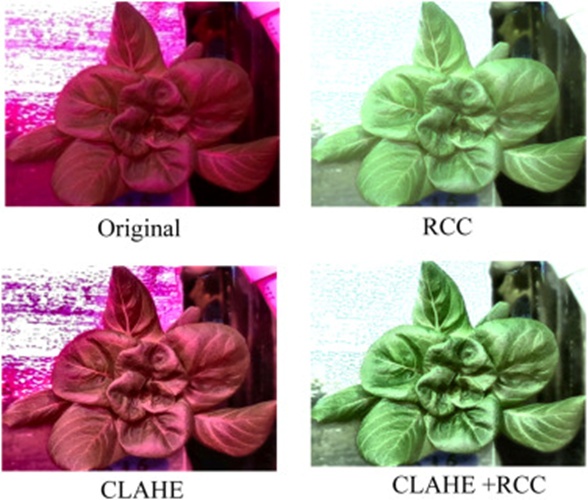
Figure 4. Direct visual comparison of pre-processing approaches (a) untreated, (b) red color correction (RCC), (c) CLAHE, and (d) CLAHE + RCC.
Prior investigations have documented the obstacles faced by ML algorithms when predicting diseases and stress in indoor cultivation beneath artificial lighting, most notably occlusion and spectral distortion with a narrow wavelength range [27]. Consequently, this research adopted a two-stage strategy (segmentation followed by classification) utilizing PyTorch [28] to bring machine learning to bear on calcium stress recognition. A range of convolutional neural network designs was evaluated for both the segmentation and classification tasks. An end-to-end pipeline for image handling and deep learning execution is presented in Figure 5.
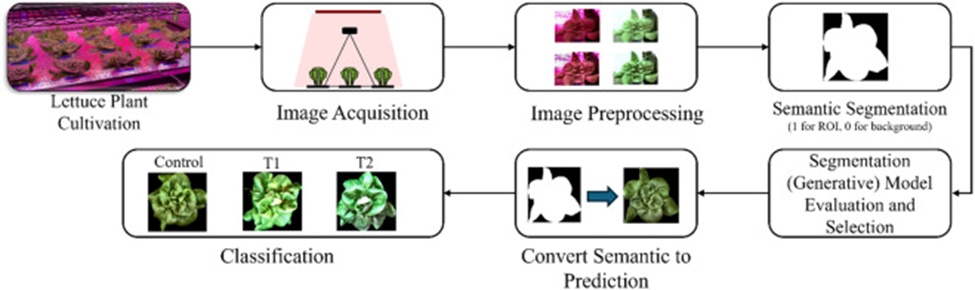
Figure 5. End-to-end pipeline for image handling and deep learning execution: fusing segmentation and classification models for crop vitality surveillance.
Subsequent to pre-processing and manual annotation, CNNs were harnessed to mechanize and enhance the segmentation workflow. Initially, U-Net served as an autoencoder to partition every image belonging to the manually labeled collection, setting a baseline performance yardstick. This tactic allowed for a methodical assessment of segmentation fidelity, providing a reference level for later architectural improvements. To further elevate segmentation precision, the performance of U-Net was benchmarked against several of its evolved derivatives, specifically U-Net++, Inception U-Net, and Recurrent U-Net. Each derivative brought distinct structural adjustments geared toward strengthening feature extraction and boundary fidelity, such as U-Net++ incorporating nested skip linkages for improved feature reprocessing, Inception U-Net leveraging multi-scale feature capture through inception units, and Recurrent U-Net embedding sequential characteristics to account for temporal interdependencies.
Upon completion of the segmentation stage, classification was executed to distinguish plants subjected to the three distinct treatments. Multiple classification architectures, among them EfficientNetB2, EfficientNetB3, and ResNet50, were deployed because of their proficiency in discerning complicated motifs and telling apart nuanced variations in plant condition. EfficientNet was singled out for its scalable, resource-efficient design that calibrates the compromise between model compactness and precision. Meanwhile, ResNet was selected owing to its residual pathways, which counteract the vanishing gradient problem, thus enabling the construction of deeper networks with superior feature learning capacity. Overfitting constitutes a serious impediment when training CNNs on modestly sized datasets, as the network tends to memorize training examples rather than extracting broadly applicable patterns. Supplementing data augmentation, early halting was applied to mitigate overfitting, and a callback routine was activated to recover the model state exhibiting the lowest validation error during the training run.
In judging the capability of segmentation and classification models, it is indispensable to draw on precisely formulated metrics to gauge the correctness and dependability of the outcomes. For both segmentation and classification assignments, the confusion matrix serves alongside derived indicators that include accuracy, precision, recall, and F1 score. The data pool was divided into training, validation, and testing slices sized at 70%, 15%, and 15%, respectively. Model fitting was performed with a batch size of 32, across 50 epochs, and a learning rate of 10−4. A suite of general performance gauges was brought to bear to holistically appraise the model's forecasting capacity, encompassing accuracy, precision, recall, and the F1 score. These gauges illuminate the model's overall correctness, its proficiency at picking out relevant cases, and the equilibrium between precision and recall.
Beyond these conventional gauges, extra evaluative criteria were embedded to seize particular dimensions of model behavior. These took in the Intersection over Union (IoU) for segmentation, which measures the spatial congruence between predicted and ground-truth zones; the Area Under the Curve (AUC) for classification, which captures the interplay of true positive and false positive proportions over a sweep of decision cutoffs; and the confusion matrix, supplying an itemized account of classification results by enumerating true positives, false positives, true negatives, and false negatives.
To deliver a trustworthy appraisal of the classification architectures, the k-fold cross-validation method was instituted to assess model behavior. The dataset was partitioned into k evenly sized chunks (10-fold), and each architecture underwent training and assessment in rotation across every fold. This study settled on 10-fold cross-validation to strike an appropriate equilibrium between bias and variance, supplemented by 5 repetitions to dampen the randomness inherent in performance estimation. This routine yielded k performance readings per model, spanning accuracy, precision, recall, and F1 score. The averaged figures furnished a robust indication of model effectiveness while lessening the prejudice tied to any single train-test partition. Repeated k-fold cross-validation was carried out to heighten dependability, incorporating data reshuffling across repetitions. This scheme enabled the capture of variability arising from differing data sequences, resulting in a richer appreciation of model consistency and trustworthiness. Performance indicators were documented for each run or fold, and statistical descriptors, including mean, standard deviation, and confidence intervals, were derived. These descriptors cast light on the models' stability and dispersion. The performance metrics gathered across folds and repetitions underwent statistical significance testing to contrast models. The Friedman test, accompanied by Nemenyi post-hoc analysis, was utilized for comparisons involving multiple models.
The segmentation outcomes showcase the capacity of the models to isolate the region of interest within the image collection. Table 1 recaps the inference results of the segmentation architectures at their best-performing dataset settings. As shown in Table 1, the U-Net++ design reached the top accuracy of 98.56% along with the highest IoU of 97.54%, reflecting its strength in capturing fine-grained elements in the data. The baseline U-Net likewise delivered very strong results, registering an accuracy of 97.99%, whereas Inception U-Net posted an accuracy of 95.78%. This could signal a tendency toward overfitting or diminished capacity to generalize to unseen samples. Although performing decently with an accuracy of 96.59%, the Recurrent U-Net registered a marginally elevated validation loss of 0.0564, hinting that the recurrent components may have injected complexity that calls for further tuning. Nonetheless, the gaps in validation loss were not especially large. Inference time was measured on Intel W73565X and NVIDIA RTX 6000 Ada hardware.
Table 1. Best inference results attained by each segmentation model.
Architecture | Inference time | Validation loss | IoU | F1 score | Recall | Precision | Accuracy |
U-Net | 0.18 s | 0.0530 | 96.68% | 98.31% | 98.10% | 98.52% | 97.99% |
U-Net++ | 0.21 s | 0.0547 | 97.54% | 98.76% | 98.84% | 98.67% | 98.56% |
Recurrent U-Net | 0.15 s | 0.0564 | 94.33% | 97.08 % | 94.9% | 99.27% | 96.59% |
Inception U-Net | 0.24 s | 0.0510 | 93.00% | 96.37% | 95.34% | 97.42% | 95.78% |
Given the leading accuracy exhibited by U-Net++, the segmented outputs produced by this model served as the input source for the classification stage. This design choice sought to gauge how well classification models could reliably tell apart the different calcium deficiency states in lettuce, highlighting the interplay between segmentation and classification in recognizing and sorting these conditions.
Figure 6 places side by side the raw image, the ground truth mask, and the mask forecasted through the U-Net architecture. The side-by-side view illustrates the model’s proficiency in accurately marking out the target zones, with the predicted mask closely mirroring the ground truth. Even where the ground truth masks may lack flawless pixel-level exactness, the segmentation models prove their sturdiness by correctly spotting and contouring the bounds of the target areas, including instances where hand-drawn segmentation may be imperfect.
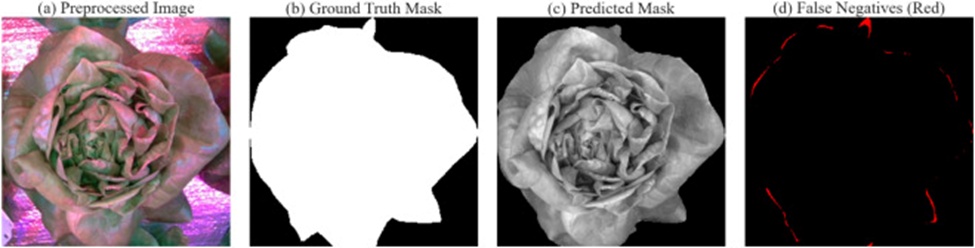
Figure 6. Side-by-side view of (a) pre-processed image, (b) ground truth mask, (c) predicted mask, and (d) false negative zones of the prediction (Red), employing U-Net++ for segmentation.
This segment offers a thorough appraisal of the classification architectures, centering on performance indicators and principal observations. Table 2 lays out the inference results for every classification design according to the chosen performance measures. The Receiver Operating Characteristic (ROC) curve alongside the AUC score, both featured in Table 2, constitute tightly linked indicators applied to judge the effectiveness of classification models within machine learning.
Table 2. Inference results of each classification model across the four differently pre-processed data collections (original, CLAHE, RCC, CLAHE+RCC).
__ | CNN architecture | ROC/AUC | F1 score | Recall | Precision | Accuracy |
Original | Resnet-50 | 91.3% | 90.9% | 91.3% | 90.8% | 90.2% |
__ | EfficientNetB2 | 89.6% | 88.5% | 88.6% | 88.4% | 89.3% |
__ | EfficientNetB3 | 87.7% | 86.3% | 84.5% | 85.2% | 85.2% |
CLAHE | Resnet-50 | 92.0% | 89.5% | 89.2% | 90.0% | 91.1% |
__ | EfficientNetB2 | 92.8% | 90.7% | 90.8% | 91.8% | 89.3% |
__ | EfficientNetB3 | 88.1% | 87.8% | 85.7% | 87.6% | 87.5% |
RCC | Resnet-50 | 92.0% | 90.5% | 90.2% | 91.0% | 91.2% |
__ | EfficientNetB2 | 92.2% | 90.7% | 90.8% | 90.7% | 91.5% |
__ | EfficientNetB3 | 88.8% | 86.5% | 86.7% | 86.6% | 86.2% |
CLAHE + RCC | Resnet-50 | 91.4% | 89.8% | 89.5% | 90.8% | 90.6% |
__ | EfficientNetB2 | 89.5% | 85.8% | 85.6% | 85.1% | 84.4% |
__ | EfficientNetB3 | 90.7% | 86.3% | 86.5% | 87.2% | 88.4% |
To gauge the effect of distinct pre-processing regimens on model behavior, the investigation trialed the classification architectures on four data collections: the raw unaltered set and sets pre-processed via CLAHE, RCC, and a blend of CLAHE with RCC. Across the architectures evaluated, ResNet-50 reliably produced the strongest outcomes on every dataset, with its accuracy climbing from 90.2% on the raw set to 91.18% on the RCC-treated set, the top mark recorded under any condition. Likewise, EfficientNetB2 attained its peak accuracy of 91.5% on the RCC-treated collection, signaling that RCC boosted the model’s capacity to categorize calcium deficiency states. By contrast, EfficientNetB3 displayed greater fluctuation across datasets, reaching its best accuracy of 88.39% on the fused CLAHE+RCC collection. Still, its showing on the RCC-treated set (86.2%) fell below that of the competing models, implying that its design may be less compatible with particular pre-processing approaches. Though pre-processing broadly lifted performance, fusing CLAHE with RCC did not uniformly surpass the individual methods. As a case in point, both ResNet-50 and EfficientNetB2 registered somewhat lower accuracies on the CLAHE+RCC collection relative to the RCC or CLAHE collections used in isolation.
Table 3 illustrates the K-fold cross-validation executed on the RCC dataset employing 5 repeats. The inference accuracy per fold is given as a mean score and confidence interval derived from five repetitions. The k-fold cross-validation findings, as displayed in Table 3, reveal the steady edge held by EfficientNetB2 across the majority of folds, securing the top accuracy in six of the ten folds. Its accuracy spans from 85.73% up to 93.87%, pointing to resilience and dependability over varying data splits. ResNet-50 trails narrowly, putting up competitive numbers in several folds and even outdoing EfficientNetB2 in Fold 1 (93.87% vs. 92.67%), Fold 2 (91.60% vs. 90.00%), and Fold 5 (89.33% vs. 87.33%). This implies that ResNet-50 represents a robust alternative, delivering steadier output with accuracies spanning 86.53% to 93.87% across most folds. EfficientNetB3, nevertheless, trails the other two architectures in the majority of folds, its accuracy fluctuating from 81.07% to 87.07%. Although it puts up some respectable performances in Fold 3 (87.07%) and Fold 10 (86.04%), its aggregate showing is considerably weaker, suggesting it may be less fitting for this sorting assignment. On balance, the cross-validation indicates dependable behavior from the chosen models.
Table 3. Accuracy with confidence intervals from K-fold cross-validation over 5 repeats.
Fold | ResNet-50 (%) | EfficientNetB3 (%) | EfficientNetB2 (%) |
1 | 93.87 ± 0.64 | 86.80 ± 1.40 | 92.67 ± 1.65 |
2 | 91.60 ± 2.05 | 81.73 ± 2.36 | 90.00 ± 1.98 |
3 | 90.67 ± 1.37 | 87.07 ± 1.88 | 93.87 ± 0.87 |
4 | 84.93 ± 0.67 | 81.33 ± 1.98 | 85.73 ± 0.32 |
5 | 89.33 ± 1.24 | 80.80 ± 1.20 | 87.33 ± 0.92 |
6 | 90.53 ± 0.76 | 83.33 ± 2.23 | 90.67 ± 2.07 |
7 | 86.53 ± 1.77 | 81.47 ± 1.91 | 86.80 ± 2.12 |
8 | 89.73 ± 2.43 | 81.07 ± 1.58 | 90.53 ± 1.12 |
9 | 92.00 ± 2.07 | 86.00 ± 1.70 | 92.13 ± 0.76 |
10 | 90.34 ± 1.35 | 86.04 ± 1.21 | 91.95 ± 1.02 |
The Friedman test, coupled with the Nemenyi post hoc procedure, was applied to assess the statistical meaningfulness of the detected performance gaps across models through k-fold examination. Table 4 displays the findings, shedding light on the validity and relative ordering of the classification architectures. The Friedman test yielded a test statistic of 15 paired with a P-value of 0.000553, denoting statistically meaningful discrepancies in the performance ranks spanning the cross-validation folds. A Nemenyi post-hoc investigation was undertaken to probe these gaps more deeply and scrutinize central pairwise contrasts. The analysis uncovered no statistically meaningful gap between ResNet-50 and EfficientNetB2 (P = 1.000), signaling equivalent effectiveness in categorizing calcium deficiency states. In contrast, meaningful gaps were detected between ResNet-50 and EfficientNetB3 (P = 0.002) as well as between EfficientNetB2 and EfficientNetB3 (P = 0.002). These outcomes indicate that EfficientNetB3 performs substantially worse than both ResNet-50 and EfficientNetB2.
Table 4. Friedman test alongside Nemenyi post-hoc analysis.
Friedman test statistics = 15 | |||
P-value: 0.000553 | |||
0 | 1 | 2 | |
0 | 1.00 | 1.00 | 0.002296 |
1 | 1.00 | 1.00 | 0.002296 |
2 | 0.002296 | 0.002296 | 1.00 |
Note: 0 designates the ResNet-50 group, 1 designates the EfficientNetB2 group, and 2 designates the EfficientNetB3 group.
To summarize, ResNet-50 and EfficientNetB2 stood out as the leading architectures, showing comparable classification prowess. Conversely, EfficientNetB3 displayed markedly inferior accuracy, positioning it as the least capable of the trio. Across the folds, these outcomes emphasize the reliability of ResNet-50 and EfficientNetB2 for this sorting challenge while pinpointing potential refinement opportunities within EfficientNetB3 to bolster its capability.
An explainability analysis was performed employing Gradient-weighted Class Activation Mapping (Grad-CAM), following recommendations by Selvaraju et al. [29]. This visualization method produces heatmaps that pinpoint the most decisive image regions steering the model’s outputs, as depicted in Figure 7. The heatmaps created for ResNet-50 repeatedly exhibited strong explanatory power. The highlighted patches were predominantly centered on the lettuce, signifying that the model reliably homes in on the plant when forming classification judgments. This correspondence between the heatmaps and the target entity backs the high accuracy achieved by ResNet-50, hinting that its predictions are both correct and interpretable. Correspondingly, the heatmaps for EfficientNetB2 uncovered a differing emphasis within the pictures. Though some overlap existed with the zones accentuated by ResNet-50, the focal areas were less uniform, occasionally spilling beyond the principal regions of interest. Despite this, EfficientNetB2 attained competitive accuracy, suggesting that its decision logic, albeit less polished, stayed partly consistent with the target attributes. The heatmaps for EfficientNetB3, on the other hand, showed weak interpretability. The highlighted patches were frequently disconnected from the lettuce, with sizable portions of the heatmaps lying beyond the plant’s boundary. This implies that EfficientNetB3 has difficulty locking onto the key traits tied to calcium deficiency states, leading to diminished accuracy and weaker performance relative to the other architectures.
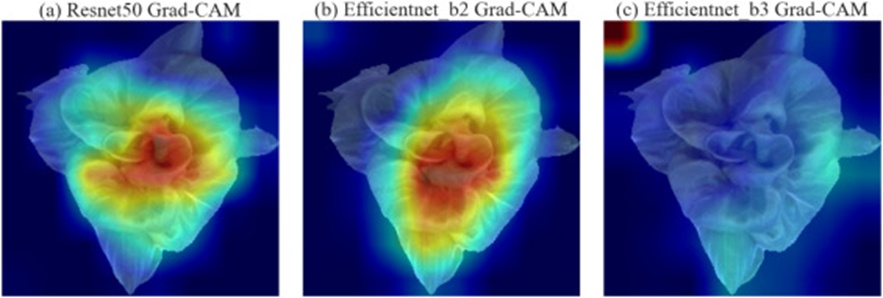
Figure 7. Grad-CAM visualization for model explainability: Contrast of (a) ResNet50, (b) EfficientNetB2, and (c) EfficientNetB3 in emphasizing salient lettuce features.
Notably, when focusing on the particular zone of observable tip-burn marked by the red rectangle in Figure 8a, ResNet50 reveals a powerful and tightly confined emphasis on the symptomatic patch, highlighting its knack for zeroing in on crucial calcium-deficiency-linked markers. EfficientNetB2 likewise registers the tip-burn zone, though its attention stretches more diffusely across the lettuce foliage. In contrast, EfficientNetB3 does not reliably spotlight the tip-burn zone and instead diverts focus toward areas unassociated with the visible symptom. This mismatch further tallies with each model’s respective accuracy figures, demonstrating how precise localization of the symptomatic zone can be pivotal to securing dependable predictions.
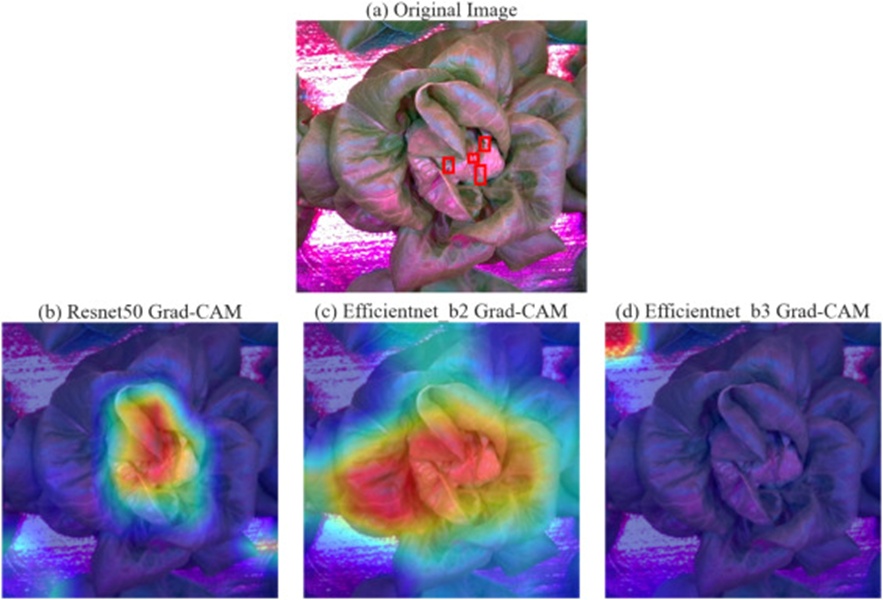
Figure 8. Grad-CAM visualization for tip-burn identification: (a) Raw Image with discernible tip-burn symptom outlined in red boxes, (b) Resnet50, (c) EfficientNetB2, and (d) EfficientNetB3.
Taken together, the explainability investigation accentuates the sturdiness of ResNet50, whose focus tightly matches the intended zones of interest. EfficientNetB2 exhibits a degree of alignment yet lacks the exactness evident in ResNet50, whereas EfficientNetB3′s attention is largely misdirected, mirroring its poorer results. These observations underscore the value of interpretability in model assessment, delivering understanding into the advantages and shortcomings of each design.
The outcomes of this investigation reveal the differing degrees of success achieved by deep learning architectures across both segmentation and classification assignments aimed at the prompt spotting of calcium shortage in lettuce reared under colored LED illumination. U-Net++ stood out as the most capable architecture for the segmentation phase, generating outputs of high precision that eased the subsequent classification step. The pairing of precise segmentation with robust classification models brings into focus the value of harnessing complementary architectural designs to boost detection capability. The work also showed that pre-processing operations, most notably RCC, can lift model accuracy—especially for EfficientNet-based designs—by sharpening image fidelity and feature separability under the colored LED lighting typical of indoor cultivation setups. The bulk of earlier investigations has not documented how image pre-processing affects model outcomes. Moreover, those images were commonly captured in glasshouses under sunlight or broad-spectrum lamps. The present study scrutinized model behavior beneath high-intensity LED lighting that incorporated modest proportions of green, blue, and far-red bands. Despite this demanding lighting environment, the top accuracy (91.5%) posted by the best-performing model (ResNet50) stands up well against earlier reports of 92.50% with ResNet18 [13], 92.4%–95.5% with FPGA [16], and 99.9% with ShuffleNet [14]. That said, most previous work has not put its models through testing across heterogeneous data pools via cross-validation procedures. By contrast, the current study confirms the resilience of the proposed model through cross-validation, registering a mean accuracy around 90% and a peak result of 93.87%. Furthermore, earlier research has tended to examine blended nutrient deficiency markers, whereas calcium (Ca) shortage proves considerably more elusive to pinpoint than shortages of macronutrients like nitrogen (N), phosphorus (P), and potassium (K). As an illustration, Pandey et al. [18] drew on features derived from hyperspectral imagery within PLSR models and noted strong predictive power for N (R² = 0.88), P (R² = 0.74), K (R² = 0.69), and S (R² = 0.64). Even so, the model's showing for Ca was markedly weaker (R² = 0.24), throwing into relief the particular obstacles tied to identifying calcium shortage.
ResNet50 repeatedly surfaced as the most dependable classification architecture, not only logging high accuracy but also delivering superior explainability through Grad-CAM visual outputs. Its heatmaps concentrated on the lettuce itself, signaling that the model successfully zeroed in on pertinent image features, a pattern consistent with its strong results. Along similar lines, EfficientNetB2 performed on a competitive level, exhibiting focal zones that partly overlapped with those of ResNet50, though its attention occasionally spilled outside the target boundaries. On the other hand, EfficientNetB3 struggled both in accuracy and in interpretability, with its heatmaps frequently landing on irrelevant zones, which points to trouble in latching onto the key traits that mark calcium deficiency.
Notwithstanding the encouraging outcomes, this study encountered a set of hurdles and constraints that point to directions for subsequent refinement. The segmentation and classification models were trained and tested within tightly managed microclimate settings on pre-processed data variants (e.g., CLAHE, RCC, or the raw dataset). When confronted with images drawn from a differently pre-processed collection or captured under altered circumstances, the models yielded outputs that verged on random, which echoes the observations of other researchers [30]. This behavior hints at a shortfall in generalizability, which curtails the models’ usability in real-world contexts where image capture conditions can swing widely. Additionally, the imaging viewpoint (that is, the angle and stance from which photographs are taken) turned out to play a pivotal part in model performance. The models lean heavily on steady visual signals, meaning that shifts in the viewpoint or orientation of lettuce specimens can become a source of confusion. This reliance can chip away at accuracy, as has been noted in comparable studies by Haggag et al. [31] and Silva et al. [32]. Such dependence on particular shooting circumstances indicates that the models may have trouble adapting to the varied imaging settings commonly found in hydroponic installations operating under LED lighting.
In this work, calcium shortage was inferred from treatment assignments; nonetheless, the true nutritional status may diverge due to an array of factors, such as shifts in the indoor microclimate, lighting regimes, and other biological characteristics. Model capability could be further bolstered by verifying calcium levels through destructive tissue assays, which would enable a tighter linkage between the presumed deficiency or toxicity imposed by the treatments and the actual nutrient loads within plant tissues. To tackle this shortcoming, bringing in in-depth imagery could serve as a worthwhile upgrade. Depth data holds considerable promise for supplying an extra layer of spatial context, equipping models to better grasp the three-dimensional arrangement of lettuce plants. This notion is backed by earlier investigations, such as that of Akhtar et al. [33], which reported parallel gains when depth imagery was folded into machine vision pipelines, thereby sharpening plant phenotyping estimates.
Such a step could soften the difficulties posed by differing perspectives and lift the sturdiness and transferability of the models across heterogeneous datasets and imaging settings. These constraints underline the necessity for more varied data pools and upgraded imaging methods to guarantee the models can deliver trustworthy performance in a range of practical deployments. Future inquiry should concentrate on weaving in multimodal inputs, depth images included, to craft models that are more flexible and less sensitive to changes in imaging conditions.
The results of this study carry meaningful consequences for operational hydroponic installations. The proven capacity of deep learning frameworks, most notably ResNet-50 and U-Net++, to reliably flag calcium deficiency states supplies a groundwork for building automated surveillance tools within indoor hydroponic lettuce enterprises. Such tools could pick up nutrient insufficiencies at an early stage, enabling cultivators to undertake corrective steps before major harvest losses set in. By embedding these models into hydroponic workflows, growers stand to attain finer nutrient stewardship, curtail wastage, and secure steady crop quality. Pre-processing maneuvers like RCC can additionally bolster system dependability under fluctuating imaging circumstances, including richly colored lighting, thereby rendering these solutions versatile across varied environments. Beyond that, heightened efficiency in handling calcium shortages can feed into broader food security by streamlining production operations and lowering the odds of crop failure in hydroponic ventures.
Forecasting crop stress, exemplified by calcium shortage, stands as a pivotal element for advanced cultivation approaches such as indoor agriculture. This work showcased the capability of deep learning architectures to spot calcium deficiency in lettuce via segmentation and classification pipelines. U-Net++ and ResNet-50 proved to be the most trustworthy models, attaining elevated accuracy and clear interpretability. The accuracy and F1 score logged by ResNet50 with RCC reached 91.5% and 90.7%, respectively. Cross-validation produced a model accuracy surpassing 90%, with a top mark of 93.87%. The superior showing of ResNet50 was further corroborated through supplementary Grad-CAM analysis. Still, the models displayed sensitivity toward particular pre-processing methods, dataset properties, and imaging angles, spotlighting the requirement for more diverse data collections and added features, such as depth cues or infrared capture, to strengthen generalizability.
These discoveries lay a sturdy platform for devising automated solutions that refine nutrient control in hydroponics, thereby aiding sustainable food output. This investigation underscores the promise of fusing advanced segmentation and classification methodologies to tackle key hurdles in indoor cultivation beneath artificial light. Even so, upcoming efforts should direct attention toward elevating dataset richness, probing alternative architectures, and appraising system behavior under authentic field settings to unlock the full advantages of these technologies.
The authors sincerely thank Keysight Technologies for the generous support of this research through gift funding. This financial support played a crucial role in facilitating the development and implementation of this study.
None
KeySight Technologies funded the project as Gift support to the Controlled Environment Engineering Lab at UC Davis.
None
Open Access The author(s) retain copyright. This article is licensed under the Creative Commons Attribution-NonCommercial-ShareAlike 4.0 International License. It may be shared and adapted for non-commercial purposes with appropriate attribution, an indication of changes, and distribution of adaptations under the same license. Third-party material may be subject to separate terms identified in its credit line. View the license at https://creativecommons.org/licenses/by-nc-sa/4.0/.
 Agro Intelligence Research Press