The surveillance of poultry movement patterns is an essential diagnostic tool for welfare evaluation, yet manual monitoring routines impose considerable temporal demands and physical strain, particularly in high-density flocks. Inadequately trained personnel may additionally fail to recognize subtle shifts in behavioral intensity, thereby overlooking critical windows for prophylactic intervention and remedial action. The present work merges conventional camera-based observation with a sophisticated automated recognition architecture to classify diverse broiler conduct within commercial housing. Deployment of a two-stage deep learning pipeline occurs as follows: initial detection localizes individual birds, followed by identification of five principal anatomical landmarks (cranial region, ventral region, bilateral limbs, and caudal appendage). From these points, a skeletal framework anchored in the ventral region is generated, yielding six angular measurements via trigonometric computations. A long short-term memory network subsequently processes these angular sequences, estimating the likelihood across behavioral categories encompassing “Standing”, “Walking”, “Resting”, “Eating”, “Preening”, and “Flapping”, with the highest-probability classification retained. To quantify the temporal distribution between stationary and dynamic states, a cascaded fuzzy-logic inference architecture was implemented, providing a resilient assessment of overall activity magnitude. Validation conducted within a mixed-gender rearing facility demonstrated that the proposed methodology attained performance floors of 85.2% for broiler categorization, 79.2% for anatomical landmark localization, and 50.8% for behavioral classification accuracy. Activity-level determinations generated by the system were consistent with evaluations by veteran poultry husbandry specialists.
The advancement of on-farm animal welfare standards has coalesced into an international priority, compelling poultry producers to abandon restrictive battery-cage configurations in favor of more welfare-conscious alternatives such as floor-based rearing, free-range access, and structurally enriched enclosures. Such husbandry paradigms afford birds ample space for ambulation, thereby attenuating environmental stressors and potentially elevating oviposition rates [1]. Refinements in both welfare protocols and managerial interventions have been empirically linked to enhancements in poultry product quality and output volume, thereby bolstering long-term operational sustainability [2, 3]. A substantial contingent of industrialized nations has codified legislative frameworks and instituted trade-related instruments to safeguard welfare benchmarks throughout poultry production chains [4-7]. Adoption of semi-open housing configurations can curtail egg production expenditures while simultaneously diminishing the prevalence of musculoskeletal pathologies among flocks [8].
Behavioral manifestations during periods of heightened activity provide early prognostic indicators of emerging issues in poultry housing environments [9-11]. Systematic observation of avian behavior is indispensable for timely anomaly detection [12]; nonetheless, while periodic veterinary examinations remain foundational, reliance on them as the exclusive modality for welfare and health surveillance is inadvisable. Gallinaceous species that have evolved to occupy a prey niche possess an innate proclivity to mask the clinical manifestations of pathology or trauma until compensatory mechanisms fail. This circumstance mandates protracted and meticulous longitudinal scrutiny of diurnal behavioral repertoires [13]. At the juncture where pronounced health deterioration becomes externally apparent, the underlying condition may have already progressed to an advanced and potentially intractable stage.
The behavioral ethology of animals is highly intricate, characterized by stereotyped sequences and action patterns with defined temporal architecture [14]. Accordingly, animal husbandry personnel necessitate targeted instruction to discern indicators of somatic or behavioral deviation among their charges. Such systematic observational protocols impose substantial chronometric demands. This burden intensifies appreciably when the objective is to quantify shifts in fundamental activity modalities, including ingestive behavior, locomotion, stationary upright posture, quiescence, plumage maintenance, and wing-generated propulsion. Inter-observer variability attributable to subjective appraisal further compounds this challenge, introducing inconsistencies across datasets. Moreover, the ergonomic necessity for personnel to repeatedly adopt flexed or crouched postures to facilitate close-proximity inspection renders the undertaking physically taxing and inherently susceptible to oversight. This methodological approach becomes demonstrably impracticable within expansive commercial poultry enterprises where regimented behavioral auditing constitutes an operational imperative.
The affixation of multiple kinematic sensor assemblies to anatomically defined loci upon a living organism permits high-fidelity postural quantification [15, 16]. The resultant telemetry data undergo algorithmic processing via machine learning classifiers to disambiguate an array of biological motor patterns [17, 18]. However, these externally mounted sensor packages are subject to repetitive pecking-directed interference or complete detachment by the subjects themselves. Compounding this limitation, the inherent environmental complexity of production settings predisposes sensor elements to moisture ingress, leading to spurious or aberrant signal outputs. The recurrent need to replace galvanic cells further imposes non-trivial labor costs.
Deployment of IP camera systems enables poultry husbandry operators to remotely monitor flock activity, substantially reducing the need for direct human entry into production biosecurity zones. Such imaging apparatuses are conventionally mounted in overhead ceiling positions within poultry housing infrastructure and are integrated with automated image-acquisition scheduling. The captured videographic records undergo computational analysis through digital image processing methodologies to derive quantitative indices of broiler activity intensity [10, 19-21]. In conjunction with machine learning paradigms, this analytical framework extends to the discrimination of specific behavioral presentations, exemplified by gait asymmetry consistent with lameness [22, 23].
Notwithstanding the capacity of computer vision methodologies to spatially resolve anatomically critical body regions, practical deployment is constrained by the inherent complexity of hand-engineered feature representation. However, concomitant advances in computational throughput have established deep learning as a demonstrably efficacious approach for expeditious poultry detection within imagery and the subsequent localization of key anatomical landmarks, alongside behavioral categorization spanning standing, ambulation, running, ingestion, quiescence, and plumage maintenance [13, 24, 25]. Ongoing investigative efforts encompass the acquisition of multi-angular imagery capturing disparate anatomical regions of the subject, with deep neural architectures subsequently employed to reconstruct the three-dimensional postural configuration of individual broiler specimens [26].
Long short-term memory (LSTM) architectures exhibit particular aptitude for temporal sequence modeling, demonstrating efficacy in extracting semantically salient features from ordered data streams, a capability previously harnessed to facilitate human pose estimation and activity classification tasks [27]. When architecturally integrated with deep convolutional neural networks, such systems achieve robust identification of critical body-point coordinates in broilers and enable automated detection of gait deviations [28]. To date, scholarly attention has only sparingly been directed toward the systematic analysis of behavioral bout duration and recurrence frequency as metrics for holistic activity-level determination in poultry. The inherent instability of ambient illumination conditions characteristic of naturally lit or naturally supplemented housing environments further warrants explicit methodological consideration, particularly during temporal windows coinciding with elevated broiler motor activity.
Fuzzy logic, introduced by Zadeh [29], addresses problems characterized by ambiguous boundaries in qualitative understanding and experiential knowledge by applying approximate reasoning to infer plausible outcomes from imprecise premises. Its applications span diverse domains, including reducing false-positive alerts in dairy cattle health surveillance [30], evaluating thermal stress intensity [31], and classifying behavioral states in avian livestock [32, 33]. Hierarchical multi-fuzzy logic controllers have demonstrated considerable utility in complex decision-making contexts by decomposing elaborate systems into layered architectures, thereby governing decisions amid uncertainty [34, 35]. Drawing on expert-derived insights, models for multi-criteria decision analysis are engineered to accommodate the substantial computational loads inherent in real-time processing. Originating in fuzzy set theory, this methodology parallels conventional fuzzy controller design while distinguishing itself by isolating influential decision-driving variables and routing them through supplementary fuzzy inferential stages.
The present investigation concentrates on quantifying the activity intensity of broilers, defined as chickens cultivated specifically for meat yield, whose behavioral repertoires bear directly upon production efficiency and physiological condition. Deep learning architectures, in conjunction with LSTM networks, are employed to decode diverse postural configurations, while a two-tiered fuzzy inference framework is operationalized for activity-level appraisal. The structural configuration of the proposed poultry activity assessment system is schematically depicted in Figure 1. Video capture devices capture broiler movements, and subsequent processing via dual-phase deep learning models extracts whole-bird centroid coordinates and five principal anatomical landmarks from sequential image frames, thereby assembling a skeletal representation and computing postural angles. The compiled angular sequence data are fed into a trained LSTM classifier to disambiguate broiler behavioral states. Ultimately, a cascaded dual-layer fuzzy inference architecture (FLIs) derives activity-level estimations from the spectrum of behaviors exhibited over a defined temporal window and their respective durations.
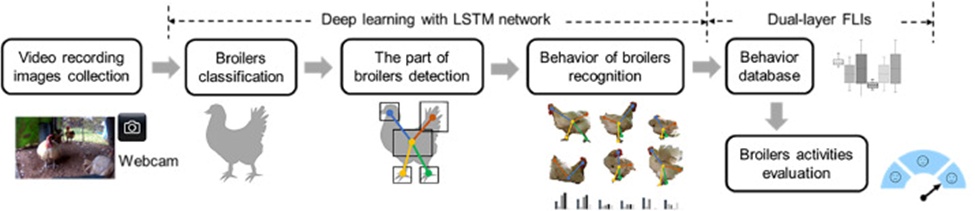
Figure 1. Schematic of the proposed broiler posture and activity evaluation scheme.
The structural arrangement of this paper proceeds as follows: the methodology describes poultry postural categories and details the engineering of the two deep learning frameworks and the dual-tier FLIs for anatomical landmark identification, behavioral classification, and activity intensity evaluation in broilers. The experimental section presents the study configuration and outcomes, including data provenance and aggregation, empirical validation procedures, and an interpretive discussion. Finally, the principal findings and conclusions of the study are consolidated and summarized.
Prevalent poultry postural configurations have been formally characterized, including standing, ambulation, feeding, resting, plumage grooming, and wing-propelled flapping. Human observers assign these postural categories through visual assessment, associating specific motor patterns with each posture. By way of illustration, the absence of observable movement indicates standing (Figure 2a); lower limb displacement signifies ambulation (Figure 2b); head extension into the feeding apparatus denotes ingestion (Figure 2c); crouched ground contact corresponds to resting (Figure 2d); directed pecking at feather surfaces and wing extension are classified as preening (Figure 2e) and wing flapping (Figure 2f), respectively. Given that avian mobility is principally gauged through articular motion, key anatomical loci—namely the head, caudal region, limbs, and trunk—are pinpointed. Interconnecting these points yields a skeletal framework representative of the chicken’s articulations. Background elements are deliberately excluded from this model to concentrate analytical attention exclusively upon postural configuration.
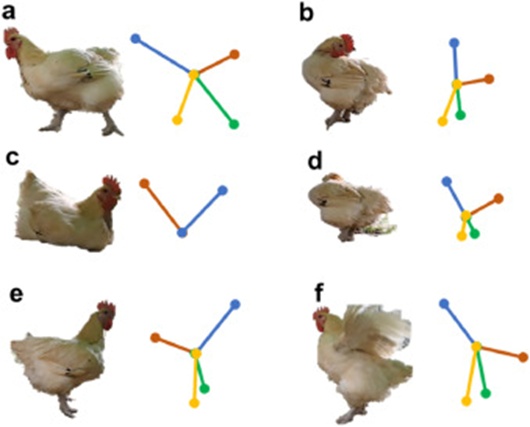
Figure 2. Behavior and skeletal structure of chickens. The left side shows the external appearance of chicken activities (walking (a), preening feathers (b), resting (c), eating (d), standing (e), and flapping wings (f)). In contrast, the right side displays the skeletal model.
In the initial phase, two separate deep learning models are deployed for broiler detection and landmark localization. Deep neural architectures, pervasively adopted for image classification tasks, exploit the principle of convolution over spatially constrained receptive fields, thereby circumventing the computationally intensive operations characteristic of conventional neural networks. The ‘You Only Look Once’ (YOLO) framework, developed by Joseph Redmon and collaborators in 2006, performs single-pass image processing to precisely determine both the spatial coordinates and the object categories. This technique has since been widely deployed across numerous domains and has undergone successive versions tailored to diverse investigative requirements. The YOLO architecture continues to be predominantly composed of convolutional layers, rectified linear units, pooling operations, and densely connected layers. The fourth iteration, designated YOLO v4, augments the feature fusion mechanisms of its predecessor YOLO v3, achieving marked improvements in detection fidelity without incurring disproportionate computational overhead [36]. The detection pipeline employs CSPDarknet53—incorporating convolution, batch normalization, mish activation functions, and cross stage partial ResNet (CSPResNet) modules—as its backbone for feature map extraction; feature integration is accomplished through spatial pyramid pooling (SPP) [37] in conjunction with a path aggregation network (PANet) [38]; the detection head, tasked with category prediction and bounding box regression, adheres to the dense prediction (single-stage) paradigm established by YOLO v3. Non-maximum suppression (NMS) eliminates redundant bounding box proposals and isolates the optimal candidate [39]. The structural composition of YOLO v4, building upon the YOLO v3 foundation, is depicted in Figure 3.
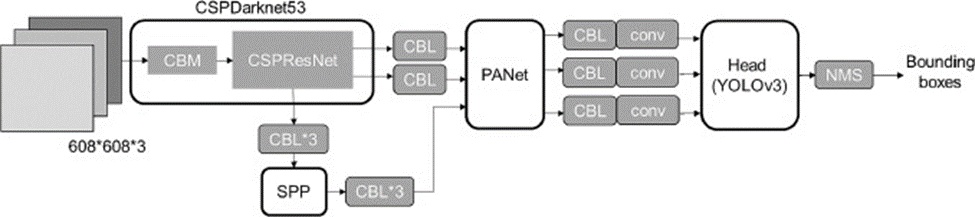
Figure 3. Architecture of the YOLO v4 model, featuring smaller modules such as CBM, which combines convolution (conv), batch normalization, and Mish activation; CBL, integrating conv, batch normalization, and Leaky ReLU activation.
Within this study, imagery of chickens captured in the designated area undergoes sequential processing by two YOLO v4 models to detect individual birds and their constituent body regions, facilitating the assembly of a skeletal framework and the computation of inter-skeletal angular relationships. Five principal anatomical regions are delineated: head, trunk, tail, left limb, and right limb, with their respective centroids positioned at the ocular region, body center, distal hindlimb, and caudal plumage. These centroids are linked to the trunk center to formulate the broiler’s skeletal representation, as portrayed in Figure 4. Critically, this skeletal construct permits precise angular calculation θi (i=1,2,…,N) under conditions where anatomical landmarks remain visible and unobstructed. By gauging distances separating the ocular point, trunk centroid, distal hindlimb, and caudal feathers, and subsequently applying the law of cosines, the angles subtended between skeletal segments are derived. To illustrate, the spatial coordinates of the head, trunk, and tail—denoted as points C, A, and B, respectively—enable the computation of θ1 as specified in (1).
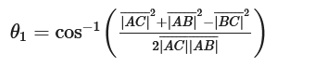 (1)
(1)
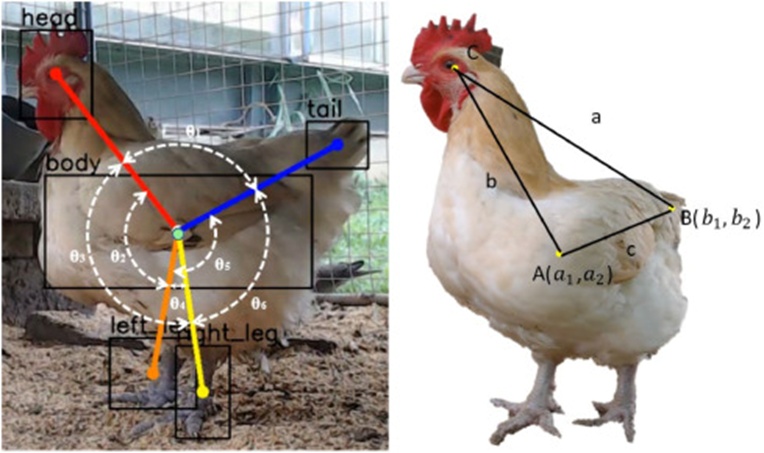
Figure 4. Skeletal structure of the chicken and its angle definitions. Skeletal model (left) and angle measurement (right side).
Thereafter, broiler behavioral states, denoted as “beh”, are characterized by angular distributions corresponding to each postural configuration, mapping to Standing (S), Walking (M), Eating (E), Resting (R), Preening (P), or Flapping (W). The permissible angular interval for each behavior is specified as < < , wherein ‘max’ and ‘min’ signify the upper and lower bounding values, respectively. Subsequently, a behavioral classification model is formulated using an LSTM architecture (Figure 5). LSTM alleviates the vanishing gradient problem encountered during prolonged gradient descent training. This property renders it particularly well-suited for modeling extended-duration activity sequences and capturing temporal interdependencies within sensor-derived data streams.
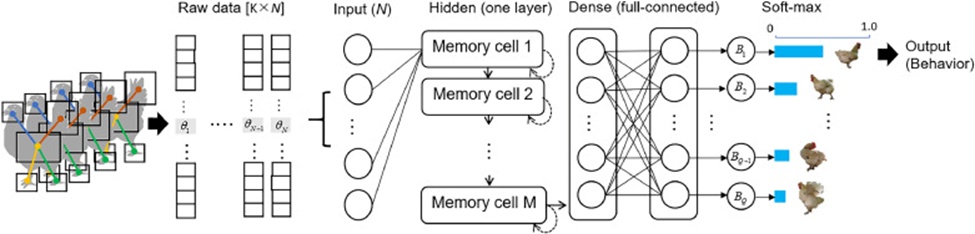
Figure 5. LSTM network architecture. The input layer consists of N neurons that process raw data over sequential time steps. The hidden layer comprises M memory cells, each containing K hidden units. The dense layer receives the output matrix from the M-th memory cell layer. The output layer performs a softmax operation to produce a probability distribution across Q possible outcomes.
The network architecture processes uninterrupted streams of joint angle measurements captured across varying broiler body configurations, feeding these temporal sequences into the LSTM for behavioral state prediction. A probability score is assigned to each candidate behavioral class, with the softmax mechanism ultimately singling out the class associated with the maximal probability to serve as the definitive classification (Figure 5). Each constituent LSTM block is built from cell assemblies, wherein every assembly encloses a collection of storage elements operated upon by gating structures. These gating modules exercise selective regulation over signal passage, thereby conserving antecedent-state representations and guarding against the erosion of stored content [27].
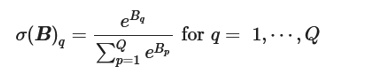
A standard LSTM configuration features an input stage populated with N neuronal units that receive a matrix of input observations sized U×N, encoding U collections of angular measurements. The hidden processing tier may be arranged into several successive strata, with each stratum comprising M memory cells, each cell incorporating K concealed storage nodes, satisfying the constraint U = K. Activations emanating from these hidden strata are routed to a densely connected layer interfaced with Q output neurons, expressed formally as B = (B1, B2, …, BQ) ∈ RQ, where Q ≥ 1. The raw network outputs are transformed via a softmax mapping σ:RQ↦(0,1)Q, producing a normalized probability vector spanning the behavioral repertoire. For the scope of this investigation, Q is fixed at 6, corresponding to six broiler conduct categories: stationary upright stance, locomotion, feed consumption, quiescence, feather grooming, and wing beating.
 (2)
(2)
From the Q potential classifications, the behavioral designation yielding the peak σ magnitude is elected as the momentary conduct manifested by the subject bird.
The internal configuration of the LSTM is illustrated in Figure 6. The activation emitted by the j-th memory cell, hj, derives from a computation involving the stored cell state cjt, the dedicated input sj routed to that cell, and the coordinated functioning of three gating pathways: the input modulator ij, the forgetting modulator mj, and the output modulator oj. These gating components undergo training and, respectively, dictate which signals the cell commits to memory, the persistence interval of that retention, and the moment of release. The constant error carousel (CEC) enables the maintenance of transient memory traces over extended temporal spans. Once retained content ceases to carry relevance, the forgetting gate drives the cell state back to a null value, accomplishing a full reset. This resetting operation curbs unbounded growth in the cell state magnitude and equips the memory cell to smoothly absorb new data, eliminating disruptive interference from previously stored information. The aggregate input received by memory cell sjt is expressed through the following formulation:
 (3)
(3)
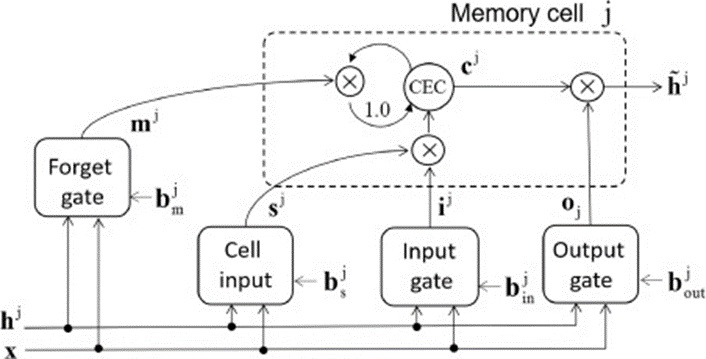
Figure 6. Memory block of LSTM displaying the j-th memory cell. The CEC maintains the cell state cjt, which the forget gate can reset. The input and output gates control read and write access to the CEC.
In this expression, xt denotes the input vector at time index t (the current input), with dimensions K×1. At the same time, ht−1 encodes the memory or historical activation propagated from the immediately preceding time index. The notation Wj∗ and Vj∗ denote the weight coefficient matrices applied to xt and ht−1, respectively; bj denotes the bias offset vector. These parametric arrays and offset terms are optimized during the learning regimen. σ symbolizes the logistic sigmoid squashing function fj(⋅), confined to the output interval [0, 1]. The resulting activation of the input gate ijt∈[0,1] is subsequently specified according to expression (4).
 (4)
(4)
The activation level of the forget gate, mjt∈[0,1], detailed in expression (5), governs the proportion of existing information that persists versus is discarded in the current cell state. The CEC performs additive accumulation of incoming magnitudes, modulated by a discount factor derived from the forget gate’s emitted value. A forget gate output approaching 1 corresponds to “unconditional preservation” of the stored state, while an output approaching 0 signals “comprehensive purging” of the stored state.
 (5)
(5)
The revised cell state is subsequently obtained through the following computation:
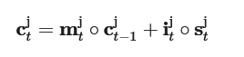 (6)
(6)
At the temporal origin t = 0, the cell state is instantiated to a null value, c0 = 0. Under these conditions, activation propagates continuously within the CEC for as long as the forgetting gate sustains a permissive setting (mjt≈1). The symbol”∘“denotes the Hadamard product operation (element-wise multiplication). The output gate oj exerts regulatory control over accessibility to the memory block’s stored contents, as formalized below:
 (7)
(7)
The terminal output of the memory cell hjt emerges from multiplying the stored cell state cjt by the output gate’s activation magnitude:
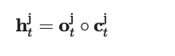 (8)
(8)
Wherein, the initial condition for h0 is set to 0.
To conclude the forward propagation, the activation across the output hidden units K populating the hidden stratum of the LSTM is evaluated as:
 (9)
(9)
Where the index K traverses all units that project connections to the output layer.
Acknowledging that the activity intensity exhibited by poultry emerges from the proportional allocation of time between motile and immotile conditions within the housing context, a hierarchically structured dual-layer FLI has been engineered to deliver efficient quantification of these activity gradations. This architecture integrates three discrete inferential mechanisms, labelled FLI 1, FLI 2, and FLI 3 (Figure 7). The cumulative temporal occupancy of “Eating,” “Walking,” “Flapping,” and “Preening” is supplied as the input vector to FLI 1, collectively capturing the motile dimension. The temporal occupancies of “Resting” and “Standing” are furnished as inputs to FLI 2, representing the immotile dimension. The inferential outputs issuing from FLI 1 and FLI 2, which respectively encode the motile magnitude and the stationary magnitude, are subsequently channeled as dual inputs into FLI 3. The FLI 3 output serves as the overall activity designation.
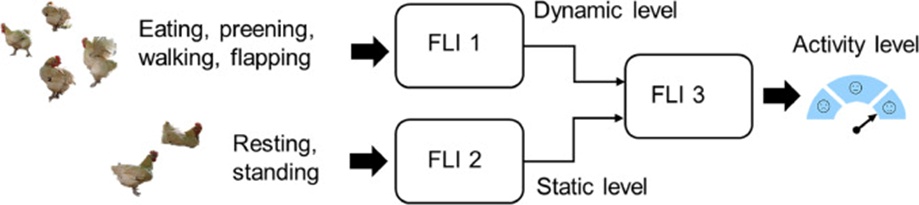
Figure 7. Block diagram of activity evaluation based on dual-layer FLIs.
a. Define the fuzzy membership functions and distribution ranges for input and output variables
As a prerequisite, every variable must be fuzzified. This transformation entails allocating a membership degree to each variable within a prescribed fuzzy ensemble, as captured by a membership function (MF). These functional mappings align with linguistic labels that characterize the variable’s intensity: “L” (Low), “M” (Medium), and “H” (High). Three distinct families of membership functions are brought to bear:
• A spline-fitted Z-shaped membership function fzmf(x;a,c), in which the parameter “a” marks the shoulder transition point, and ‘c’ pinpoints the foot boundary.
• A spline-fitted S-shaped membership function fsmf(x;a¯,c¯), in which one parameter “a¯” locates the foot boundary and the other designates the shoulder transition point “c¯”.
• A generalized bell-curve membership function fgbell(x;a˜,b˜,c˜), configured by the parameter triplet [a˜, b˜, c˜].
Membership magnitudes are then derived for every supplied input x in accordance with these functional forms. Figure 8 renders the graphical contours of the “L” (Low), “M” (Medium), and “H” (High) MFs.
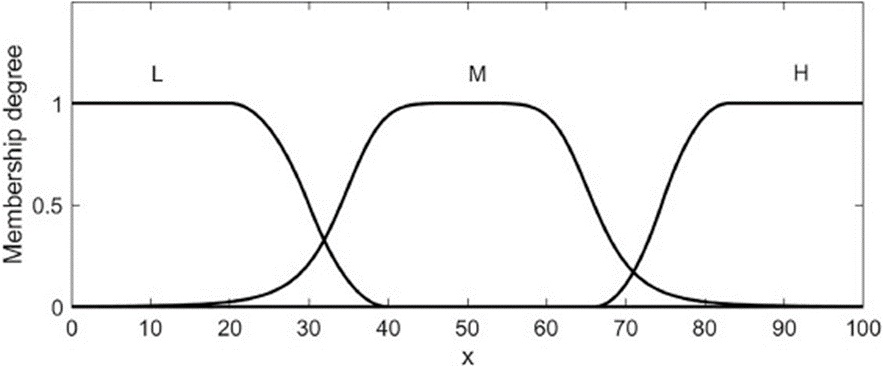
Figure 8. Example of membership function parameters definition. The linguistic variables “L” and “H” illustrate the spline-based Z-shaped and S-shaped membership functions, respectively, with parameters fzmf(x;20,40) and fsmf(x;66,83). “M” represents the generalized bell-shaped membership function, defined by the parameters fgbell(x;16,3,50).
The membership function specifications for the input and output variables of the dual-layer FLIs are enumerated in Table 1. The parametric design rationale is substantiated by extensive observational datasets of poultry behavior compiled by domain specialists and seasoned breeding staff.
Table 1. Definition of parameters of MF for input and output variables of dual-layer FLIs.
Linguistic variables | Activity level | Static level | Dynamic level | Resting | Standing | Flapping | Preening | Eating | Walking |
L | [20 40] | [20 40] | [20 40] | [0 10] | [0 10] | [0 0.6] | [0 1] | [0 4] | [0 8] |
M | [16 3 50] | [16 3 50] | [16 3 50] | [5 3 15] | [4 3 9] | [0.2 3 0.5] | [0.5 3 1] | [1 3 5] | [4 3 8] |
H | [66 83] | [66 83] | [66 83] | [15 25] | [12 22] | [0.7 1.3] | [1.5 2.5] | [3 7] | [11 19] |
b. Design fuzzy rules
The conditional framework represented by [IF-THEN] and [IF–AND… AND–THEN] syntactic structures serve to encode both the premise (conditional) and conclusion (resultant) segments of fuzzy rule formulations. These rule bases are constructed upon the accumulated practical wisdom of avian husbandry experts, findings from scholarly literature, and experimentally grounded evidence. Across the entire proposed system, a total of 99 rules have been codified, distributed among the three FLI modules: FLI 1 accounts for 81 rules, FLI 2 for 9, and FLI 3 likewise for 9. The complete rule matrices governing the operation of these three inferential units are compiled in Tables 2-4, respectively. To provide a concrete illustration, the gray-highlighted entry appearing within Table 2 translates to:
(10) IF (“Eating” is L ) AND (“Walking” is L ) AND (“Flapping” is M ) AND (“Preening” is M) THEN (Dynamic Level is M)
Table 2. The fuzzy rule table for FLI 1.
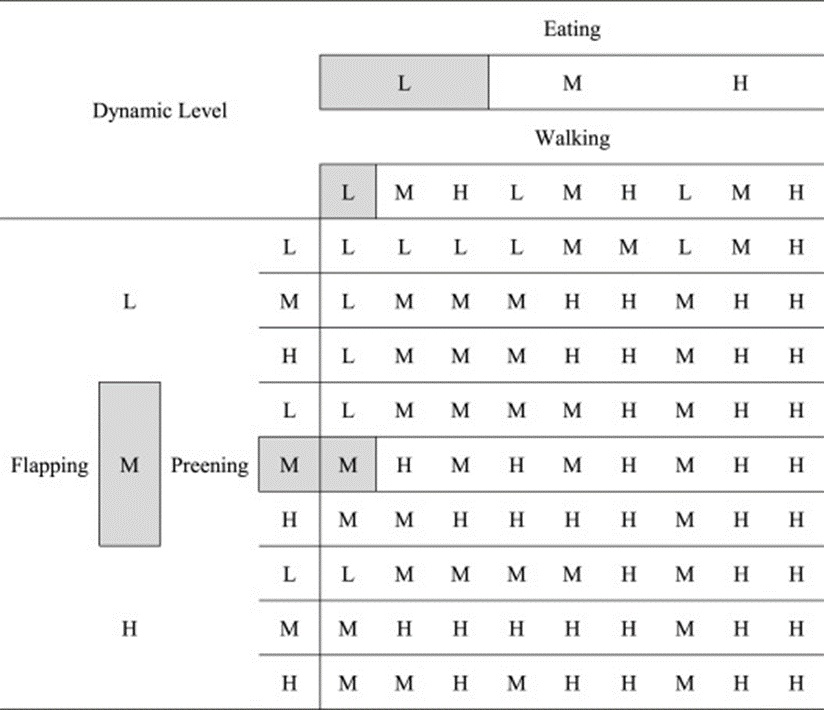
Table 3. The fuzzy rule table for FLI 2.
Static Level | Resting | |||
L | M | H | ||
Standing | L | L | L | M |
M | L | M | H | |
H | M | H | H | |
Table 4. The fuzzy rule table for FLI 3.
Activity | Dynamic Level | |||
L | M | H | ||
Static Level | L | L | M | H |
M | L | M | H | |
H | L | L | H | |
The semantic content of the foregoing rule is as follows: whenever a broiler devotes a low proportion of time to both feeding and locomotion, together with a medium proportion of time to wing beating and feather grooming, the inferred dynamic intensity is classified as medium. The manner in which broiler activity gradations shift in response to variations in the dynamic and static contributing factors is visualized in Figure 9.
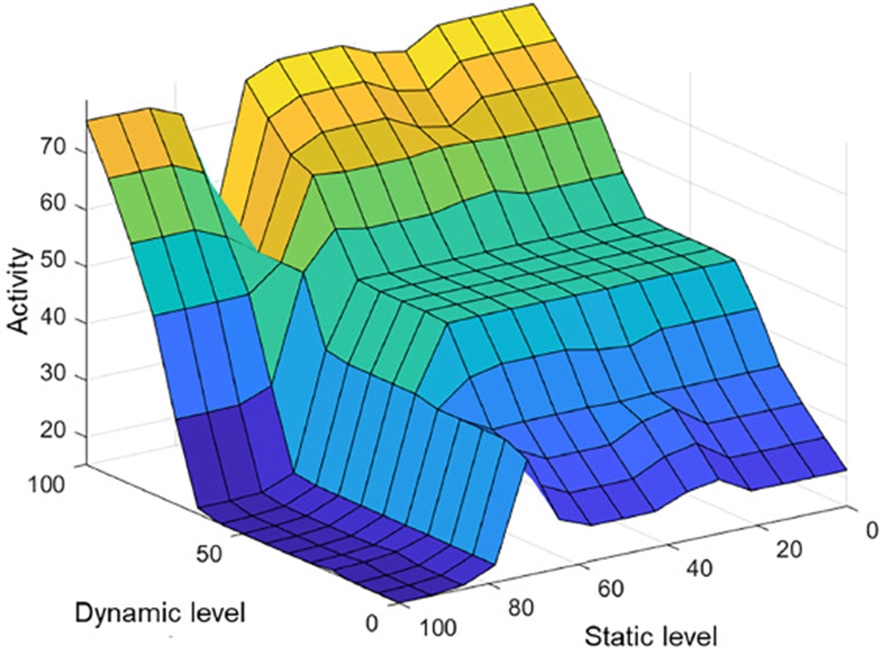
Figure 9. Rule surface visualization for FLI 3 output.
c. Decision making
This investigation adopts the Mamdani inferencing scheme. Compositional “Max-Min” operators are brought to bear for computing conjunctive intersections (via the “Min” function) and disjunctive unions (via the “Max” function) between pairs of fuzzy ensembles, thereby ascertaining the membership magnitudes belonging to the resultant fused fuzzy set. As rendered in Figure 7, the crisp numerical inputs (Dynamic Level = 75.7 and Static Level = 35) cause a total of nine rules within FLI 3 to fire. Across each activated rule, the “Min” function evaluates membership grades spanning the antecedent propositions and the corresponding consequent terms alike. Thereafter, the “Max” function fuses the membership grades of the implicated consequents into a single aggregated membership function with an accompanying composite degree, depicted as the blue-filled region occupying the lower-right quadrant of Figure 10. The inferential chain concludes with a defuzzification operation, from which a crisp activity level reading of 63.6 emerges (indicated by the bold red vertical markers).
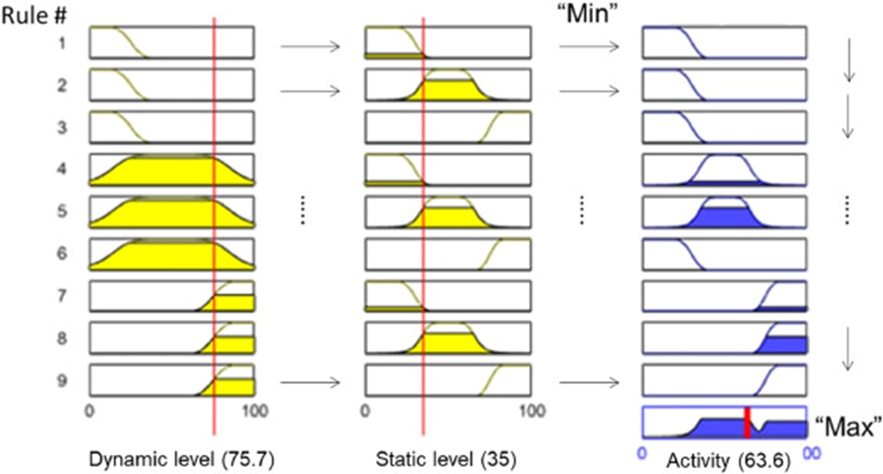
Figure 10. “Max-Min” Operation. The crisp values for the dynamic and static levels are 75.7 and 35, respectively. The defuzzification result for activity level is 63.6 (red thick bars).
d. Defuzzification
Within FLI-based processing pipelines, defuzzification is a critical transformation stage that converts the blended fuzzy output into a precise, practically interpretable numerical quantity [40]. To determine broiler activity intensity, the centroid computation method has been selected.
The trial enclosure, whose spatial extent measured 1.8 × 1.8 × 1 m³ (length × width × height), held a cohort of three birds: a pair of native chickens displaying red plumage coloring (one of each sex) together with a single male Wenchang chicken, their respective ages standing at 16 and 21 weeks. The housing pen was provisioned with feeding troughs and drinking stations but lacked any artificial lighting fixtures. An imaging assembly, positioned at roughly 30 cm above the pen floor, consisted of a wide-angle camera unit (Model: SJ5000X, SJCAM) connected to a computing device (Model: MSI GF65 Thin 10SD, MSI Technology). Video data were acquired at a temporal sampling rate of 8 frames per second, with continuous recording from 9 AM to 3 PM, for a total capture span of 6 hours. From the resulting videographic archive, 5000 static frames were selected to represent a spectrum of naturally occurring lighting conditions. Annotation of the extracted frames was carried out using the LabelImg software tool, which enabled target entities within each frame to be demarcated and converted to YOLO-compatible format. The allocation of samples employed for training versus testing the two deep learning architectures is itemized in the following table. For the broiler detection model, the training partition comprised 4500 frames, and the testing partition contained 500 frames; in parallel, the anatomical landmark detection model was trained on 4500 frames and tested on 500 frames. A detailed summary of these splits is furnished in Table 5.
Table 5. Training and testing dataset for the two-stage deep learning models.
Category | Training | Testing | ||||
Chickens | 4500 | 500 | ||||
Parts | Head | 4500 | 445 | |||
Body | 4444 | 490 | ||||
Tail | 4489 | 485 | ||||
Left foot | 4490 | 495 | ||||
Right foot | 4465 | 499 | ||||
Behavior | Standing | 800 | 4500 | 86 | 500 | |
Walking | 710 | 81 | ||||
Resting | 830 | 82 | ||||
Eating | 750 | 83 | ||||
Preening | 690 | 88 | ||||
Flapping | 720 | 80 | ||||
A computational platform offering high throughput (Model: Intel i7-12700, Intel Co.) and supplemented by a dedicated graphics processing accelerator (Model: NVIDIA RTX 3080Ti, NVIDIA Co.) was employed. The software stack consisted of Ubuntu 18.04, CUDA 10.1, cuDNN, CMake, and OpenCV 4.5.5. Feature map inputs passed to both YOLO v4 models were standardized to a spatial resolution of 416×416 pixels. The hyperparameter specifications for both models are presented in Table 6.
Table 6. Hyperparameters of the two deep learning models.
Empty Cell | Batch size | Subdivision | Momentum | Decay | Initial learning rate | Iteration |
Model 1 | 64 | 16 | 0.9 | 0.0005 | 0.001 | 10000 |
Model 2 | 64 | 8 |
Data batches structured with the dimensions 4×6 (U×N) are introduced into the input stage of the LSTM. The architecture incorporates two consecutive hidden strata, each containing M=50 units (LSTM cells), which feed forward into a densely connected layer. Class assignment is effected via softmax activation, with the associated loss quantified through cross-entropy. Optimization is performed using the Adam algorithm, with 50 training epochs and a minibatch size of 50 data instances per update step.
Beyond this, preparing the LSTM network model presupposes the availability of paired exemplars that map broiler postural angle configurations to the corresponding behavioral labels. Advanced verification must confirm that no instances of absent angle measurements occur throughout the recognition workflow. To this end, a webcam is deployed in advance to record the birds’ daily routine behaviors. The captured videographic sequences are then pre-converted into consecutive multi-frame image stacks. Thereafter, human operators manually select individual birds and their anatomical landmarks from the imagery, annotate them, compute angular separations between skeletal linkages, and ultimately assign behavioral designations. The dataset thus compiled provides the foundation for training the LSTM network model.
Three well-established evaluation criteria—namely, precision, recall, and the F1-score—were applied to assess the effectiveness of the two deep learning models in classifying broilers of different types. Table 7 presents the classification outcomes from both deep learning architectures. Among the categories, Model 1 showed the strongest identification performance on Wenchang chickens, followed by red-plumaged males and red-plumaged females, with an overall recognition rate of 90%. Model 2 performed best at locating the cranial region, achieving a detection rate of 90%. In contrast, the detection rates for the remaining anatomical landmarks were comparatively lower, with limb identification yielding the lowest accuracy at approximately 80%. The LSTM-based classifier achieved its peak accuracy of 86% on instances of “Resting” behavior (Table 8). For the remaining behavioral categories—namely “Standing”, “Walking”, “Eating”, “Preening”, and “Flapping”—the recognition rates ranged from 50% to 70%.
Table 7. Recognition results of two deep learning models.
Performance index | Model 1 | Model 2 | ||||||
Chicken 1 | Chicken 2 | Chicken 3 | Head | Body | Tail | Left foot | Right foot | |
Precision | 0.902 | 0.852 | 0.965 | 0.902 | 0.852 | 0.865 | 0.792 | 0.801 |
Recall | 0.885 | 0.814 | 0.942 | 0.885 | 0.814 | 0.843 | 0.754 | 0.782 |
F1-score | 0.893 | 0.833 | 0.953 | 0.893 | 0.833 | 0.854 | 0.773 | 0.791 |
Table 8. Recognition results of chicken behavior.
Empty cell | Standing | Walking | Eating | Resting | Preening | Flapping |
Precision | 0.692 | 0.671 | 0.862 | 0.652 | 0.508 | 0.562 |
Recall | 0.805 | 0.483 | 0.816 | 0.744 | 0.517 | 0.743 |
F1-score | 0.741 | 0.559 | 0.855 | 0.692 | 0.505 | 0.638 |
Table 9 presents the behavioral classification rates disaggregated by time-of-day window. Inspection of these figures reveals that resting conduct consistently attains the highest identification accuracy among the six behavior types, peaking at 80%. At the opposite end of the spectrum, the classification of wing flapping registers the poorest performance. Recognition rates associated with “Standing”, “Walking”, and “Eating” reside within the 52% to 55% corridor.
Table 9. Daily behavior recognition rates (%) for each chicken. (“none” means there is no such behavior or the identification fails).
Behavior | ID | Standing | Walking | Eating | Resting | Preening | Flapping |
09:00∼10:00 | ID 1 | 62.2 | 53.1 | 55.0 | 85.0 | 46.0 | 19.6 |
ID 2 | 54.0 | 53.8 | 57.2 | 78.5 | 42.6 | 26.4 | |
ID 3 | 53.3 | 54.3 | 54.8 | none | 37.7 | 26.0 | |
10:00∼11:00 | ID 1 | 63.0 | 55.7 | 50.5 | 81.5 | 39.1 | 11.5 |
ID 2 | 51.2 | 50.0 | 51.0 | 84.6 | 31.3 | 22.7 | |
ID 3 | 50.9 | 50.9 | 51.1 | 75.1 | 50.9 | 11.2 | |
11:00∼12:00 | ID 1 | 58.9 | 55.7 | 50.6 | 84.3 | 37.3 | 30.0 |
ID 2 | 56.8 | 54.1 | 55.8 | 80.7 | 46.7 | 16.8 | |
ID 3 | 51.3 | 52.4 | none | 74.2 | 44.4 | none | |
12:00∼13:00 | ID 1 | 56.4 | 55.1 | 56.0 | 82.4 | 37.7 | 28.0 |
ID 2 | 54.3 | 51.5 | 50.6 | 79.6 | 49.3 | none | |
ID 3 | 50.9 | 54.7 | 51.3 | 74.5 | 32.0 | 17.5 | |
13:00∼14:00 | ID 1 | 57.2 | 53.8 | 51.6 | 83.9 | 35.1 | 20.4 |
ID 2 | 56.5 | 50.8 | 51.2 | 83.7 | 36.9 | 11.6 | |
ID 3 | 54.6 | 52.7 | 52.1 | 78.4 | 38.2 | 25.6 | |
14:00∼15:00 | ID 1 | 54.3 | 53.6 | 52.8 | 84.5 | 50.3 | 14.1 |
ID 2 | 51.0 | 52.2 | 55.3 | 77.8 | 45.4 | 26.3 | |
ID 3 | 52.1 | 51.6 | 52.4 | 78.6 | 49.9 | 18.5 | |
Average recognition rate | 54.9 | 53.1 | 52.9 | 80.4 | 41.7 | 19.5 | |
Still-frame captures depicting activity manifestations, together with the associated recognition outputs for the trio of subjects at multiple time points, are assembled in Figure 11. These images also convey the lighting distribution across different daytime segments. Notably, throughout the 11-12 PM slot (Figure 11c), one bird (on the left side) falls under pronounced illumination intensity. Despite correct bounding box placement, the postural configuration of this individual cannot be resolved. By contrast, during the 1-2 PM interval (Figure 11e), the subject on the right remains identifiable even under reduced ambient lighting. A demonstrative video documenting these observational sequences is available under the filename “compressed_demo_video.mp4.”
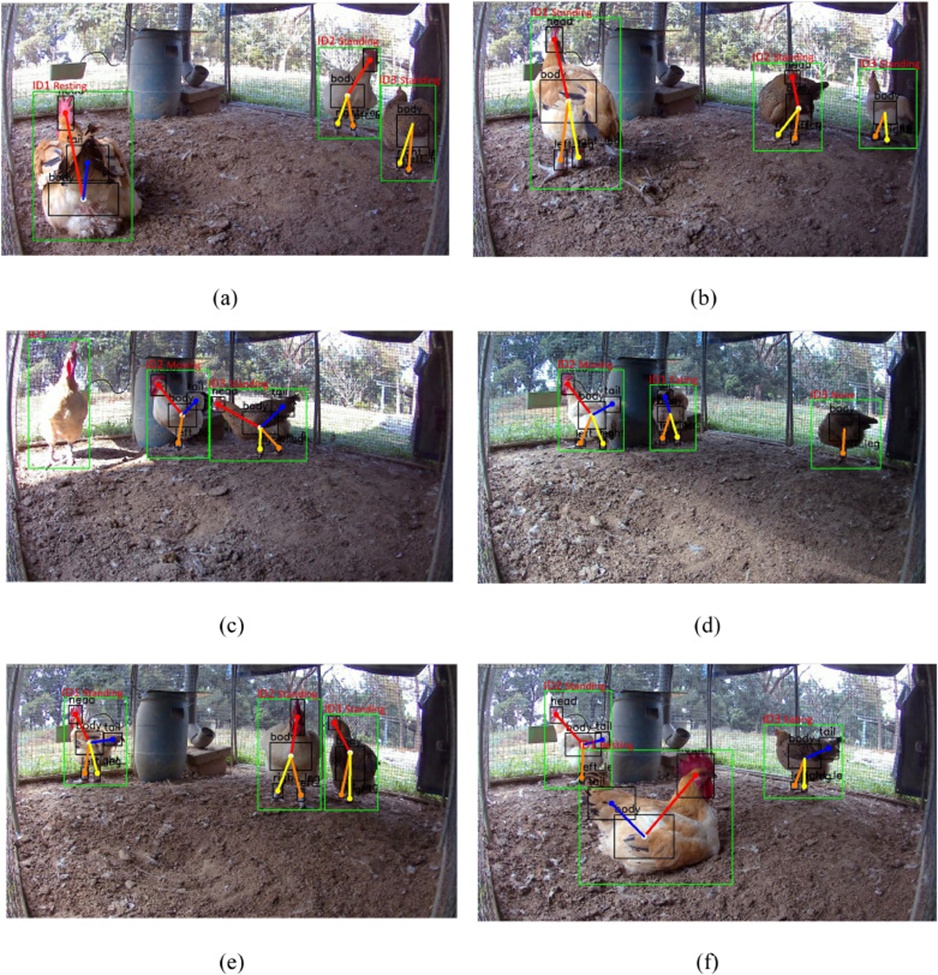
Figure 11. Recognition of chicken behaviors: (a) 09:00-10:00; (b) 10:00-11:00; (c) 11:00-12:00; (d) 12:00-13:00; (e) 13:00-14:00; (f) 14:00-15:00.
The compiled statistical distributions of angular combinations for the six behavioral classes are displayed in Figure 12, in which each behavior spans the full angular spectrum from 0 to 180 degrees. A contributing factor that merits consideration is that, during the act of feeding, a fraction of the contents dispensed from the feeding apparatus may scatter onto the underlying substrate, thereby inducing the birds to perform ground-directed pecking aimed at the spilled feed particles. For this reason, the allowable angular interval for ingestive behavior is maintained at 0° to 180°.
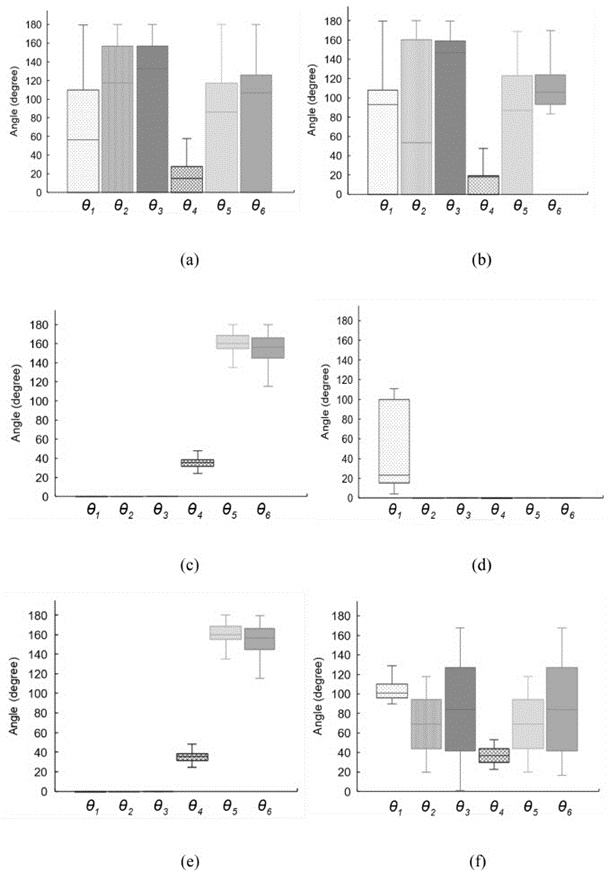
Figure 12. Correlation between the distribution of backbone angles and chicken behaviors: (a) Walking; (b) Standing; (c) Eating; (d) Resting; (e) Preening; (f) Flapping.
The plotted data demonstrate how the angular magnitudes θ1-θ6 are used to distinguish between standing and ambulatory behavior in broilers. It is noteworthy that, although the value ranges spanned by θ1 to θ5 exhibit considerable overlap between these two behavioral modes, the range occupied by θ6 displays a distinct separation. Beyond this, θ4, θ5, and θ6 are utilized to distinguish ingestive behavior from feather grooming, whereas the particular magnitude assumed by θ1 is singled out as the defining characteristic for resting behavior.
The durations of six chicken behaviors were logged across a single day, with the observation window spanning 9 AM to 3 PM. Hourly records of each behavior’s length were captured for every bird and fed into a fuzzy logic inference engine to gauge the activity levels within that interval, as depicted in Figure 13. Over the course of the day, the trio of chickens exhibited a dip in activity during the noon stretch (12:00−13:00) and a surge in the morning (09:00−11:00) and later afternoon (14:00−15:00) (Figure 14). Published studies note that chickens are more apt to preen and rest in the noon period. To be specific, red-feathered chickens demonstrate maximal eating, standing, and walking activity at 8 AM, and an uptick in pecking, chasing, and mating from 1 PM to 4:30 PM [41]. Further investigations covering diverse chicken breeds housed in mixed-gender groups reveal that all birds heighten their preening, standing, and walking in the early morning and evening, while intensifying drinking and resting later in the day. These patterns closely align with the study's inference outcomes.
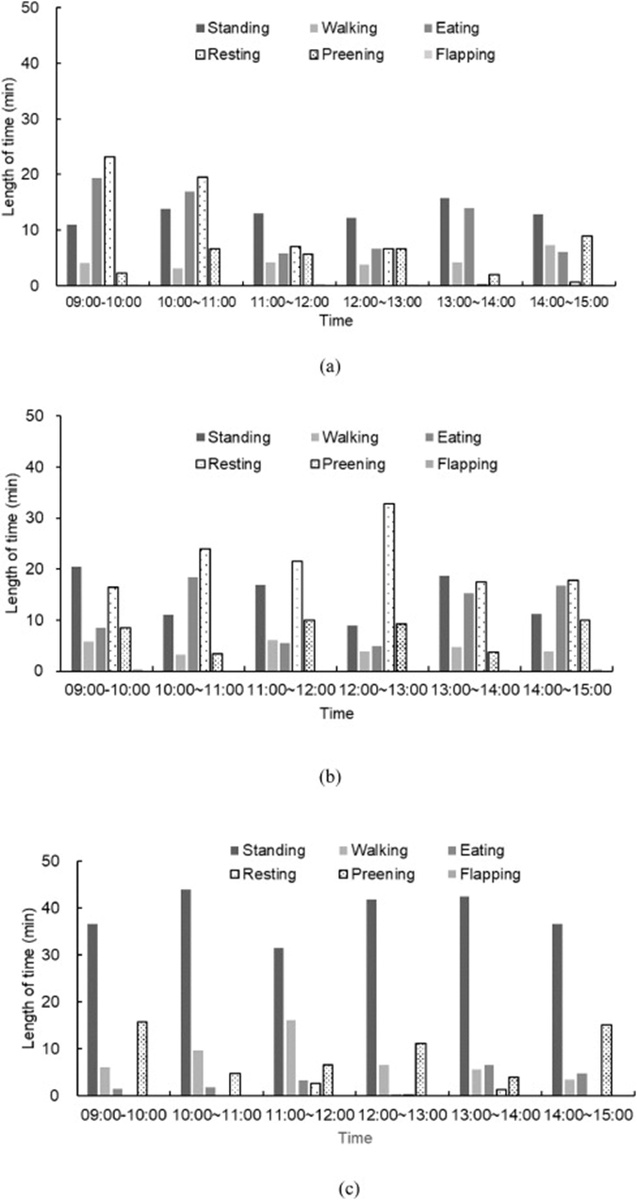
Figure 13. Duration of six behaviors exhibited by each of the three chickens during various time intervals: (a) Chicken 1; (b) Chicken 2; (c) Chicken 3.
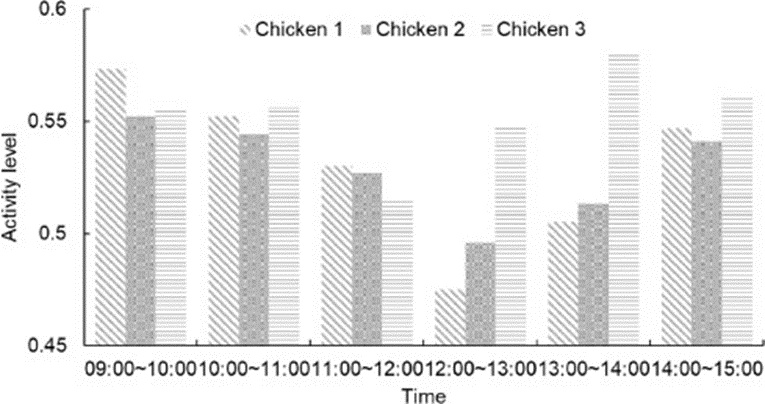
Figure 14. Comparison of daily activity level evaluation results for the three chickens.
The deep learning architecture successfully distinguishes between the two chicken categories: roosters and hens. By applying an IoU threshold of 0.7, Model 1 upholds a minimum detection accuracy of 85%. Such precision is vital for Model 2 to reliably localize body parts. During real-world testing, the system pinpointed part locations (in pixels) with high fidelity when the IoU criterion was stringent. However, opting for a stricter IoU threshold reduces the frequency of part recognition relative to a more lenient threshold, thereby increasing the likelihood of missing angular information. In field deployment, a lower IoU is therefore deliberately chosen to boost the detection frequency of chicken parts. While this concession might introduce some deviation in the posture angle from the original behavior, the likelihood of this leading to an incorrect behavioral classification remains minimal.
Further hurdles stem from the constraints of a single-camera viewpoint; as a chicken moves, certain body parts can become concealed, temporarily undermining the model’s capacity to correctly interpret the bird’s pose. Additionally, overly bright illumination may wash out images, further straining the recognition pipeline.
Difficulties also emerge when a chicken’s head points straight at the camera at close range, preventing full-body posture capture. The model’s mean recognition rate across all parts hovers around 84%. The figures for the left and right feet sink to roughly 80%, the lowest among all parts, owing to their similar shapes, which erode discriminatory accuracy (Figure 15). The feet’s coloration, which frequently merges with the flooring, can also lead to misidentifications under certain lighting conditions. The mechanics of chicken locomotion heavily influence recognition success, as part visibility constantly changes. For instance, if a bird faces away from the lens or is blocked by a companion, certain parts may remain entirely hidden, leading to misclassifications. The model likewise stumbles when attempting to identify birds partly concealed by others. In practical field tests of the proposed system, when an angle cannot be extracted, the software automatically sets it to 0. Under such circumstances, the LSTM model generally assigns the pose to the “Others” category.
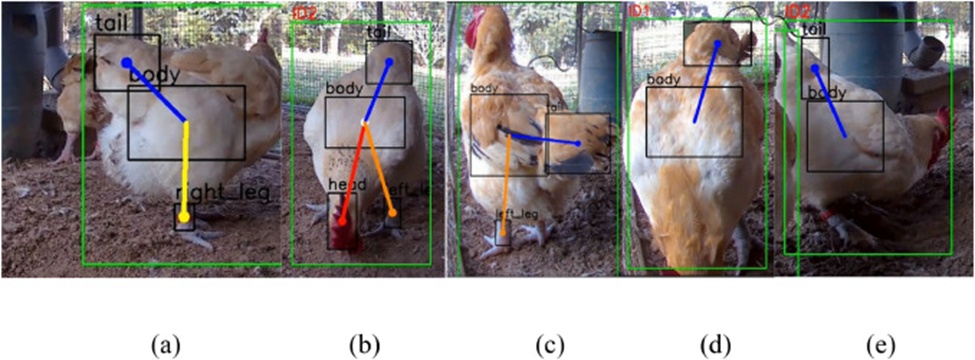
Figure 15. Examples where the recognition system fails to capture the complete skeleton of the chicken during various movements. (a) Head and left foot were not labeled, (b) Right foot was not labeled, (c) Head and left foot were not labeled, (d) Only the abdomen and tail were labeled, (e) Abdomen and tail were the only parts labeled.
Regarding the estimation of six active behaviors, deploying models to decode chicken behavior from single still frames is inherently constrained by the camera’s angle, which can lead to recognition errors and undermine accuracy [13]. Harnessing LSTM algorithms can bolster behavioral classification performance. Collected data show that among the six behaviors, “Resting” achieves the highest identification score at 86%, whereas “Preening” and “Flapping” register the poorest, averaging close to 53%. Still, in real-world experimental settings, detection rates for chicken behaviors across various time windows remain suboptimal, especially for “Flapping,” whose mean recognition rate plummets to 19.5%. The classification accuracy for “Standing,” “Eating,” and “Walking” has climbed by roughly 20% compared to implementations that forgo LSTM [42].
The behavioral recognition strategy proposed is well-suited for detecting various chicken categories and their anatomical parts, achieving strong recognition performance. It supports behavior estimation for individual birds, a scheme reminiscent of top-down methodologies [43], albeit at the cost of longer processing times as flock size grows. Fortunately, this bottleneck can be remedied through the availability of high-throughput computing hardware. It is worth emphasizing that during the part-annotation phase, improperly defined bounding boxes or landmark placements can degrade the model’s keypoint detection precision, particularly when parts are partially occluded or absent [44]. The bottom-up paradigm, on the other hand, can swiftly pinpoint key points across an image and cluster them into full poses, with detection latency largely unaffected by the count of individuals. Yet when visual features are faint, when poultry postures shift dramatically, or when birds cluster tightly, these keypoints risk being misgrouped, leading to misinterpretations of pose.
Lastly, when gauging chicken activity levels, the computational burden of the fuzzy logic system necessitates the use of multiple inference engines arranged in a two-phase cascade, operating under rules distilled from seasoned poultry keepers’ knowledge. While tracing the movement trajectories and density fluctuations of a flock can yield clues about overall activity [10], methods for personalized behavioral surveillance remain scarce. Quantifying the time chickens allocate to different activities can yield more precise and reliable assessments of activity status.
Fusing two deep learning architectures with an LSTM network has demonstrated strong efficacy for discerning broiler behaviors, even within group-housed contexts. Actions such as “Standing,” “Walking,” “Resting,” “Eating,” “Preening,” and “Flapping” are reliably differentiated, attaining recognition accuracies of up to 80%. Moreover, the two-tier FLI evaluation closely aligns with manual activity assessments, supplementing conventional health inspections by flagging behaviors that are rarely captured by human observation. This solution is especially apt for enclosed poultry buildings with stable lighting, particularly when birds occupy uniformly sized cages. It also corresponds to free-range environments and serves as a diagnostic tool for activity analysis. Future endeavors will focus on enhancing reliability and precision by developing multi-view monitoring frameworks that mitigate occlusions that cause misclassification.
This work was supported by earmarked funds from the National Science and Technology Council under grant numbers NSTC 112-2221-E-020-013 and 111-2221-E-020-024.
The authors declare the following financial interests/personal relationships which may be considered as potential competing interests:
Chung-Liang Chang reports that financial support was provided by the National Science and Technology Council. If there are other authors, they declare that they have no known competing financial interests or personal relationships that could have appeared to influence the work reported in this paper.
None
This study presents a video recording method for poultry activities. During the study period, the poultry were cared for by professional keepers and in compliance with animal welfare regulations. Research content should not be considered animal experiments.
Open Access The author(s) retain copyright. This article is licensed under the Creative Commons Attribution-NonCommercial-ShareAlike 4.0 International License. It may be shared and adapted for non-commercial purposes with appropriate attribution, an indication of changes, and distribution of adaptations under the same license. Third-party material may be subject to separate terms identified in its credit line. View the license at https://creativecommons.org/licenses/by-nc-sa/4.0/.
 Agro Intelligence Research Press