Evaluating the physical appropriateness of the terrain is an essential condition for increasing harvest productivity and allows farming populations to situate the appropriate crop in the appropriate site. Across Ethiopia, maize ranks among the fundamental staple foods and is produced throughout three agro-ecological belts: the highlands, midlands, and lowlands. Despite these realities, maize output remains critically depressed due to a lack of know-how and informational gaps regarding terrain fitness. Ascertaining the physical suitability of land for maize cultivation is indispensable to mitigating food insecurity. The current inquiry aims to assess the prospective terrain’s suitability for maize cultivation within the Didessa watershed of Western Ethiopia by deploying Multi-Criteria Evaluation (MCE) alongside geospatial tools. Shifts in land use and land cover (LULC), climatic variables, relief, edaphic characteristics, and infrastructural provisions were factored into the terrain fitness appraisal for maize. The pairwise comparison matrix grounded in MCE was applied to approximate terrain fitness for maize crop farming. The findings signified that roughly 977.7 km2 (14.1%) is rated as highly suitable, 4794.9 km2 (69.1%) as moderately suitable, whereas 1118.8 km2 (16.1%) and 51.5 km2 (0.7%) of the examined region were grouped as marginally and not suitable for maize growing, respectively. This inquiry provides vital intelligence for decision-making bodies and the cultivator community to identify prospective zones for maize farming.
On a global scale, approximately 1,162 million tons of maize were harvested in 2020 [1]. The global production of maize surged from 313 million tonnes in 1971 to 1162 million tonnes in 2020, marking an annual growth rate of 3.07% [2]. Agriculture serves as the backbone and the predominant revenue stream in Ethiopia [3, 4] Maize cultivation is widely practiced across Ethiopia [5]. It is widely raised for commercial returns, not only in Ethiopia but also internationally [6, 7]. Despite this, certain individuals are unable to feed themselves due to food shortages [8, 9]. In impoverished countries such as Ethiopia, failing to leverage existing technologies to increase yields results in meager maize harvests [10, 11]. Poor yield collections, which lead to nutritional deficits, have been reported nationwide [12, 13].
The maize plant was introduced into Ethiopia in the final decades of the 17th century [14, 15]. Inside Ethiopia, maize is raised across highland, midland, and lowland agro-environmental belts [16-18].
Lifting agricultural output in Ethiopia by adopting improved crop varieties and farm amendments is gaining momentum [19-21]. In addition to deploying superior varieties and agronomic amendments, confirming the suitability of a designated land tract before agricultural investment can facilitate the maximization of land endowment utilization [22]. Terrain fitness valuation remains acutely important for land resource planning [7, 23-25] Despite its pertinence, the terrain fitness rating for maize cultivation has garnered scant attention nationwide and within the examined zone specifically. Across Ethiopia, a handful of studies have examined the physical suitability of land for maize cultivation [26-28]. Biophysical elements, including climate (precipitation and thermal regimes), edaphic makeup, land cover, and surface height, were included in past inquiries. Be that as it may, the land surface temperature (LST) was omitted from physical terrain fitness valuation within the preceding scholarship. Hence, this inquiry was designed to bring the LST on board as a physical terrain fitness discerning benchmark.
This inquiry was pursued in the Didessa watershed, in the western reaches of Ethiopia. Geographically situated, the Didessa watershed rests between 7°49’30” and 8°54’30” N and 36°1’00” to 37°6’00” E (Figure 1). The relief configuration of the Didessa watershed spans from 1354 m to 3154 m above the mean elevation of the sea. The watershed covers an area of 6942.9 km2.
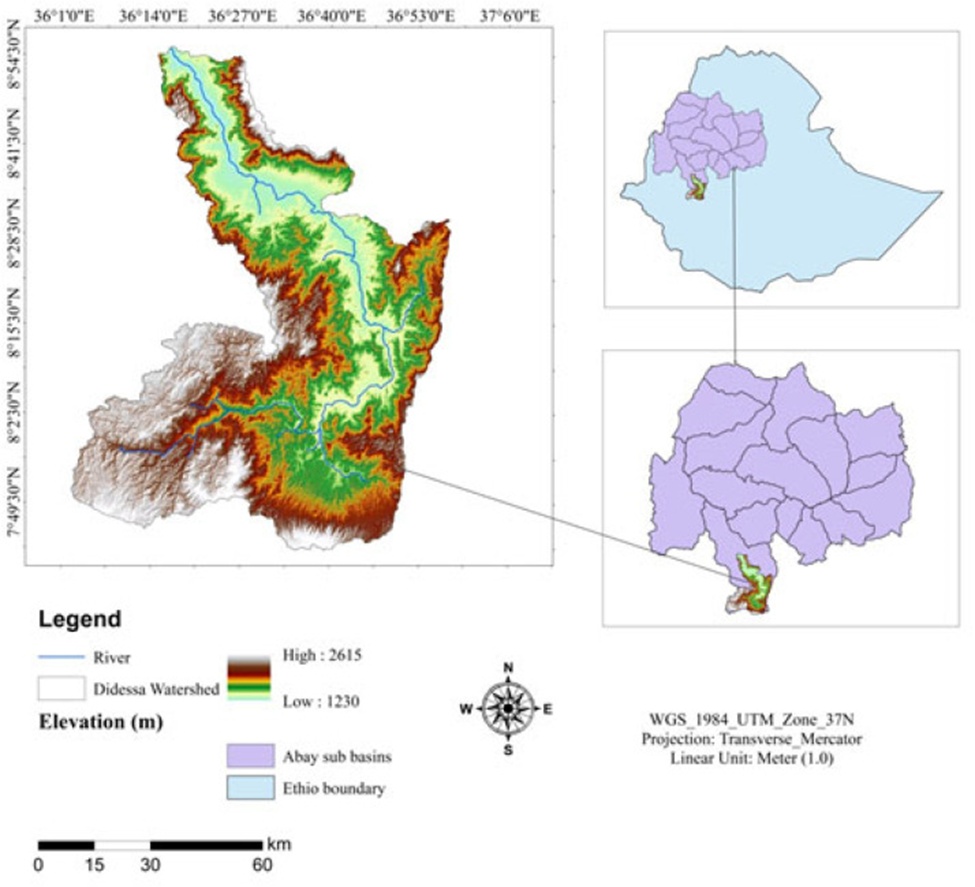
Figure 1. Location map of the study area.
The examined zone receives the greatest precipitation volume during the summer (June to September). An inquiry by [29] in the Didessa River sub-basin indicates that the mean minimum and maximum thermal readings are 13 and 26.5 °C, respectively. A separate inquiry by [30] at the Bedele measuring point, located within the Didessa River sub-basin, found that the average minimum and maximum thermal readings are approximately 11.9 °C and 26.2 °C, respectively.
The examined zone exhibits a wide range of edaphic classes. Among the present soil classes, Haplic Alisols formed the most overriding, enveloping an expanse of 4235.7 km2 (61.0%), and the least overriding soil class was Rhodic Nitisol with an expanse of 518.6 km2 (7.5%).
Landsat OLI/TIRS 2020 imagery was obtained from the U.S. Geological Survey (USGS) web gateway (https://www.usgs.gov/) for land-use land-cover (LULC) classification. Climatic information was obtained from the National Meteorological Agencies (NMA) of Ethiopia, edaphic information from the Ministry of Water and Irrigation Engineering (MoWIE), and altitudinal information from the ASTER DEM (Table 1; Figure 2).
Table 1. Descriptions of data used for the study.
Data | Data types | Resolution(m) | Sources |
Climate data | Rainfall data | 30 | NMA |
Landsat OLI/TIRS | LST, LULC | 30 | USGS |
ASTER DEM | Altitude | 30 | USGS |
Soil data | Soil types, drainage, depth, and texture | 30 | MoWIE |
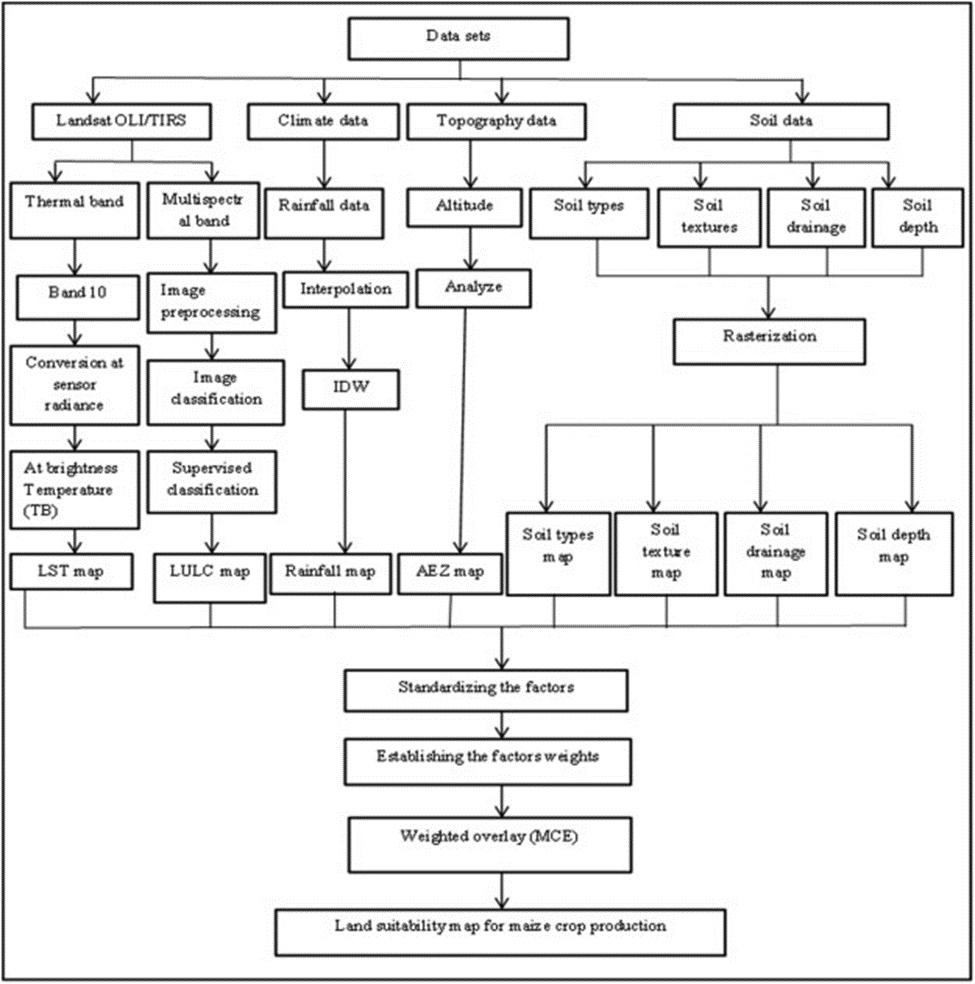
Figure 2. Methodological flowchart of the study.
Precipitation logs from four recording points situated nearby and inside the Didessa watershed, specifically Gimbi, Nekemte, Bedele, and Arjo, were secured from the Ethiopian National Meteorological Agency. We deployed the Inverse Distance Weighting (IDW) interpolation procedure to the climatic logs of the four points to generate annual precipitation information for tracts employing stations within and neighboring the investigation region. This annual precipitation was interpolated at a 30 m cell size and subsequently clipped to match the investigation region.
In the present inquiry, the LST was extracted from the thermal wavebands of the Landsat OLI/TIRS imagery for 2020 [31]). The mono-window computational approach was utilized to extract LST from the thermal wavebands of the OLI/TIRS imagery. In line with this, LST was extracted from Landsat 8 (OLI/TIRS), using thermal band 10 and the mono-window algorithm, as per [32] and [33]. Digital number (DN) values were converted to spectral radiance in the thermal wavebands of Landsat TIRS [34, 35]. Consequently, LST was approximated using the brightness temperatures of the pair of thermal infrared wavebands, along with the average and difference in land surface emissivity [36].
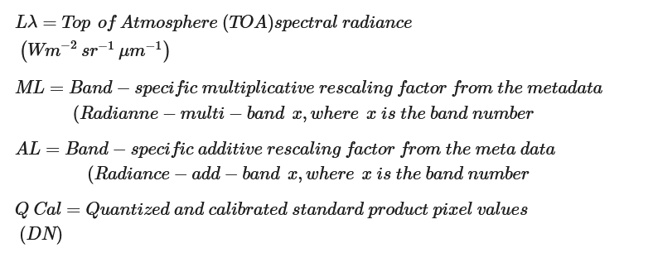
Step 1: Conversion of digital numbers to top of atmosphere (TOA) spectral radiance:
Thermal information inside the Landsat sensing instrument that conveys a mode of standing for pixels is warehoused in a digital number format that has not undergone calibration nor conversion into radiance units [37, 38], employing (Eq. 1).
 (1)
(1)
Where:
Step 2: Conversion of radiance to brightness temperature:
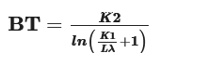
After converting the DNs into radiance, the spectral radiance of the thermal band necessitates transformation into brightness temperature (BT) as newly deployed by [38] employing (Eq. 2).
 (2)
(2)
BT = is effective at-sensor brightness temperature (K)
K2 = is the calibration constant 2
K1 = is the calibration constant 1
Lλ = is the spectral radiance at the sensor’s aperture
; and
Ln = is the natural logarithm
Step 3: Land surface emissivity estimation using NDVI:
The normalized difference vegetation index (NDVI) was used to assess the distribution of vegetative cover and its greenness. In consequence, operating as a workable basis function, it delves into the shift of NDVI into quantities tied to the cover proportion by capitalizing on empirical relationships with vegetation indices [39]. NDVI derivation remains pivotal for estimating vegetation proportion (PV). What is more, emissivity (ε), which correlates with PV, must be determined (Eq. 3).
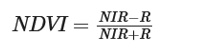 (3)
(3)
Where:
NDVI = is the normalized difference vegetation index
NIR = is the near-infrared band, and R is the red band
Landsat 8 uses Bands 5 (Infrared) and 4 (Red) to calculate NDVI values. Once NDVI was calculated, the vegetation proportion was derived, which indicates the land surface emissivity.
Step 4: Estimating the proportion of vegetation
The vegetation proportion was calculated using Eq. 4.
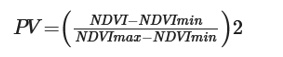 (4)
(4)
Step 5: Land surface emissivity:
The land surface emissivity (ԑ) carries weight for LST derivation. The land surface emissivity was calculated following [40] and [41] using Eq. 5.
 (5)
(5)
The radiant surface temperature was corrected for emissivity using Eq. 6.
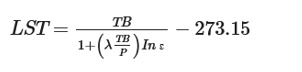 (6)
(6)
Where:
LST = is land surface temperature (in Kelvin)
TB = is the radiant surface temperature (in Kelvin)
λ = is the wavelength of emitted radiance (11.5 μm)
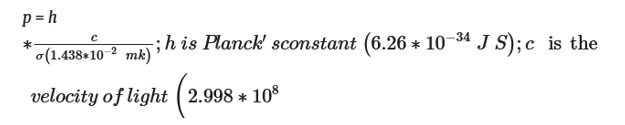
m/s); σ is the Stefan-Boltzmann constant (1.38 × 10^-23 J K−1); and ԑ is the land surface emissivity.
A digital elevation dataset (ASTER DEM) with a 30 m spatial resolution was sourced from the USGS online platform (https://www.usgs.gov/) and used to derive elevation values in meters. From this data repository, the surface relief characteristics of the investigation zone were extracted, as this information is fundamentally important for discerning terrain suitability for maize cultivation. The practice of maize crop farming was observed to be considerably more advantageous within low-lying topographic settings, with suitability declining as elevation increases [42, 43].
Edaphic records about the investigation zone were obtained from the Ministry of Water and Irrigation Engineering and subsequently subset to precisely match the spatial extent of the study area. Beyond this, the soil-related datasets were converted to a raster data model at a 30 m spatial grain and subsequently reclassified, drawing upon the methodological precedent established by [28] to enable subsequent overlay analytical procedures.
Multiple spectral channels originating from the Landsat OLI/TIRS sensor were assembled into a composite layer stack and subsequently subset to conform to the Didessa watershed boundary. LULC classification across the investigation zone was performed using a supervised maximum likelihood classification scheme. The satellite scene was partitioned into discernible classes—namely cultivated tracts, forested zones, grassland expanses, dense and open woodland formations, and built-up settlements—using ERDAS Imagine 2015.
Guided by judgments elicited from domain specialists, weighting coefficients derived from the systematic contrasting of evaluative criteria were handled using the analytical hierarchy process (AHP) modeling framework [44, 45]. This decision-support framework was first proposed by [46] to gauge the comparative significance of each evaluative criterion. [46] introduced a graduated numerical scale to communicate the relative importance of each factor, with values ranging from 1 to 9. Ultimately, the priority weights embedded within the pairwise comparison matrix were quantitatively derived (Table 2).
Table 2. Pairwise comparison matrix of parameters selected for this study.
Factors | LST | Rainfall | Elevation | Soil depth | LULC | Soil types | Drainage | Texture |
Soil texture | 4 | 3 | 3 | 2 | 2 | 2 | 2 | 1 |
Drainage | 4 | 3 | 3 | 2 | 2 | 2 | 1 | ½ |
Soil Types | 3 | 3 | 2 | 2 | 2 | 1 | 1/2 | ½ |
LULC | 3 | 3 | 2 | 2 | 1 | 1/2 | 1/2 | ½ |
Soil depth | 3 | 2 | 2 | 1 | 1/2 | 1/2 | 1/2 | ½ |
Elevation | 3 | 2 | 1 | 1/2 | 1/2 | 1/2 | 1/3 | 1/3 |
Rainfall | 2 | 1 | 1/2 | 1/2 | 1/3 | 1/3 | 1/3 | 1/3 |
LST | 1 | 1/2 | 1/3 | 1/3 | 1/3 | 1/3 | 1/4 | ¼ |
Σ= | 22.16 | 19.36 | 15.56 | 11.98 | 10.5 | 8.95 | 7.07 | 4.42 |
The consistency ratio (CR) was calculated to verify the logical soundness and reliability of the comparisons [47]. The CR was derived through the application of (Eq. 7). The numeric range of CR values stretches between 0 and 1 [46, 48]. A computed CR that falls under the threshold of 0.1 denotes a level of consistency regarded as acceptable. Working out the consistency index (CI) carries substantial weight within crop terrain suitability investigations and was derived employing Eq. 7.
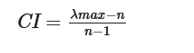 (7)
(7)
Where λ max symbolizes the principal eigenvalue yielded by the pairwise comparison matrix, and n reflects the total quantity of classes under consideration.
Following this, CR is obtained by applying Eq. 8, as recommended by [46]
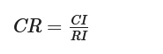 (8)
(8)
Where RI corresponds to the ratio index, capturing the averaged CI value computed from randomly generated matrices in accordance with the Saaty scale.
Each reclassified thematic layer was combined and assigned differential weights using the overlay analytical functionality in the ArcGIS computing environment. A succession of pairwise comparison matrix operations was performed to assess the relative significance of all variables slated for incorporation into the maize terrain suitability assessment, mirroring the approach adopted by [28]. The pairwise matrix comparison methodology was operationalized through Eq. 9.
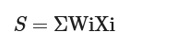 (9)
(9)
Where S stands for suitability, Wi denotes the weighting coefficient assigned to a factor, and Xi captures the criterion score corresponding to factor i.
Precipitation measurements were used to investigate the annual rainfall distribution in the study area, a factor that ranks among the absolute prerequisites for successful maize cultivation. Where rainfall is completely absent, agricultural pursuits—with particular emphasis on rain-dependent farming systems—become entirely nonviable. The northwestward portions of the Didessa watershed emerged as inhospitable to maize crop growth and development (Figure 3). Echoing the position articulated, rainfall is the single most decisive parameter in site selection for maize crop agriculture.
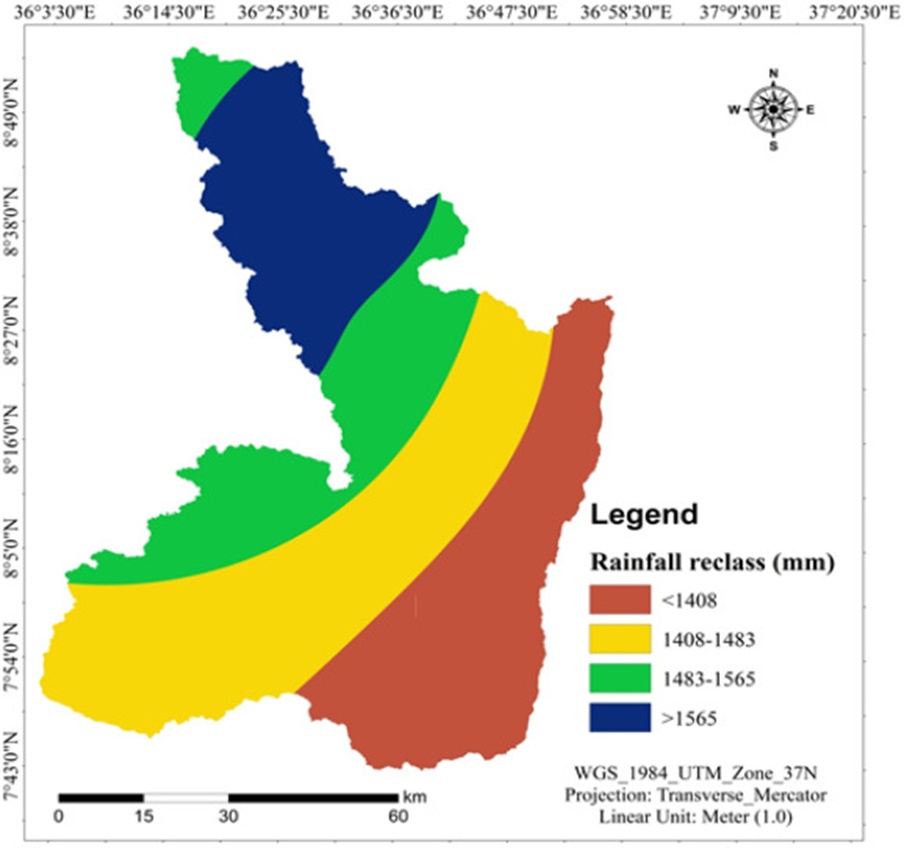
Figure 3. Annual rainfall map of the study area.
The LST characterizing the investigation zone was derived from the thermal infrared channel of the OLI/TIRS 2020 Landsat image. Warmer thermal regimes are conducive to maize crop agriculture, whereas colder conditions act as a constraint. Close to 1340.3 km2 (19.3%) of the investigation zone is classed as very appropriate for maize cultivation. The zones assessed as most appropriate exhibited a pronounced clustering throughout the central and northern geographical sectors of the investigation zone (Figure 4). On the flip side, extending across an expanse of 1171.3 km2 (16.9%), the southwestern geographical sectors of the investigation zone were judged as not appropriate for maize crop agriculture (Table 3). These observed patterns align with [7], who concluded that elevated LST readings create optimal conditions for maize crop productivity.
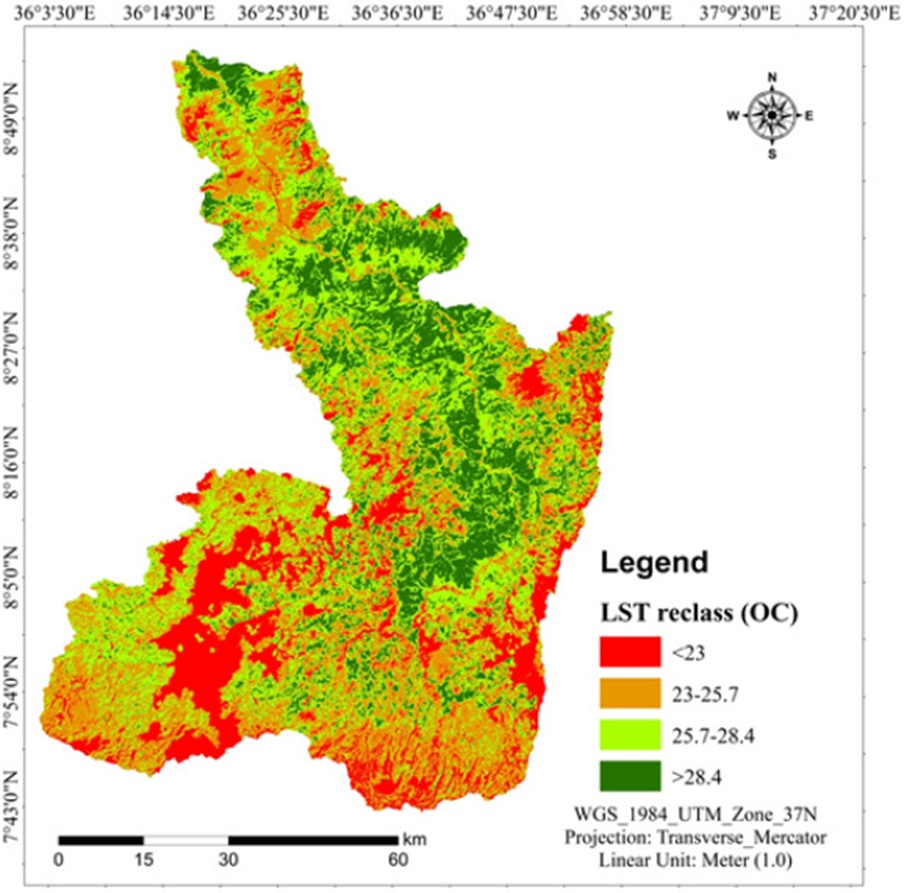
Figure 4. Land surface temperature of the study area.
Table 3. LST classes and corresponding suitability classes.
S/No | LST classes (°C) | Area (%) | Area (km2) | Suitability classes |
1 | < 23 | 16.9 | 1171.3 | Not suitable |
2 | 23–25.7 | 32.9 | 2286.6 | Marginally suitable |
3 | 25.7–28.4 | 30.9 | 2144.7 | Moderately suitable |
4 | > 28.4 | 19.3 | 1340.3 | Highly suitable |
Total | 100.0 | 6942.9 |
The agro-ecological zonation of the investigation zone was derived from the digital elevation model dataset. The foundational studies conducted by [49] and [42] served as reference points for constructing the Agro-ecological zone (AEZ) classification scheme applied to the Didessa watershed. The evidence generated through this inquiry brought to the forefront that lowland landscapes hold sway within the inner core segments of the investigation zone. In contrast, midland landscapes blanket substantial tracts of the territory (Figure 5). Our analytical outputs revealed that an aggregate of 1640.8 km2 (23.6%) of the examined landscape was determined to be highly favorable for maize crop agriculture (Table 4). Earlier investigations by [42] and [43] concluded that lowland landscape settings are well-suited for maize agricultural practices.
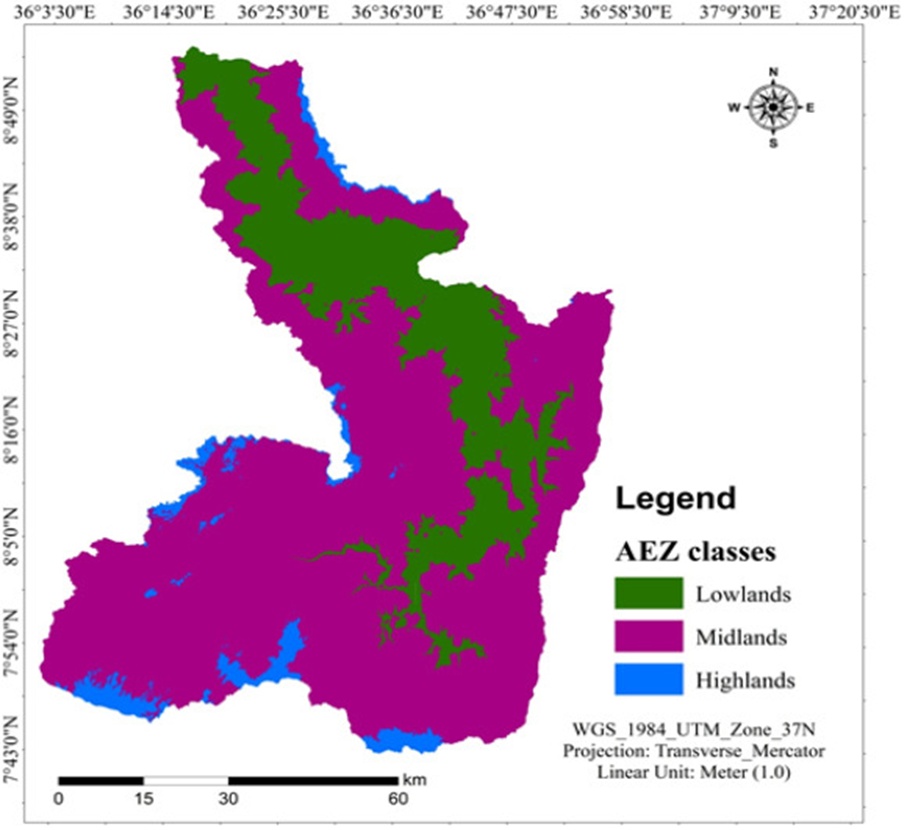
Figure 5. Agro-ecological zone of the study area.
Table 4. Agro-ecological zones and suitability classes of the study area.
S·N | Agro-ecological zone | Area (%) | Area (km2) | Suitability classes |
1 | Lowlands | 23.6 | 1640.8 | Highly suitable |
2 | Midlands | 71.9 | 4990.8 | Moderately suitable |
3 | Highlands | 4.5 | 311.3 | Marginally suitable |
Total | 100.0 | 6942.9 |
Eutric Vertisols, Haplic Acrisols, Haplic Alisols, Haplic Nitisols, and Rhodic Nitisols are counted among the principal soil typologies present within the investigation zone (Figure 6). The Haplic Nitisols, together with the Rhodic Nitisols, were singled out as being highly favorable substrates for maize cultivation, collectively accounting for a surface area of 727.7 km2 (10.5%) (Table 5). By way of contrast, spreading across an aggregate extent of 988.2 km2, the Eutric vertisols fell into the ‘not adequate’ category (14.2%). The evidence generated by this inquiry harmonizes with earlier published scholarship [50].
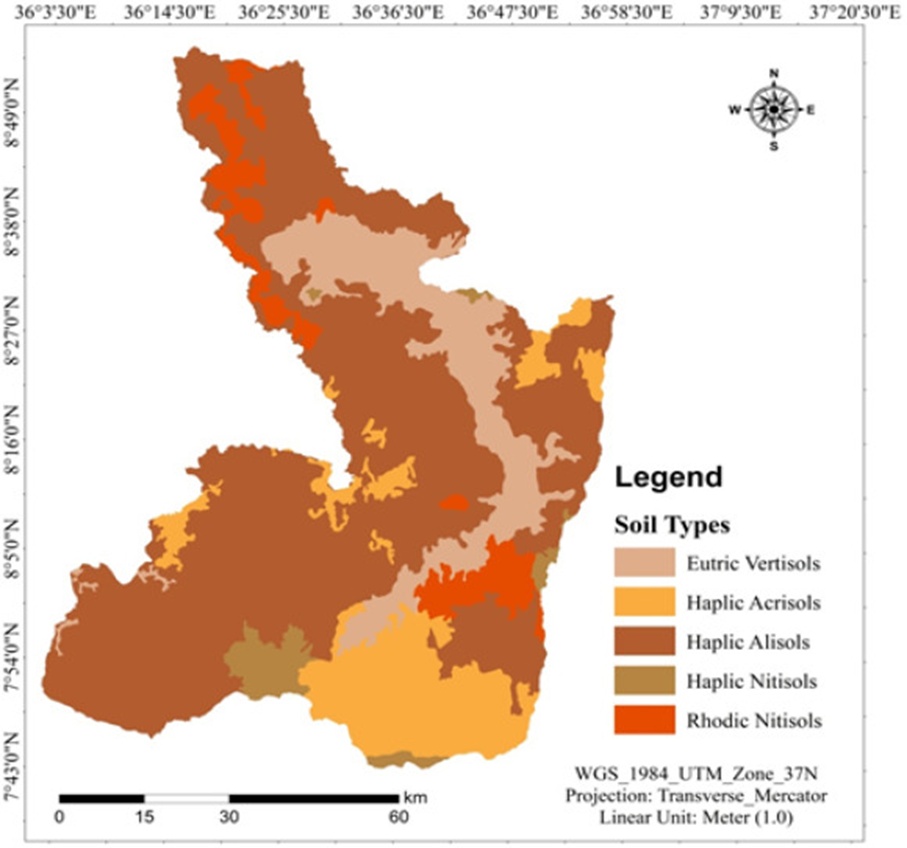
Figure 6. Soil types of the study area.
Table 5. Soil types and their corresponding suitability classes.
S·N | Soil types | Area (%) | Area (km2) | Suitability classes |
1 | Eutric Vertisols | 14.2 | 988.2 | Not suitable |
2 | Haplic Acrisols | 14.3 | 991.2 | Marginally suitable |
3 | Haplic Alisols | 61.0 | 4235.7 | Moderately suitable |
4 | Haplic Nitisols | 3.0 | 209.1 | Highly suitable |
5 | Rhodic Nitisols | 7.5 | 518.6 | Highly suitable |
Total | 100.0 | 6942.9 |
The textural composition of soils found throughout the investigation zone was partitioned into six distinct groupings: sandy clay, clay loam, sandy clay loam, loam, sandy loam, and loamy sand. Extending across an expanse of 80.7 km2 (1.2%), the textural properties of soils in the investigation zone fall under the classification of highly appropriate for maize agriculture. Spreading over an aggregate area of 10.3 km2, sandy clay is classed as unsuitable (0.8%). The sandy clay loam textural class dominates the greater part of the examined region, blanketing 3826.7 km2 (55.1%) and earning classification as moderately appropriate for maize agriculture (Table 6; Figure 7). The evidence emerging from this inquiry showed heightened correspondence with that documented in the preceding investigation [51].
Table 6. Soil texture and its corresponding suitability classes of the study area.
S/No | Soil texture | Area (%) | Area (km2) | Suitability classes |
1 | sandy clay | 0.8 | 10.3 | Not suitable |
2 | clay loam | 1.8 | 127.5 | Marginally suitable |
3 | sandy clay loam | 55.1 | 3826.7 | Moderately suitable |
4 | loam | 1.2 | 80.7 | Highly suitable |
5 | sandy loam | 35.0 | 2478.0 | Moderately suitable |
6 | loamy sand | 6.0 | 419.8 | Marginally suitable |
Total | 100.0 | 6942.9 |
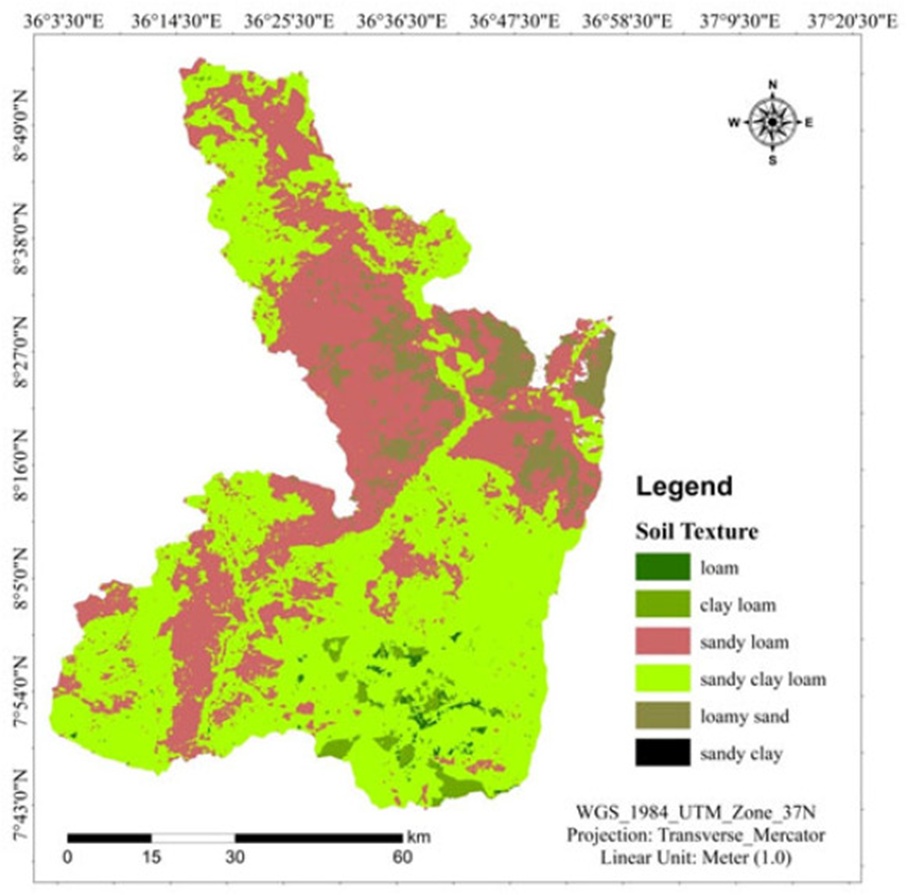
Figure 7. Soil texture map of the study area.
The cartographic representation of soil drainage conditions across the investigation zone is presented for reference (Figure 8). Five discrete drainage classes are evident, ranging from well-drained to imperfect. Research by [52] substantiates that well-drained and moderately drained soil environments are well-suited to maize agriculture. Analytical outputs underscore that 6143.1 km2 (88.5%) of the overall extent of the Didessa watershed ranks as highly suited for maize agricultural use, in contrast to 372.7 km2 (5.4%) that is deemed not suitable (Table 7).
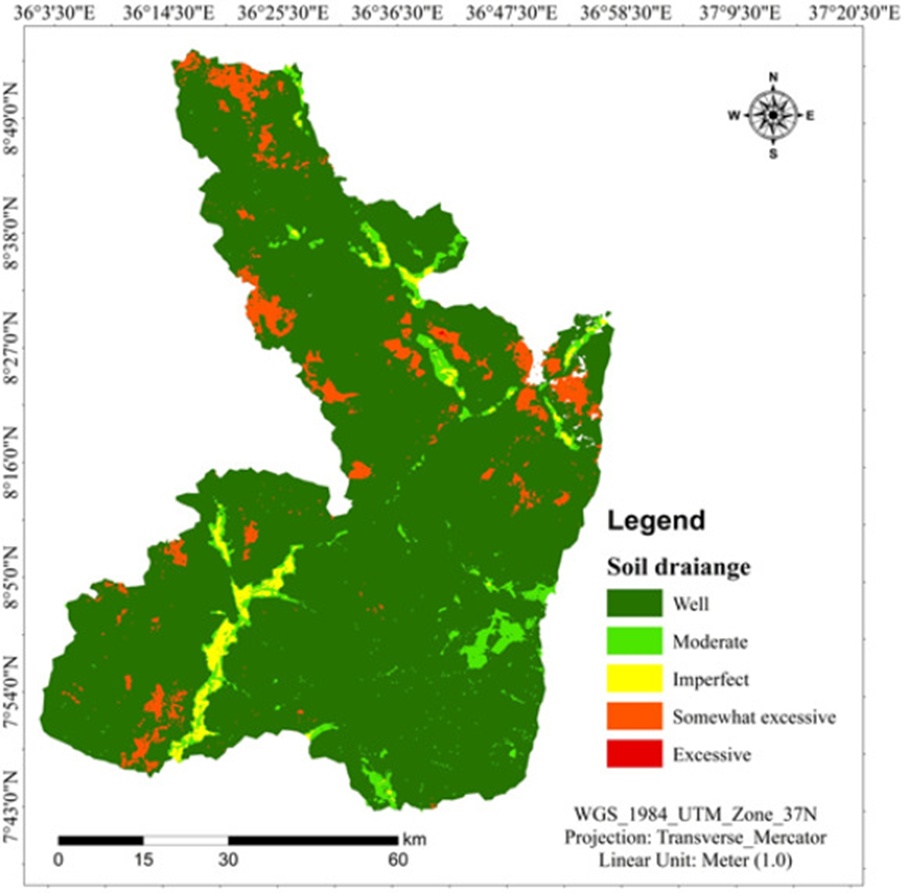
Figure 8. Soil drainage map of the study area.
Table 7. Soil drainage and suitability classes.
S/No | Soil drainage | Area (%) | Area (km2) | Suitability classes |
1 | Imperfect | 1.7 | 116.1 | Marginally suitable |
2 | Moderate | 4.5 | 311.0 | Highly suitable |
3 | Well | 88.5 | 6143.1 | Not suitable |
4 | Somewhat excessive | 5.4 | 372.0 | Not suitable |
5 | Excessive | 0.0 | 0.7 | |
Total | 100.0 | 6942.9 |
The single most indispensable edaphic attribute for designating viable terrain for maize crop growth and development is soil profile depth [53]. The productivity outcomes of maize cropping benefit substantially from deep soil profiles. Using soil depth as the diagnostic criterion, it is possible to assess the suitability of terrain for specified crops. The categorization of soil depth classes encountered within the investigation zone is illustrated (Figure 9). The analytical outputs brought into focus that 4209.4 km2 (60.6%) is highly favorable for maize agriculture, in contrast to 73.2 km2 (1.1%), which registers as unsuitable (Table 8).
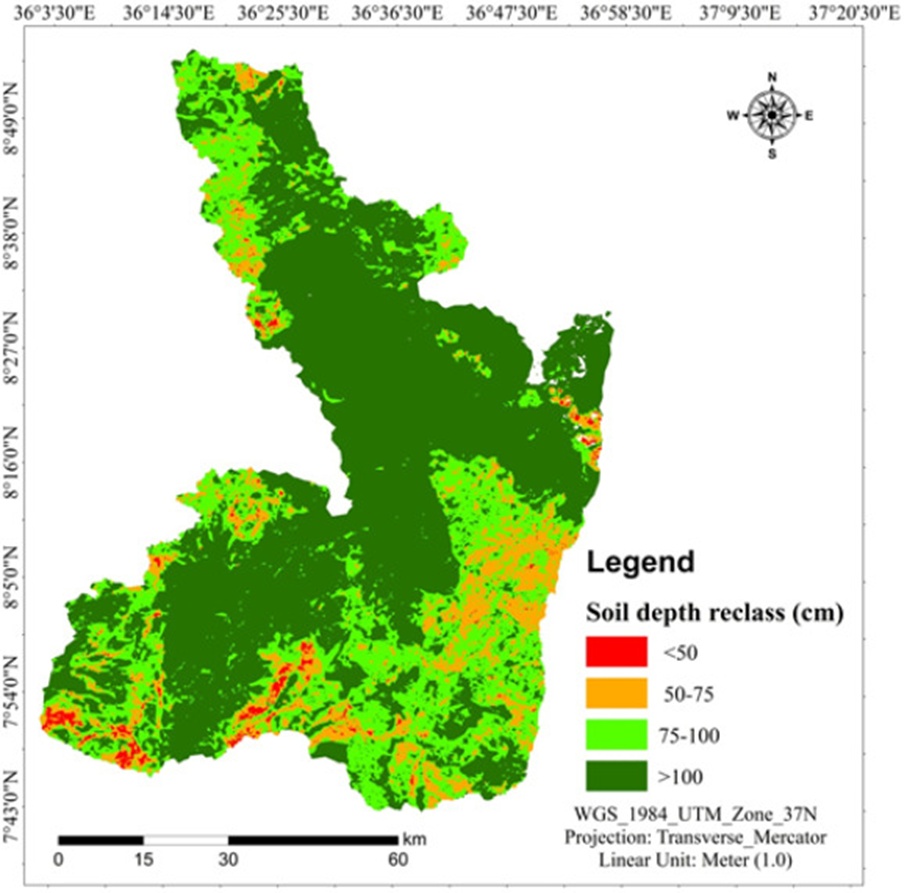
Figure 9. Soil depth map of the study area.
Table 8. Soil depth and suitability classes.
S/No | Soil depth (cm) | Area (%) | Area (km2) | Suitability classes |
1 | < 50 | 1.1 | 73.2 | Not suitable |
2 | 50–75 | 11.2 | 778.2 | Marginally suitable |
3 | 75–100 | 27.1 | 1882.2 | Moderately suitable |
4 | > 100 | 60.6 | 4209.4 | Highly suitable |
Total | 100.0 | 6942.9 |
Through the synthesis and combination of eight thematic variables, the composite terrain fitness map for maize agriculture was generated (Figure 10). The analytical outputs signified that 977.7 km2 (14.1%) together with 4794.9 km2 (69.1%) were slotted into the highly and moderately suitable brackets for maize agriculture, respectively, whereas 1118.8 km2 (16.1%) alongside 51.5 km2 (0.7%) were grouped as marginally and not suitable for maize agriculture, respectively (Table 9). These figures clearly show that the preponderant share of the investigation zone falls within the moderately suitable bracket for maize agriculture. Parallel research conclusions were reported by [28] in the Dabo Hana district. The lowland landscape belt, which exhibits spatial concentration across the central segment of the investigation zone, received highly and moderately suitable designations, attributable to the fact that warm thermal environments (as reflected in elevated LST values) are comparatively more advantageous for maize agriculture. Following this, the western sector, as well as certain eastern portions, were registered as marginally suitable for maize agriculture. Going further, the northeastern reaches, where elevated topographic positions coincide with depressed thermal regimes, were rated as unfit for maize agriculture.
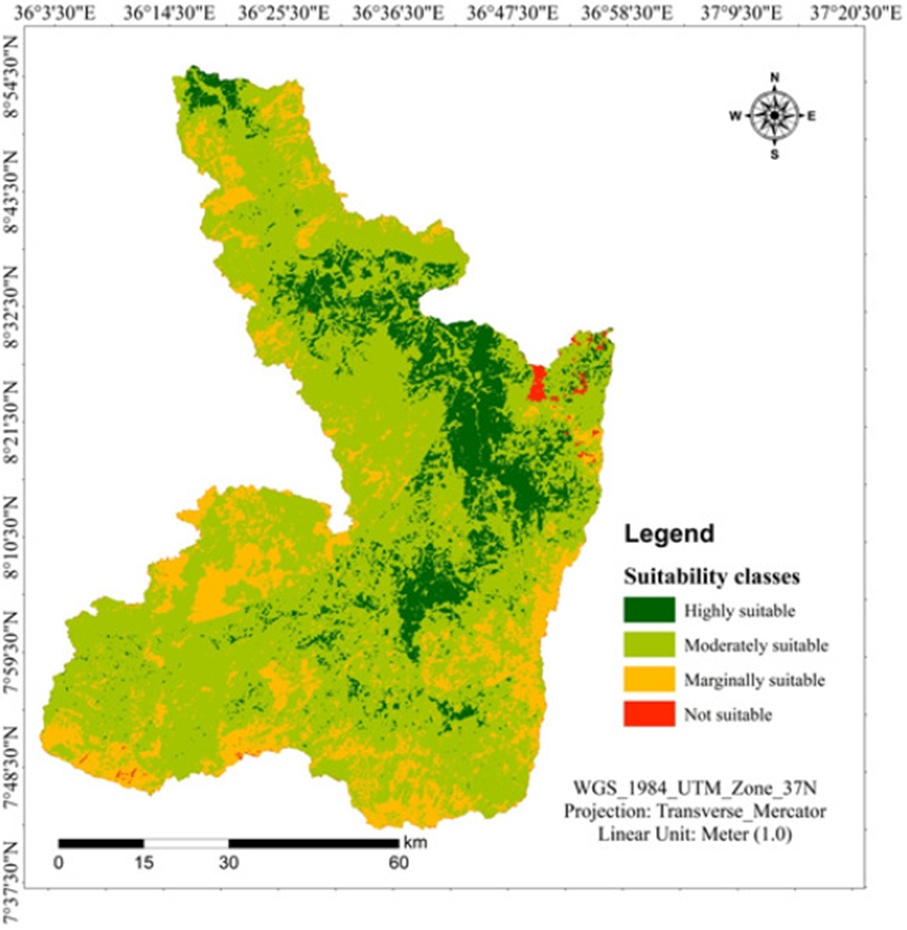
Figure 10. Land suitability areas for maize production.
Table 9. Suitability area for maize production.
S/No | Suitability classes | Area (%) | Area (km2) |
1 | Highly suitable | 14.1 | 977.7 |
2 | Moderately suitable | 69.1 | 4794.9 |
3 | Marginally suitable | 16.1 | 1118.8 |
4 | Not suitable | 0.7 | 51.5 |
Total | 100.0 | 6942.9 |
Developing a firm grasp of terrain fitness for crop agriculture serves to lift harvest outputs. It makes a meaningful contribution toward fulfilling UN Sustainable Development Goals, including the eradication of poverty and the elimination of hunger. The appraisal of terrain fitness for maize agriculture at the watershed scale is critical for strengthening food security in an economy fundamentally anchored in agriculture, as is the case in Ethiopia. A suite of variables—covering climatic parameters, LULC configurations, LST distributions, edaphic attributes, topographic characteristics, and infrastructural spatial data—was applied to evaluate the physical terrain’s fitness for maize agriculture. Throughout this inquiry, geospatial analytical methodologies were employed to identify physically suitable terrain for maize agriculture within the investigation zone. The evidence from this inquiry demonstrated that tracts with low elevations and elevated LST readings are well suited for maize agriculture. The findings highlighted that approximately 977.7 km2 (14.1%) and 4794.9 km2 (69.1%) were classed as highly and moderately suitable for maize agriculture, respectively. Around 1118.8 km2 (16.1%) together with 51.5 km2 (0.7%) were grouped as marginally and not suitable for maize agriculture, respectively. The conclusions drawn from this inquiry can bolster decision-making institutions in promoting intensified maize agriculture throughout the Didessa watershed. To reinforce food security, the agricultural communities residing within the investigation zone are advised to direct their cultivation efforts toward the highly and moderately suitable tracts designated for maize cultivation. Looking ahead, to sustain the livelihoods of agricultural communities, comparable crop-specific assessments of physical terrain fitness are slated to be conducted within the investigation zone.
The authors acknowledge Wollega University, Faculty of Technology, Shambu campus, Wollega University Gimbi campus, Wollega University Nekemte campus, and Jimma University College of Agriculture and Veterinary Medicine for providing the facilities for conducting this research.
None
None
None
Open Access The author(s) retain copyright. This article is licensed under the Creative Commons Attribution-NonCommercial-ShareAlike 4.0 International License. It may be shared and adapted for non-commercial purposes with appropriate attribution, an indication of changes, and distribution of adaptations under the same license. Third-party material may be subject to separate terms identified in its credit line. View the license at https://creativecommons.org/licenses/by-nc-sa/4.0/.
 Agro Intelligence Research Press